as FPGA, is the best solution for speeding up the ... as smart phones and portable media player requires ... ment tools are available for only the lower levels of.
Fast Run-Time Power Monitoring Methodology for Embedded Systems Kuei-Chung Chang Department of Information Management WuFeng Institute of Technology Chia-yi Taiwan, R.O.C.
Abstract Traditional simulation-based energy estimation is not practical because the simulation time has increased from minutes and hours and weeks. Therefore, simulation assisted by special hardware, such as FPGA, is the best solution for speeding up the simulation of large design. In this presentation we describe a coordinated measurement approach that combines off-line measured power models with counter-based, per-unit power estimation on FPGA emulation board. We port our CCU32 processor core and CCU DSP5 core into the Altera Excalibur EPXA10 emulation board and write an application running on these cores. The power monitor tool provides live total power measurements to identify the hot spots of a program. Overall, this design demonstrates a power measurement and estimation infrastructure which can provide a basis for future poweraware tool kits development.
Jih-Sheng Shen ,Tien-Fu Chen Department of Computer Science And Information Engineering National Chung Cheng University Chia-Yi Taiwan, R.O.C.
a high demand for optimization techniques that enable energy reduction for software, since an increasing number of applications are powered by batteries. Therefore, recent studies have been focusing on developing techniques to reduce the energy consumption at various levels, including program optimization for low power [1, 3, 4, 5, 7].
1. INTRODUCTION
There are two traditional methods used to acquire energy consumption information: simulations or measurements. Programmers find simulationbased energy estimation techniques convenient if appropriate simulation models are available [2, 6, 8]. For low-power software development, instruction- or architecture-level energy simulators such as Wattch [2] and SimplePower [8] might be better solutions. However, those cycle-accurate simulators have a reputation for being slow. At present, power measurement tools are available for only the lower levels of the design - at the circuit level and the gate level. These are very slow and impractical to use to evaluate the power consumption of software, and often cannot even be applied due to lack of availability of circuit and gate level information of the embedded processors.
Designing cost-sensitive embedded products such as smart phones and portable media player requires maximizing a platform’s performance while minimizing energy use. The more efficient version will result in a more cost-effective product. With power dissipation becoming an increasingly vexing problem across many classes of computer systems, measuring power dissipation of real, running systems has become crucial for hardware and software system research and design. Live power measurements are imperative for studies requiring execution times too long for simulation. Especially for embedded systems, there is
It is harder and harder to simulate designs because the simulation time has increased from minutes and hours to days and weeks. Therefore, the days of being able to verify ASICs and system-onchip (SOC) designs through software-only simulation are over. Simulation assisted by special hardware, such as FPGA, is the best solution for speeding up the simulation of large design sections that have been tested and accepted by RTL simulations. A verification of SOC was time consuming because there were no fast RTL simulators and easy to use hardware emulators. Dramatic increase in the density and speed of FPGAs makes them attractive for complex appli-
Keywords: SoC, low power, embedded system
cations. ARM922T
Data
The primary contributions of this design are as follows:
AHB Access Counter
• We design a simple and fast methodology for gathering live, per-unit power estimates based on component access counters and switching counters on the FPGA emulation board. Our method has great performance than gate-level simulation and software simulator.
JTAG
Data Input
Control Signal
DSP
IP
ASIC
& Switch counter
Functional Unit
FPGA Emulation Board
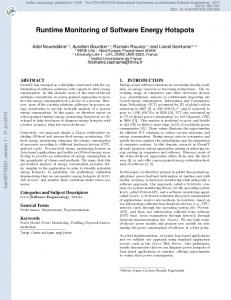
Fig. 1. The counter-based monitoring infrastructure
• We port our CCU DSP5 processor core into the Altera Excalibur EPXA10 emulation board and implement a power monitor tool to get the runtime power information. We use the information to calculate the power consumption of the DSP. • We present the idea of run-time power monitoring infrasturecure that can be used for future embedded system tool kits. It’s important for the programmers to effectively meet the energy consumption requirements for embedded systems.
2.1. The Access Counter We will monitor the access count of each functional unit during execution. We embed a counter outside the function unit to record the total access count. The value of the counter will be accumulated if the input data and the control signal of the functional unit changed. 2.2. The Switching Counter
2. POWER MEASUREMENT TRUCTURE
INFRAS-
In this section, we present the main method of our power monitor tool. We use two special counters embedded in each component to record the related power information. The first counter is the access counter which is used to record the accessed count of the component and described in Section 2.1.. The second counter is the switching counter which is used to record the switching activity of the data pass in or out of the component, and described in Section 2.2.. Figure 1 shows the environment of our power monitoring methodology. We embed the access counter and the switching counter into each monitored component. We use ARM to get the power information in the monitored core through AHB, and we send the power information to PC through the JTAG periodically. In this way, we can get the power consumption of each component used in the application.
Switching activity causes dynamic energy consumption of CMOS circuits. The switching activity is largely dependent on the Hamming distance of data between current and previous clock cycles. The switching activity happens when the data bit is from 0 to 1 or from 1 to 0. Thus, it can be expected that the actual energy cost of executing a program may be different from the component’s data inputs. The more bit switches, the more power consumed. We will keep the state of input data and control signal every cycle. We need to compare the data of current cycle with the data of previous cycle, so we can get the amount of bit switches. The algorithm which we used to compute the switching activity is straightforward and shown as Figure 2. 2.3. Power Estimation Based on these counter values, we can estimate the power consumption of each component used in the program by following formulation. P (Ci ) = Nacc × AvgPacc + Nbs × AvgPbs , (2.1)
Algorithm SwitchCount(Sc,Sp,Cb) Sc: The monitored signal at current state. Sp: The monitored signal at previous state. Cb: The total switch count before this cycle. OUTPUT: Cc, the total switch count until this cycle. BEGIN L Stemp = Sc Sp Ctemp = 0 F OR i = 1 T O BitW idth(Sc) IF (Stemp[i] == 1) Ctemp = Ctemp + 1 Cc = Cb + Ctemp return Cc END
Fig. 2. The switching activity calculation algorithm.
where P (Ci ) is the power consumption of component i. Nacc is the access count of component i. AvgPacc is the average power consumption of component i per access. Nbs is the switching count of component i. AvgPbs is the average power consumption per bit switch. AvgPacc and AvgPbs can be measured by PSPICE off line. PSPICE can precisely predict the timing, power consumption, and functionality of their designs. We can get the total power consumption of the program by following formulation. X P (Ci ) + BaseP ower, (2.2) Ptotal =
SDRAM DIMM Module
Flash Memory
RS232 Connector
Power Supply
RJ45 Connector Multi-ICE Connector ‘
ARM922T TM 32-BIT RISC microprocessor
PCI Connectors
Fig. 3. The Excabular emulation board
hardware mode to embed the microprocessor in the APEX component. The so-called software mode can let users to design their microcontroller, and then users can add their designs in the control logic circuit. The hardware mode can directly connect the microcontroller with the chip by inner wires. We adopt the software mode to add the component which we want to monitor, and it can communicate with the PC monitor tool through the RS232 1 in the emulation board. In the execution period, the data about power consumption will be transmitted to the PC monitor tool. The tool will immediately analyze these data and display some results to the user. 3.2. Performance and Accuracy
All accessed Ci
where Ptotal is the total power consumption during the program, the BasePower is the basic power consumption except the power consumed by the accessed components.
3. IMPLEMENTATION STUDY
AND
CASE
3.1. Experimental Environment We use the Altera Excalibur EPXA10 emulation board as the major platform to achieve our idea shown as Figure 3. Excalibur series are designed for the equipment with several microcontrollers, including network services, voice handler and video handler, etc. And they can use software mode or
We port our CCU32 processor core which is compatible with ARM into the emulator board and test with three benchmarks. We compare the performance between the software simulator running on the computer with P4 1.6GHz CPU and the FPGA emulator with 32.768MHZ clock rate. The clock rate of the designed CCU32 core is 500Hz. Table I is the experimental results. We can see that the FPGA emulator board is 24-51 times the performance of the software simulator. Because, FPGA emulation board has hardware circuit to simulate the core, components and the monitoring circuit. So our method has great performance than gate-level simulation and software simulator. The software simulator must use high level language to model the behavior of the core, 1
Because we cannot control the JTAG presently, we use the UART to transmit these counter values at this stage. The JTAG will be our standard interface in the future version.
TABLE I Speed comparison of two simulation methods
Simulation Method Benchmark(105 times) FIR IIR 4X4 Matrix Multiply
Software Simulator 62s 73s 94s
GUI Power Analysis Module
Control Module
FPGA Emulator 2.56s 1.856s 1.856s
Power Model for Component 1
Power Model for Component 2
...
Power Model for Component N
Command and data through RS232
Component Access Information
Fig. 4. The architecture of the power monitor
components and the monitoring circuit, so the simulation speed will be restricted by the speed of the computer. Our method has less accuracy than gate level simulation. However, our goal is not to get precise power consumption of each program, we just want to get relative power consumption of each accessed component in a program. By this way, programmers can remove hot spots that could consume the maximum power of a program. Due to the high speed of the FPGA-based simulation, it makes the application be simulated in a reasonable and realistic way. 3.3. The Power Monitor Tool Figure 4 is the architecture of our power monitor tool. The control module will transmit programs and commands to the emulation board. The power analysis module will collect the counter values and analyze the power consumption based on component power models measured off line. The power monitor tool is built with Borland C++ Builder. It provides a good graphical user interface (GUI) library to be used, and we can establish friendly interface to the user. The main goal of the power monitor tool is to receive the data that were sent through the RS232. The user can select what kind of information they need, including the accessed number, the bit switches of the component. The user can decide what information they want to observe by just setting up the tool instead of writing any complex command. The power monitor tool let the user to get the power consumption easily. When the monitor tool receives the information, the tool will convert the information to several forms shown as Figure 5.
3.4. Case Study - The CCU DSP5 Core We use the software mode to port our CCU DSP5 core which is compatible to TI C54x DSP into the emulation board. We monitor the ALU, decoder, and barrel shifter in the DSP separately. We write an echo program to filter a voice file. In the execution period of this program, a counter collector running on ARM9(the on-chip processor) will collect these counter values of the DSP and send these data through the Excalibur UART to our PC power monitor tool. We use Altera QuartusII to compile and download our design into the emulation board. QuartusII will generate a template C code, which is an example like ”hello word” including some basic IO function that can let us control the activity of ARM9. So we can send the program through the C code, and then control the ARM9 to send the program to the DSP. Until the DSP get an application and corresponding data, the DSP can execute the program and the accessed count and switched count will be sent to the PC power monitor tool. Figure 5 shows the monitoring results of the DSP. We can see that the decoder consumes 92.03% power and it occupies the most power in the program. It is the hot spot of this program and maybe we can rewrite the program in other ways to save power.
4. CONCLUSION AND FUTURE WORK In this work we present a run-time power measurement infrastructure based on using hardware
[2] Robert P. Dick, Ganesh Lakshminarayana, Anand Raghunathan, and Niraj K. Jha. Power analysis of embedded operating systems. In Proceedings of the 36th conference on Design automation conference, pages 312–315, June 2000. [3] Robert P. Dick, Ganesh Lakshminarayana, Anand Raghunathan, and Niraj K. Jha. Analysis of power dissipation in embedded systems using real-time operating systems. IEEE Transaction on computer-aided design of integrated circuits and systems, 22(5), 2003.
Fig. 5. The power analysis results
power counters to estimate component power consumptions. Because our method has per-component power consumptions, we can get unit-by-unit power estimates. Furthermore, we can treat these component power estimates as a power signature that can effectively distinguish power phase behavior based on simple analysis. It is our hope that, in the future, hardware vendors will see the competitive advantage of providing customers with detailed power information about their products. In this way, our tool can get more accurate and different types of the power consumption about each application. This work is the first step of our power-aware tool kits. Based on this environment, we will enhance the power analysis module to analyze more detailed and different level information, such as instructionlevel power consumption and function-level power consumption, etc. Finally, we will build the integrated development environment to let programmers to develop power-aware applications easily.
References [1] Naehyuck Chang, Kwanho Kim, and Hyung Gyu Lee. Cycle-accurate energy measurement and characterization with a case study of the arm7tdmi. IEEE Transactions on Very Scale Integration Systems, 10(2), April 2002.
[4] Canturk Isci and Margaret Martonosi. Runtime power monitoring in high-end processors: Methodology and empirical data. In Proceedings of the 36th International Symposium on Microarchitecture, December 2003. [5] D. Shin, H. Shim, Y. Joo, H. Yun, J. Kim, and N Chang. Energy monitoring tool for low-power embedded programs. IEEE Design and Test of Computers, 19(4), July 2002. [6] Tajana Simunic, Luca Benini, and Giovanni De Micheli. Cycle-accurate simulation of energy consumption in embedded systems. In Proceedings of the 36th ACM/IEEE conference on Design automation conference, pages 867–872, June 1999. [7] Greg Stitt, Frank Vahid, Tony Givargis, and Roman Lysecky. A first-step towards an architecture tuning methodology for low power. In Proceedings of the International conference on Compilers, architectures, and synthesis for embedded systems, pages 187–192, November 2000. [8] W. Ye, N. Vijaykrishnan, M. Kandemir, and M. J. Irwin. The design and use of simplepower: a cycle-accurate energy estimation tool. In Proceedings of the 37th conference on Design automation, pages 340–345, June 2000.