by adaptation to a visual stimulus: (1) The threshold for detecting that stimulus and similar stimuli may be raised,1 and (2) The suprathreshold appearance of re-.
Fatigue and Structural Change: Two Consequences of Visual Pattern Adaptation Jeremy M. Wolfe and Kathleen M. O'Connell In a tilt aftereffect (TAE) paradigm, 2 min of adaptation produced an aftereffect that decayed almost completely within 4 min. Four minutes of adapation produced a TAE that lasted more than 2 wk. Two modes of adaptation contribute to the TAE and account for other aftereffects: (1) short-term fatigue, produced very quickly and (2) long-term structural change, requiring more extended adaptation. Invest Ophthalmol Vis Sci 27:538-543, 1986 Two classes of visual aftereffects can be produced by adaptation to a visual stimulus: (1) The threshold for detecting that stimulus and similar stimuli may be raised,1 and (2) The suprathreshold appearance of related stimuli may be altered (eg, orientation, motion, spatial frequency, and color).2"5 Threshold elevation aftereffects are explained as temporary reductions in the sensitivity of the mechanisms detecting the stimulus. Adaptation fatigues the mechanism, and some period of time is required for recovery. Fatigue has been proposed as an explanation of aftereffects of the second kind.5"7 However, several of these, notably the McCollough effect5 and the motion aftereffect8 can last for hours, days, or even weeks. Faced with these long durations and other attributes of these aftereffects, some have proposed that these effects represent a form of classical conditioning or a related, simple form of learning. 910 Efforts to tie aftereffects closely to the classical condition paradigm have not always been experimentally successful.""13 This report presents tilt aftereffect (TAE) data supporting a model with two qualitatively different stages of adaptation. Initial presentation of an adapting stimulus produces a TAE due to fatigue. This TAE appears very rapidly and decays rapidly, following rules similar to those governing, for example, photopigment bleaching in simple light adaptation. More extensive adaptation yields a TAE that does not decay completely when the adapting stimulus is removed. The residual
TAE can be measured at least 2 wk later. This extreme persistence probably reflects structural change in the visual nervous system.
Materials and Methods The basic TAE paradigm is shown in Figure 1. If the reader fixates Figure la and then shifts gaze to lb, it will be seen that lb comes to look like lc. These stimuli and the data presented below demonstrate that the TAE develops rapidly. With just these stimuli, however, the reader will have more difficulty producing the week-long TAEs that are the main topic of this paper. A tracking-staircase procedure was used to monitor the TAE continuously. A stimulus like lb was flashed for 50 msec. Subjects stated that it appeared to point either to the right or left (la 'points right'). If the subject said "right," the next stimulus was 0.5 deg more to the left and vice versa. This staircase will converge on the point that appears to point neither right nor left, a state of subjective colinearity. The deviation of that point from true colinearity is an estimate of the TAE. As the TAE changed over time, the staircase tracked those changes. Measuring the obtuse angle, test stimuli ranged from 170 deg pointing to the left to 170 deg pointing right. Stimuli were standard, black and white 2 X 2 slides presented in a Scientific Prototype tachistoscope. They were high contrast (>90%) with a spatial frequency of 7.7 cpd and a mean luminance of 2.5 log cd/m-sq. The circular field was 1.6 deg in diameter. All stimuli were presented to the right eye of naive subjects who had or were corrected to at least 20/20 acuity in that eye. All subjects gave their informed consent after the nature of the experiment was explained to them. Initially, the staircase was run until the subject reversed direction ten times. This established a pre-adaptation baseline against which subsequent aftereffects
From the Department of Psychology, El 0-137, M.I.T., Cambridge, Massachusetts. Research was supported by grants from the N.I.H. (#EYO5O87, #RR07047), Whitaker Health Sciences Fund, and Sloan Foundation support of the Center for Cognitive Science. Submitted for publication: June 6, 1985. Reprint requests: Jeremy M. Wolfe, PhD, Department of Psychology, El0-137, M.I.T., Cambridge, MA 02139.
538
No. 4
FATIGUE AND STRUCTURAL CHANGE IN ADAPTATION / Wolfe and O'Connell
could be measured. The baseline was almost always within 1 deg of physical colinearity. (Data presented in experiment 4 show the variability of baseline settings between and within subjects.) After the baseline was established, adaptation was started by presenting the adapting stimulus for 3 sec between each trial. Two hundred msec after the adapting pattern was extinguished, test patterns were flashed for 50 msec. The adapting pattern reappeared as soon as the subject responded. Total trial length was about 4 sec. The hemifields in the adapting stimulus formed a 150 deg angle pointing to the right. Since the TAE develops at an initial rate greater than 0.5 deg per 4 sec, the staircase was started 4-6 deg from the baseline during adaptation. Starting position was based on previous studies in which the TAE was seen to rise to this level within the first 5 adapting trials. 1415 Experiment 1 There were five conditions in experiment 1. Each observer was a subject for just one condition. The TAE was tracked during exposure to 10, 20, 40, 60, or 80 adapting trials, corresponding to 30, 60, 120, 180, or 240 sec of total exposure to the adapting stimulus. Following adaptation, 80 further trials were run without the adapting stimulus in order to track the decay of the TAE. Five subjects were tested in each condition. Experiment 2 In experiment 2, adaptation was always for 240 sec (80 trials). No test trials followed the end of adaptation. Instead, subjects were asked to return at 1 hr, 2 hr, 1 day, 2 days, 1 wk, or 2 wk after adaptation. Each subject returned only once. When they returned, residual TAEs were measured by repeating the initial baseline measurement procedure and comparing the measure to the subject's initial baseline. The method is similar to that used by Jones and Holding16 to test long-term McCollough effects. They found that the McCollough effect lasted longer if the subject was not tested during the interval following adaptation and before the final test. All adapting and testing was done with the right eye. Five subjects were tested in each of the six conditions. Experiment 3 Stimuli were identical to those in experiments 1 and 2. Subjects were adapted for either 90 or 240 sec. Following adaptation, 80 test trials were run (as in experiment 1). Residual, long-term TAEs were assessed by testing each subject four more times on 4 different days over the course of the next week. The final test was 7 days after the first. Due to difficulties with forgetful
ADAPTING PATTERN
ADJUSTABLE TEST PATTERN
509
PERCEIVED AFTEREFFECT
Fig. 1. The basic tilt aftereffect paradigm. Following exposure to la, a truly colinear pattern (1b) will appear to tilt in the opposite direction (lc).
subjects and intervening weekends, all subjects were not tested on the same days (eg, days 1, 3, 5, and 7). In this experiment, the TAE was measured in each eye to assess the binocularity of any long-term, residual aftereffects. The right eye always viewed the adapting stimulus. Ten naive subjects were tested in the 90 and nine in the 240 second conditions. In each group, five subjects tracked the aftereffect in the right eye during the first session. The others tracked the effect in the left eye. The non-tracking eye was tested at the beginning, the middle, and the end of the first session. On subsequent days, the TAE was assessed in each eye. Order of testing was random across subjects. Experiment 4 To measure the stability of baseline measures over time, experiment 4 was run as a control. Five naive subjects were tested in the same manner as those in experiment 3 but without any adaptation. They simply had their baselines measured five times over the course of 1 wk. All methods and stimuli were identical to those used in the previous experiments.
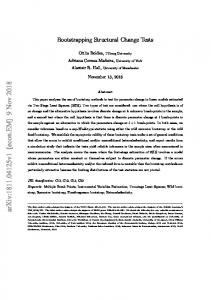
Results Experiment 1 The average results for each duration of adaptation (30, 60, 120, 180, and 240 sec) are shown in Figure 2. Each data point is the average of five subjects. Within a condition, all subjects show similar results. Error bars are omitted to avoid clutter. Standard deviations of individual points average 0.7 deg. The vast majority lie between 0.4 and 1.0 deg. The range is 0.2 to 2 deg. To facilitate comparison with other TAE data, magnitudes are given as deviations of each half of the pattern from true vertical. Thus, a TAE of 3 deg means that a pattern with an obtuse angle of 174 deg looked colinear. In all cases, the TAE develops rapidly. Within five trials (15 sec of adaptation), the TAE is at more than 50% of its final strength. The decelerating functions resemble those obtained, for example, when measuring the bleaching of photopigment 17 or that might be expected in any system where one is using
540
Vol. 27
INVESTIGATIVE OPHTHALMOLOGY 6 VISUAL SCIENCE / April 1986
30
duration of
adaptation (sec)
60
120
240
2.0
1.0
0.0
60
70
80
90
110
100
20
30
40
50
60
(total number of trials) 4
5
6
7
10
(elapsed time - minutes) • D • O •
10 trials 20 •• 40 " 60 » 80 »
Fig. 2. Tilt aftereffect tracked over time. Five adaptation times are used ranging from ten adapting trials (30 sec total exposure) to 80 (4 min). Each vertical line marks end of adaptation for one condition. Adaptation rises very rapidly, then plateaus after 1-2 min. Decay is nearly total for adaptation times less than 3 min. For 3- and 4-min conditions, the TAE does not return to baseline. Each function is the average of five subjects.
up a fixed percentage of some limited resource as a function of time. Such functions are exponential with a negative exponent. After 60 sec of adaptation, TAE magnitude reaches a plateau with little further increase seen. Looking at the decay of the aftereffect, it is clear that there is a qualitative difference between the results for 30, 60, or 120 sec of adaptation and those for 180 or 240 sec. Following 30,60, or 120 seconds of adaptation, there may be some residual aftereffect after the 5-min test period, but it is small. The final position of the staircase is just statistically different from the baseline for 60 sec (t = 3.1, P < 0.05). There is no statistical difference between the initial baseline and the final position for 30 or 120 sec (30 sec t = 0.9; 120 sec t
= 0.7). The approximately exponential decay resembles that found in regeneration of some limited resource (again, compare this to photopigment regeneration).16 Following 180 or 240 sec of adaptation, the TAE declines exponentially but does not return to baseline levels. There is a statistically significant residual TAE that never disappeared in this experiment (180 sec t = 4.3, P < 0.01; 240 sec t = 7.9, P < 0.005). Experiment 2 In experiment 2, the durability of the residual TAE was assessed by measuring perceived colinearity up to 2 wk after an initial 4-min adaptation period. The differences between pre- and post-adaptation
No. 4
541
FATIGUE AND STRUCTURAL CHANGE IN ADAPTATION / Wolfe and O'Connell
baselines are shown in Table 1. The residual TAEs are, of course, smaller than the large initial TAEs measured in experiment 1. However, they are significant for all but the 1-hr condition. The failure to find a significant effect at 1 hr is the result of statistical noise introduced by a single subject who failed to show an aftereffect in the expected direction. With the exception of that subject, all subjects in all delay conditions show a residual TAE. The TAEs have a magnitude of about 0.5 deg, meaning that a pattern with an angle of 179 deg appeared to be colinear. Although it is probably the case that the TAE will eventually disappear, there is no measurable decrease during this 2-wk period. A regression produces a slope of 0.001. (There is no guarantee that the effect will vanish. Anecdotal reports by aftereffect researchers, in particular those who study the McCollough effect, speak of effects that can last for years.) Caution must be used in interpreting the apparent lack of decay of the TAE. Since the step size in the staircase is 0.5 deg, it might be difficult to detect any change over the 2-wk period in a residual TAE that measures 0.5 deg. Experiment 3 Experiments 1 and 2 leave several questions unanswered. (1) In preserving a long-term aftereffect, is it important, as Jones and Holding16 report, not to expose the subject to test stimuli prior to the final test? (2) Would the long-term TAE be seen following less initial adaptation? Results from experiment 1 suggest that little or no long-term effect should follow less than 180 sec of adaptation. (3) Does the long-term TAE show interocular transfer? That is, if the right eye is adapted, can the long-term TAE be measured when the left eye is tested? (4) Given the small size of the residual effect and the failure to reach statistical significance at 1 hr, are the results of experiment 2 a statistical fluke or can the long-term aftereffect be replicated? Experiment 3 is a modified replication of experiment 2. Instead of a single test after adaptation, each subject was tested four times over the course of a week. Aftereffects were measured in each eye. Finally, one group adapted for a total of 240 sec (80 trials) as in experiment 2. A second group adapted for just 90 sec (30 trials). On the basis of the results of experiment 1, the shorter duration should produce little or no longterm TAE. Average results are shown in Figure 3 for each eye in both 90- and 240-sec conditions. Error bars are plus and minus one standard error. Statistical significance is shown on the figure. TAEs are plotted for those days when seven or more subjects were tested. As noted above, each subject was tested four times after the initial setting. The third session was held on days 3, 4, 5, or
Table 1. TAE as a function of time after four minutes of adaptation Test condition
avg TAE s.d. t (df = 4) P