scendants that would be pushed over the path length limit lmax when v is re- ..... Tmote Sky's transmission ranges and power were reported by Guo et al. in [20].
Fault-Tolerant Relay Deployment Based on Length-Constrained Connectivity and Rerouting Centrality in Wireless Sensor Networks Lanny Sitanayah1,2 , Kenneth N. Brown2 , and Cormac J. Sreenan1 1
Mobile & Internet Systems Laboratory (MISL) Cork Constraint Computation Centre (4C) Department of Computer Science, University College Cork, Ireland {ls3,k.brown,cjs}@cs.ucc.ie 2
Abstract. Wireless Sensor Networks (WSNs) are prone to failures. To be robust to failures, the network topology should provide alternative routes to the sinks so when failures occur the routing protocol can still offer reliable delivery. We define l-CRC, a new centrality index which measures a node’s importance to connectivity and efficient delivery in the network. We then use this centrality index to concentrate on the most important nodes, providing alternative paths around the nodes with high centrality. Varying l-CRC allows us to trade off cost for robustness. We introduce GRASP-ABP, a local search algorithm for initial robust topology design. We evaluate the algorithm empirically in terms of the number of additional nodes it suggests and its runtime. We then evaluate the robustness of the designs against node failures in simulation, and we demonstrate that the centrality-based GRASP-ABP’s designs are able to offer reliable delivery, comparable to competitor algorithms, but with fewer additional relays and faster runtime. Keywords: wireless sensor networks, network deployment planning, relay placement, centrality.
1
Introduction
Wireless Sensor Networks (WSNs) are prone to failures. For dealing with failures, reliable routing protocols have been proposed, but to be effective they depend on a physical network topology that ensures alternative routes to the sink are available. This requires sensor network deployment to be planned with an objective of ensuring some measure of robustness in the topology. To ensure that sensor nodes have backup paths, it may be necessary to add some backup nodes as relays, which do not sense, but only forward data from other nodes. Installing additional relays comes at a cost, thus motivating solutions that minimise the number of additional relays. The standard approach to robustness is to provide k-connectivity [1,2,3] – that is, to ensure that the network will remain connected after the failure of any k −1 nodes. However, achieving k-connectivity requires an excessive number of G.P. Picco and W. Heinzelmann (Eds.): EWSN 2012, LNCS 7158, pp. 115–130, 2012. c Springer-Verlag Berlin Heidelberg 2012 �
116
L. Sitanayah, K.N. Brown, and C.J. Sreenan
relays, and so some researchers proposed partial k-connectivity [4,5]. Another approach is to consider the relative importance of each node for delivering data to the sink from other nodes. If the failure of a node would disconnect many other nodes, or cause traffic from many other nodes to be delivered late, then the node is important, and we should ensure alternative paths around that node. The importance of a node in network analysis is called its centrality [6,7], and we introduce definitions of centrality which measure a node’s impact on connectivity and path length for the rest of the network. We use this centrality measure as a priority order for providing alternative paths. If we have limited resources, we address only nodes with high centrality, with the intention of being robust to the most significant failures; in cases where we have more resources, we address nodes with lower centrality, and provide robustness against more failures. Specifically, we define Length-constrained Connectivity and Rerouting Centrality (l-CRC) for WSNs with sinks. This centrality index is pair of values. The first value measures the importance with respect to network connectivity under path length constraints, while the second value measures the additional length of shortest paths that would be required after a node fails. We introduce the single-tiered constrained fault-tolerant backup node placement problem (ABP), in which we must find alternative length-constrained paths for nodes in WSNs with sinks, where there is a limited set of possible positions for relays. We use the centrality index to determine the most critical nodes, and to assess the quality of positions for the relays. We introduce a local search algorithm based on GRASP [8], which we call GRASP-ABP, which searches for the smallest number of additional relays which ensure all sensor nodes have centrality measures below the threshold. We run GRASP-ABP as a centralised offline algorithm during the initial topology design stage. We compare GRASP-ABP against the closest approaches form the literature, and we demonstrate empirically that it produces networks with fewer additional relays, and scales effectively, requiring shorter runtime than the competitors. As we raise the threshold, both the runtime and the number of nodes drop significantly. We then evaluate the resulting topologies for robustness, by simulating network operation while sensor nodes are failing. We show that after only a small number of failures, the new topologies are significantly more robust than the original topologies without relays, still providing connectivity to up to 25% more sensor nodes. Thus the use of l-CRC index with GRASP-ABP makes it possible to trade off the cost of a network against its robustness, and to compute the solution in reasonable time.
2
Background and Related Work
A WSN can be modeled as a graph G = (V, E), where V is a set of nodes and E is a set of edges. Each edge connects two nodes that are within transmission range of each other1 , and the two nodes are said to be adjacent. For v ∈ V , we define 1
For simplicity we assume bi-directional links, but this could be easily relaxed by specifying a more complex connectivity graph.
Relay Deployment Based on l-CRC in WSNs
117
neighbourhood N (v) to be the set of all nodes that are adjacent to v. A path of length t between two nodes v and w is a sequence of nodes v = v0 , v1 , . . . , vt = w, such that vi and vi+1 are adjacent for each i. Two nodes are connected if there is a path between them. A graph is connected if every pair of nodes is connected. The WSN topology is an undirected graph and for simplicity, we assume that the graph is connected. For u, w ∈ V , d(u, w) denotes the shortest path distance between u and w. By convention, d(u, w) = ∞ if w is unreachable from u and d(u, u) = 0. We denote dv (u, w) to represent the distance of the shortest path from u to w which does not visit v. In a WSN with a data sink, the routing paths from all sensor nodes to the sink form a rooted tree, where the sink is the root of the tree. Any node w on a path from a node v to the root is an ancestor of v. If w is an ancestor of v, then v is a descendant of w. In a tree, v is the parent of w and w is the child of v if an edge (v, w) exists with d(v, Sink) < d(w, Sink). For WSNs with multiple sinks, a well-known approach is by adding a supersink as an imaginary node that has connection to the original sinks [5]. By doing this, we reduce the problem of multiple sinks to the problem of single sink. Centrality indices is a core concept in social network analysis, used to determine the importance of a node in a network. Originally, it is measured by counting the number of the shortest paths passing through a certain node. In its development, there are several centrality indices that are mostly used, such as degree centrality, closeness centrality, betweenness centrality [6] and its variations [7]. Degree centrality of a node v is measured by the number of nodes adjacent to v. Closeness centrality of a node v is an inverse sum of distances from v to all other nodes in the graph. Betweenness centrality gives the probability that node v falls on a randomly selected shortest path between a source and a destination. In vehicular networks, the concept of centrality is used for access-points deployment [9] and discovering link criticality [10]. In WSN, it is used for routing [11] and load balancing [12]. The use of centrality to analyse network robustness has been proposed in the literature. Shavitt and Singer [13] present two new centrality measures based on the existence of backup path if a node fails, namely Quality of Backup (QoB) and Alternative Path Centrality (APC). The idea behind these is the failures of nodes with perfect backups do not affect connectivity nor increase the path length in the network. QoB is a measure of path rerouting from a node’s direct parents to its direct children. QoB of a node v is � � 1 ρ(v) =
u∈πv
w∈Cv max{dv (u,w)−1,1}
|πv |·|Cv |
(1)
where πv is a set of v’s direct parents and Cv is a set of v’s direct children. ρ(v) = 1 if v has perfect backups and ρ(v) = 0 if v has no backup. APC is the difference between nodes’ topological centrality before and after a node fails. The topological centrality of a node u ∈ V , denoted χ(u), depends on the number of nodes connected to u and their distances from u, � 1 (2) χ(u) = d(u, w) w∈V\{u}
118
L. Sitanayah, K.N. Brown, and C.J. Sreenan
Therefore, 0 ≤ χ(u) ≤ |V |−1; ∀u ∈ V . The APC value of a node v is � � ϕ(v) = χ(u)− χv (u) u∈V\{v}
(3)
u∈V\{v}
where χv denotes the centrality values calculated using alternative paths which bypass v. Although QoB and APC indices include connectivity information of a network, both of them cannot be used to identify which node failures cause the network to be disconnected. Moreover, they do not consider length-bound, which is an important aspect for data latency requirements. The problem of deploying relay nodes for increased reliability has long been acknowledged as a significant problem [1,14,2,15]. Partial k-connectivity repair algorithm (K-CONN-REPAIR) [14] is a complete relay placement algorithm for ensuring k-connectivity for each pair of sensor nodes. The original version of K-CONN-REPAIR [1] can deploy relays anywhere. The modification of KCONN-REPAIR, as suggested in [16] for constrained deployment, can only place relays at a subset of candidate locations. GRASP-ARP [16] is a GRASP-based local search method to deploy relay nodes for ensuring (k,l)-sink-connectivity, where all sensor nodes have k node-disjoint paths of length ≤ l to the sinks. GRASP [8] is a metaheuristic intended to capture the good features of pure greedy algorithms and of random construction procedures. It is an iterative process, which consists of two phases: a construction phase and a local search phase. The construction phase builds a feasible solution as a good starting solution for the local search phase. The probabilistic component of a GRASP is characterised by randomly choosing one of the best possible initial solution. Since the solution produced by the construction phase is not necessarily the local optimum, the local search phase works iteratively to replace the current solution by a better one from its neighbourhood.
3
Length-Constrained Connectivity and Rerouting Centrality (l-CRC)
Given the importance of connectivity and latency requirements in designing a reliable WSN topology, we define a new variation of alternative path centrality for WSNs with sinks, i.e. Length-constrained Connectivity and Rerouting Centrality (l-CRC). The centrality variant measures the importance of a node v based on the impact of removing v, which affects the connectivity of the network and the path length of other nodes whose shortest paths to the sinks originally pass v. l-CRC is a 2-tuple index, which consists of a pair of centrality values: Lengthconstrained Connectivity Centrality (l-CC) and Length-constrained Rerouting Centrality (l-RC). The former is concerned with network connectivity, while the latter is with the additional length of the shortest paths. Formally, we define l-CRC of a node v as l-CRC(v) = < l-CC(v), l-RC(v) >
(4)
Relay Deployment Based on l-CRC in WSNs
3.1
119
Length-Constrained Connectivity Centrality (l-CC)
Length-constrained connectivity centrality of a node v is the number of v’s descendants that would be pushed over the path length limit lmax when v is removed from the network. We define l -CC(v), length-constrained connectivity centrality of a node v as l-CC(v) = |{w ∈ D(v);
d(w, Sink) ≤ lmax , dv (w, Sink) > lmax }|
(5)
where D(v) is the set of v’s descendants in the routing tree. To compare the relative l-CC of nodes from different graphs, it is desirable to have a measure that is independent of network size. A node v can at most disconnect n−1 other nodes in a graph, excluding itself. Therefore, the relative l-CC of any node v in a graph may be expressed as a ratio l-CC � (v) =
|{w ∈ D(v);
d(w, Sink) ≤ lmax , dv (w, Sink) > lmax }| n−1
(6)
The relative centrality score has been normalised to take value in the interval [0, 1] because it is divided by the maximum possible score in networks of equal size (number of nodes). A value close to one would mean that the node is important to network’s connectivity and path lengths of other nodes. Likewise, a value close to zero would mean that it is not important. 3.2
Length-Constrained Rerouting Centrality (l-RC)
Length-constrained rerouting centrality of a node v is the total percentage of extra lengths, which are over the path length limit lmax , from v’s descendants to the sinks upon removal of v. Note that we only take v’s descendants that are still connected to the routing tree after v is removed, because the sum of distances is only meaningful for a connected graph. We define l-RC(v), length-constrained rerouting centrality of a node v as � � � max{dv (w, Sink), lmax } −1 ; dv (w, Sink) �= ∞ (7) l-RC(v) = max{d(w, Sink), lmax } w∈D(v)
Given a node v, the shortest length of a path a node w has to the sink passing through v is two and the longest length of a path bypassing v is �n − 1. By � −1 . assumption that 2 ≤ lmax ≤ n−1, the maximum of l-RC(v) is |D(v)|× ln−1 max Then, the relative l-RC of a node v is defined as � � � max{dv (w, Sink), lmax } lmax � −1 ; l-RC (v) = |D(v)|×(n−1−lmax) max{d(w, Sink), lmax } (8) w∈D(v)
dv (w, Sink) �= ∞ Values of l-RC � (v) may be compared between graphs.
120
3.3
L. Sitanayah, K.N. Brown, and C.J. Sreenan
Ranking
One of the characteristics of centrality measures is their ability to rank nodes in a network according to some topological features. We rank nodes based on l-CRC to identify the top-rank critical nodes that need backups. Because l-CRC is a 2-tuple index, we have two choices to rank the centrality scores, i.e. based on l-CC scores or l-RC scores. We called the first choice the primary order and the second choice the secondary order. Based on the design objectives, one may choose l-CC as the primary order and l-RC as the secondary order, or vice versa. Although the primary order is more important than the secondary order, at a certain point below a specific value of the primary order, the secondary order may become more important. Therefore, we define two threshold values for the primary and secondary orders, namely the primary threshold and the secondary threshold. The ranking process works as follows: 1. The rank is based on the primary order from the highest primary order’s value down to the primary threshold. If two or more primary order’s values are the same, the rank is chosen based on the secondary order’s value. 2. After the primary threshold, the rank is based on the secondary order from the highest one left down to the secondary threshold. If two or more secondary order’s values are the same, the rank is chosen based on the primary order’s value. 3. After the secondary threshold, the rank is chosen arbitrarily, where the highest one left from either the primary or the secondary order comes first. The Connectivity Centrality Threshold (CT) is the tolerable percentage of a network that will be effectively disconnected after the failure of one node. By analogy, the Rerouting Centrality Threshold (RT) specifies a tolerance on the extra length of the shortest paths. If both thresholds are 0%, we are trying to achieve 2-connectivity for nodes which are two or more hops away from the sinks. 3.4
An Example
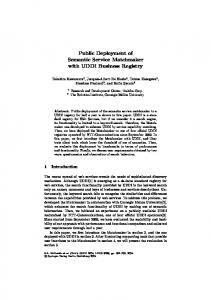
Figure 1(a) is an example of a small network which consists of 12 sensor nodes and one sink with lmax = 5. Note that in this topology, d(l, Sink) > lmax . The solid lines are the original routing paths to the sink while the dashed lines show the communication links. In this example, node b has the most descendants and node d has the most neighbours. If we use the definition of betweenness centrality with a sink and degree centrality, the most central nodes are nodes b and d, respectively. However, l-CRC � for both nodes are < 0, 0 >. In terms of the availability of alternative paths, b and d are not important because their descendants have length-bounded alternative paths, which are not longer than lmax . Nodes e, h and g have l-CRC � equal to < 0.1818, 0.25 >, < 0.0909, 0.1667 > and < 0.0909, 0.0556 >, respectively, since at least one of their descendants’ alternative paths are longer than lmax . Node k, on the other hand, has l-CRC � equal to < 0, 0 >, because even if node l is disconnected upon its removal, node l’s original path is already longer than lmax . The alternative paths when node
Relay Deployment Based on l-CRC in WSNs
121
Fig. 1. l-CRC example. (a) is the original paths to the sink, (b) is the alternative paths if node e dies and (c) shows l-CRC � scores for the network in (a) with lmax = 5
e fails are depicted in Fig. 1(b). Figure 1(c) shows l-CRC � scores for all nodes in Fig. 1(a). l-CRC � scores are ranked using l-CC � as the primary order. The thresholds for connectivity centrality and rerouting centrality are both zero.
4
Greedy Randomised Adaptive Search Procedure for Additional Backup Node Placement (GRASP-ABP)
We consider WSNs where the nodes are partitioned into sinks, sensor nodes and backup nodes (relays), and so in the graph representation V = S ∪ T ∪ B. We define the additional backup placement problem: given a graph G = (S∪T ∪A, E), where A is a set of candidate positions for backup nodes, find a minimal subset B ⊆ A so that when a sensor node v ∈ T in a graph H = (S∪T ∪B, E↓S∪T∪B ) dies, each of its descendants has an alternative path to a sink s ∈ S of length ≤ lmax . For our algorithm, we introduce some secondary definitions. X ⊆ T is the set of critical nodes. Critical nodes are identified as nodes whose l-CRC scores above either the primary or the secondary threshold. Y ⊆ T is the set of non-critical nodes. Therefore, T = X ∪Y . We use the GRASP technique [8] to deploy additional backup nodes for ensuring the existence of alternative paths in a routing tree. 4.1
Construction Phase
The first step in any GRASP algorithm is to construct an initial solution. The initial solution in GRASP-ABP is B, an initial set of backup nodes. Each backup node in B is identified by finding the shortest path from each descendant of each critical node to a sink in G bypassing each critical node. For each backup node found in the shortest path, we put it in B. The randomisation of the initial solution is obtained by randomly selecting the shortest paths’ parents if there are hop count ties. Then, a graph H = (S ∪T ∪B, E↓S∪T∪B ) is generated.
122
4.2
L. Sitanayah, K.N. Brown, and C.J. Sreenan
Node-Based Local Search
The next stage in a GRASP algorithm is to explore the neighbourhood of the initial solution, looking for lower cost solutions. Let B be the set of backup nodes (relays) in the current graph H. We explore the neighbourhood of the current solution by adding a new relay r ∈ {A\ B} into B that can eliminate as many existing relays from B as possible. GRASP-ABP (G, S, A, X, Y, D(X), CT, RT, max iterations) 1 best value ← ∞; 2 for i ← 1 to max iterations do /* Construction phase */ 3 B ← ∅; 4 for all v ∈ X do 5 for all w ∈ D(v) do 6 Find the shortest path from w to s ∈ S bypasses v; 7 B ← B ∪{r} for each r ∈ A found in the shortest path; 8 end for; 9 end for; 10 H = (S ∪X ∪Y ∪B, E↓S∪X∪Y∪B ); 11 Calculate l-CCmax (H) and l-RCmax (H); /* Local search phase */ 12 do 13 solution updated ← false; 14 best set ← B; best number ← |B|; 15 for all r ∈ {A\B} do 16 L ← ∅; 17 for all t ∈ B do 18 L ← L∪{t}; 19 Calculate l-CCmax (H +r−L ) and l-RCmax (H +r−L ); 20 if (l-CCmax (H +r−L ) > l-CCmax (H) or l-RCmax (H +r−L ) > l-RCmax (H)) and (l-CCmax (H +r−L ) > CT or l-RCmax (H +r−L ) > RT ) then 21 L ← L\{t}; 22 end if ; 23 end for; 24 if |B|−|L|+1 < best number then 25 best set ← (B ∪{r})\L; best number ← |B|−|L|+1; 26 end if ; 27 end for; 28 if best number < |B| then 29 B ← best set; H = (S ∪X ∪Y ∪B, E↓S∪X∪Y∪B ); 30 solution updated ← true; 31 end if ; 32 while solution updated ; /* Best solution update */ 33 if |B| < best value then 34 35 36 37
B ∗ ← B; best value ← |B|; end if ; end for; return B ∗ ;
Algorithm 1. GRASP-ABP
Relay Deployment Based on l-CRC in WSNs
4.3
123
Algorithm Description
The pseudocode for GRASP-ABP is given in Algorithm 1. It takes as input the original graph G = (S∪T∪A, E), the set S of sinks, the set A of candidate backups, the set X of critical nodes, the set Y of non-critical nodes, the descendants of the critical nodes D(X), the connectivity centrality threshold CT , the rerouting centrality threshold RT , and the number of iterations (max iterations). The procedure is repeated max iterations times. In each iteration, a greedy randomised solution to find an initial set of backup nodes B is executed from line 3 to 9. The current graph H = (S∪T∪B, E↓S∪T∪B ) is generated in line 10. The l-CRC scores for the critical nodes are then recalculated in line 11 using H to obtain the highest values of l-CC and l-RC, denoted l-CCmax (H) and l-RCmax (H), respectively. The local search starts with the initialisation of the best set and the best number of backups in line 14. The loop from line 15 to 27 searches for the best move, i.e. finding a new relay r ∈ {A \ B} that can eliminate as many existing relays from B as possible. The loop from line 17 to 23 tries to find the maximum set L ⊆ B of existing relays that are safe to be removed after the insertion of r. To check if the relays in L are safe to be removed, firstly we calculate the new highest values of l-CC and l-RC using H +r−L in line 19, namely l-CCmax (H +r−L ) and l-RCmax (H +r−L ). Then, in line 20, we check if the new scores improve the previous ones or stay below the thresholds. If the new solution improves the number of backups used in the current best solution, the best set and the best number of backup nodes are updated in line 25. When all moves have been evaluated, we check in line 28 if an improving solution has been found. If the moves produce a better solution, the set of backup nodes B is updated in line 29, which we also need to regenerate the graph H. Then, the local search continues. If at the end of the local search we found a better solution compared to the best solution found so far, we update in line 34 the set of backup nodes and the least number of backups used. The best set B* of backup nodes is returned in line 37.
5
Simulation and Results
Our experiments are divided into two stages: evaluation of network planning and evaluation of network operations. In the evaluation of network planning, we evaluate the performance of algorithms that are used in planning a network, in terms of the number of additional relay nodes and the runtime. In the evaluation of network operations, we compare the performance of the designed topologies under network operations, in terms of delivery ratio, end-to-end packet latency and completeness of the packets received at the sinks. 5.1
Evaluation of Network Planning
We want to show the effectiveness and the efficiency of GRASP-ABP, which uses l-CRC, compared to some existing closely related algorithms. We use the following metrics to measure the performance of the algorithms:
124
L. Sitanayah, K.N. Brown, and C.J. Sreenan
– Number of additional relay nodes (cost) measures the total number of backup nodes that are required to be deployed in the network. – Runtime is the total time needed for an algorithm to finish its execution. Our simulation results are based on the mean value of 20 randomly generated network deployments, enough to achieve a 95% confidence in the standard error interval. The network consists of up to 100 nodes deployed within randomly perturbed grids, where a node is placed in a unit grid of 8m × 8m and the coordinates are perturbed. In order to get sparse networks (average degree 2–3), we generate more grid points than the number of nodes. For example, we use 6 × 6, 8 × 8 and 11 × 11 grids to randomly deploy 25, 49 and 100 nodes, respectively. Candidate relays are also distributed in a grid area, where a candidate occupies a unit grid of 6m × 6m. Both sensor and relay nodes use the same transmission range, i.e. 10 metres. All algorithms are written in C++ and tests are carried out in 2.40 GHz Intel Core2 Duo CPU with 4 GB of RAM. We compare GRASP-ABP against GRASP-ARP [16] and K-CONN-REPAIR [14]. We take the modified version of K-CONN-REPAIR from [16] for constrained deployment locations, where relay nodes can only be placed in specific candidate locations. In the simulation, we compare the performance of GRASP-ABP against GRASP-ARP and K-CONNREPAIR in terms of the number of additional relay nodes and the runtime. In the simulation, we use 25-node, 49-node and 100-node topologies with 49, 100 and 196 candidate relays, respectively. The maximum path length (lmax ) is set to 10 for 25-node, 15 for 49-node and 20 for 100-node networks. The maximum number of iteration of GRASP is 10. We use connectivity as our primary order in centrality score ranking and rerouting as secondary. The thresholds for both connectivity (CT) and rerouting (RT) are 0% and 2%. If CT and RT are 0%, we are trying to achieve 2-connectivity for nodes which are two or more hops away from the sink. Therefore, we only simulate 2-connectivity for GRASP-ARP and K-CONN-REPAIR. If CT and RT are greater than 0%, we trade off the number of relay nodes (cost) and runtime against the quality of designed networks. Multiple Sources – Single Sink Problem. In this simulation, we choose the sink at the top-left corner of the network, while all sensor nodes are the source nodes. Our simulation uses 25-node and 49-node topologies. We simulate two versions of GRASP-ARP [16], i.e. the basic version and the dynamic programming implementation (DP). Figure 2 shows the number of additional relay nodes needed. GRASP-ABP finds the least number of additional relay nodes compared to K-CONN-REPAIR and GRASP-ARP. The algorithms’ runtime for the multiple sources – single sink problem is shown in Table 1, where GRASP-ABP’s runtime is only half of K-CONN-REPAIR’s and less than a third of GRASPARP’s with dynamic programming for 49-node networks. Multiple Sources – Multiple Sinks Problem. We have four sinks deployed at the top-left, top-right, bottom-left and bottom-right of the network. In the
Relay Deployment Based on l-CRC in WSNs
125
multiple sinks problem, there are two cases where the paths terminate at: different sinks and any sinks. The different sinks problem is where original and backup paths must terminate at different sinks. The any sinks problem is the case where the paths may terminate at any sinks. Since GRASP-ABP was designed for any sinks, we simulate GRASP-ARP for any sinks as well. Figure 3 and Table 1 show our simulation results, where GRASP-ABP outperforms GRASP-ARP and KCONN-REPAIR in both the number of additional relay nodes needed and the runtime. GRASP-ABP requires almost 20% fewer relays and runs more than six times faster than GRASP-ARP with dynamic programming for the case of 100-node networks. GRASP-ABP deploys less relays than GRASP-ARP as it does not need to provide alternative paths for sensor nodes which are connected directly to the sinks and have no descendants. By using 2% threshold, GRASP-ABP can even provide cheaper and faster answers to the same problem. K-CONN-REPAIR has the worst performance as it must run an expensive connectivity checking algorithm in each iteration to provide k-connectivity for an entire network. Note that we do not provide 100-node networks’ results for K-CONN-REPAIR as it is too costly to be implemented in a larger network as it needs to check the connectivity between every pair of nodes.
Fig. 2. Number of additional relay nodes Fig. 3. Number of additional relay nodes needed for multiple sources – single sink needed for multiple sources – multiple sinks
Table 1. Algorithms’ runtime Runtime (sec) Single sink Multiple sinks 25-node 49-node 25-node 49-node 100-node K-CONN-REPAIR 6.2891 254.7343 6.2891 254.7343 10,003.8000 GRASP-ARP-DP 24.3469 421.2820 1.7844 37.7884 515.8429 GRASP-ARP 39.4860 619.3118 2.5180 55.3843 735.7915 GRASP-ABP (CT=0%, RT=0%) 5.9163 132.0446 1.0540 7.7484 85.4845 GRASP-ABP (CT=2%, RT=2%) 5.9095 134.5218 1.0509 6.6265 37.2608 Algorithms
126
5.2
L. Sitanayah, K.N. Brown, and C.J. Sreenan
Evaluation of Network Operations
Since the topology design algorithms produce different solutions, we need to simulate a network protocol in the presence of node failures to show the robustness of the designs. GRASP-ABP with threshold greater than 0%, for example, generates topologies with fewer relay nodes and does not guarantee 2-connectivity. By simulating network operation, we want to show the trade off between the efficiency of the network design and the robustness of the network operation. We take the topology designs generated in the previous stage and deploy sensor nodes, relay nodes and sinks according to the deployment plans. Then, we evaluate the network operations for each topology. In this simulation, we want to show that the topologies generated by GRASP-ABP has comparable performance to the topologies which have more relay nodes. We use the following metrics for the evaluation of network operations: – Packet delivery ratio is the total number of packets received at the sinks divided by the total number of packets generated by the source nodes. – Average per packet latency measures the total time needed for packets to reach the sinks since they are sent by the source nodes, averaged over the total number of packet received at the sinks. – Completeness of packets received is the percentage of the number of source nodes whose packets are received at the sinks over the number of operating source nodes. The topologies are evaluated in the network simulator ns-2 [17]. Ns-2 is a standard network simulator widely used for WSN simulations. We compare the topologies generated by GRASP-ABP and GRASP-ARP with the dynamic programming implementation for any sinks. We choose GRASP-ARP to be compared to GRASP-ABP because the numbers of additional relay nodes suggested by these two algorithms are comparable. We use Shortest path Tree Routing (STR) as the routing protocol. STR is the routing protocol from Collection Tree Protocol [18] with neighbour discovery ability after a node’s parent in the routing tree dies. STR forwards packets using the shortest route toward the sinks. The routing decisions are made locally, where a node selects a parent from its one-hop neighbours that has the smallest hop count to the sinks. Our parameters used in Ns-2 simulation are based on Tmote sky hardware [19] as shown in Table 2. Tmote Sky’s transmission ranges and power were reported by Guo et al. in [20]. We used the Lagrange Interpolating Polynomial [21] based on the known six points to find transmission power for the transmission range used in our simulation, i.e. 10 metres. In each experiment, we simulate a data gathering for 220 seconds, where all sensor nodes generate packets with fixed intervals. They also forward other nodes’ packets toward the sinks. Relay nodes do not generate packets, but only forward them. We assume that the relay nodes are more robust than the sensor nodes, so they will not die during the simulation period. During the simulation, we increase the number of dead nodes every 20 seconds, start from the 20th second. Instead of selecting dead nodes randomly, the probability of node death
Relay Deployment Based on l-CRC in WSNs
127
Table 2. Simulation Parameters in Ns-2 Simulation parameters Hardware Channel bandwidth Transmit power Receive/idle listening power Radio propagation model CSThresh RXThresh Pt Interpacket arrival MAC protocol
Default value Tmote sky 250 Kbps 36.23 mW 59.1 mW Two-ray ground 3.65262e-10 3.65262e-10 5.35395e-05 10 seconds 802.11
in our simulation is proportional to the work done. The results presented are based on the average of 20 topologies that are simulated three times each.
Fig. 4. Delivery ratio for multiple sources Fig. 5. Latency for multiple sources – sin– single sink in 49-node networks gle sink in 49-node networks
Multiple Sources – Single Sink Problem. In this simulation, we use 49-node networks (average degree 2.8) where the sink is located at the top-left of the network and all sensor nodes are the source nodes. We increase the number of dead nodes gradually by killing one sensor node in each time step (every 20 seconds). Figure 4 shows the delivery ratio improvement for networks with relay nodes over the original networks. Since the number of additional relays for GRASP-ABP topologies with 0% and 2% thresholds are the same, the graph shows comparable delivery ratio for the two types of GRASP-ABP topologies. As depicted in Fig. 5, the average per packet latency for GRASP-ABP and GRASP-ARP topologies follow similar trends. The latency drop in original topologies corresponds to the low delivery ratio, because only nodes closer to the sink can deliver their packets when the networks become disconnected. GRASP-ABP topologies also achieve 20% improvement in connectivity over the original topologies after five nodes die and almost 10% over GRASP-ARP as shown in Fig. 6.
128
L. Sitanayah, K.N. Brown, and C.J. Sreenan
Fig. 6. Completeness for multiple sources – Fig. 7. Delivery ratio for multiple sources – single sink in 49-node networks multiple sinks in 100-node networks
Fig. 8. Latency for multiple sources – mul- Fig. 9. Completeness for multiple sources – tiple sinks in 100-node networks multiple sinks in 100-node networks
Multiple Sources – Multiple Sinks Problem. We use 100-node networks (average degree 3.1) and fix the location of the four sinks at the top-left, topright, bottom-left and bottom-right of the network. We increase the number of dead nodes by killing five sensor nodes every 20 seconds. Figure 7 presents the delivery ratio for 100-node networks with four sinks. While the networks with relays outperform the original networks, GRASP-ARP topologies achieve higher delivery ratio than GRASP-ABP with 0% threshold because GRASPARP deploys more relay nodes than GRASP-ABP. As we assume that relay nodes will not die during the simulation, GRASP-ARP topologies take advantage of the existence of more relay nodes to connect the networks. The latency depicted in Fig. 8 corresponds to the delivery ratio, where the original topologies have the lowest latency as the sinks can only collect packets from nearby nodes when then networks become disconnected. On the other hand, in GRASP-ARP topologies, sinks are more likely to receive packets from distant nodes because
Relay Deployment Based on l-CRC in WSNs
129
GRASP-ARP deploys more relays, and thus influence the average per packet latency. The completeness in Fig. 9 shows similar trends with the delivery ratio. Even if GRASP-ABP topologies are outperformed by GRASP-ARP topologies that have more relays, we still get more than 10% connectivity improvement compared to the original topologies.
6
Conclusion and Future Work
To be robust to failures, network topologies should provide alternative routes to the sinks so when failures occur the routing protocol can still offer reliable delivery. Our contribution is a solution that can achieve such reliability in a more efficient manner than other published approaches. We ensure that each sensor node in the initial design has an alternative path to the sinks by deploying a small number of additional backup nodes (relays). To solve this problem, we define l-CRC, a new centrality measure that determine a node’s importance to connectivity and efficient delivery in the network. We use l-CRC scores to identify the most important nodes and to provide alternative paths around those nodes. We also introduce GRASP-ABP, a local search algorithm to be run during the initial topology design to minimise the number of relays that need to be deployed. We evaluate the algorithm in terms of the number of additional relays it deploys and its runtime. We also evaluate the robustness of the designs against node failures in simulation, where we demonstrate that the centrality-based GRASP-ABP’s topologies can provide robust delivery with fewer additional relays than the most closely related published algorithms. In addition, raising the centrality threshold trades off the cost of a network against its robustness, and thus decreases the runtime. We are currently investigating the use of power-adaptive protocols in our designed topologies. Our future work will include additional sensor deployment, as well as finding locations to deploy sinks in a hop-constrained network that can optimise the network resiliency. We will also consider the networks capacity requirement in the algorithm design. Acknowledgements. This research is fully funded by the NEMBES project, supported by the Irish Higher Education Authority PRTLI-IV research program.
References 1. Bredin, J.L., Demaine, E.D., Hajiaghayi, M., Rus, D.: Deploying Sensor Networks with Guaranteed Capacity and Fault Tolerance. In: Proc. 6th ACM Int’l Symp. Mobile Ad Hoc Networking and Computing (MobiHoc), pp. 309–319 (2005) 2. Han, X., Cao, X., Lloyd, E.L., Shen, C.C.: Fault-tolerant Relay Node Placement in Heterogeneous Wireless Sensor Networks. IEEE Trans. Mobile Computing 9(5), 643–656 (2010) 3. Bhandari, R.: Optimal Physical Diversity Algorithms and Survivable Networks. In: Proc. 2nd IEEE Symp. Computers and Communications (ISCC), pp. 433–441 (1997)
130
L. Sitanayah, K.N. Brown, and C.J. Sreenan
4. Karenos, K., Pendarakis, D., Kalogeraki, V., Yang, H., Liu, Z.: Overlay Routing under Geographically Correlated Failures in Distributed Event-Based Systems. In: Meersman, R., Dillon, T., Herrero, P. (eds.) OTM 2010. LNCS, vol. 6427, pp. 764–784. Springer, Heidelberg (2010) 5. Bhandari, R.: Survivable Networks: Algorithm for Diverse Routing. Kluwer Academic Publishers (1999) 6. Freeman, L.C.: Centrality in Social Networks Conceptual Clarification. Social Networks 1(3), 215–239 (1979) 7. Brandes, U.: On Variants of Shortest-Path Betweenness Centrality and Their Generic Computation. Social Networks 30(2), 136–145 (2008) 8. Feo, T.A., Resende, M.G.C.: Greedy Randomized Adaptive Search Procedures. Journal of Global Optimization 6, 109–133 (1995) 9. Kchiche, A., Kamoun, F.: Centrality-based Access-Points Deployment for Vehicular Networks. In: Proc. 17th Int’l Conf. Telecommunications (ICT), pp. 700–706 (2010) 10. Segovia, J., Calle, E., Vila, P.: An Improved Method for Discovering Link Criticality in Transport Networks. In: 6th Int’l Conf. Broadband Communications, Networks, and Systems (BROADNETS), pp. 1–8 (2009) 11. Oliveira, E.M.R., Ramos, H.S., Loureiro, A.A.F.: Centrality-based Routing for Wireless Sensor Networks. In: Proc. 3rd IFIP Wireless Days, pp. 1–2 (2010) 12. Pathak, P.H., Dutta, R.: Impact of Power Control on Relay Load Balancing in Wireless Sensor Networks. In: Proc. IEEE Wireless Communications and Networking Conference (WCNC), pp. 1–6 (2010) 13. Shavitt, Y., Singer, Y.: Beyond Centrality - Classifying Topological Significance using Backup Efficiency and Alternative Paths. New Journal of Physics 9(266) (2007) 14. Pu, J., Xiong, Z., Lu, X.: Fault-Tolerant Deployment with k-connectivity and Partial k-connectivity in Sensor Networks. Wireless Communications and Mobile Computing 9(7), 909–919 (2008) 15. Misra, S., Hong, S.D., Xue, G., Tang, J.: Constrained Relay Node Placement in Wireless Sensor Networks to Meet Connectivity and Survivability Requirements. In: Proc. 27th Ann. IEEE Conf. Computer Communications (INFOCOM), pp. 281–285 (2008) 16. Sitanayah, L., Brown, K.N., Sreenan, C.J.: Fault-Tolerant Relay Deployment for k Node-Disjoint Paths in Wireless Sensor Networks. In: Proc. 4th Int’l Conf. IFIP Wireless Days, WD (2011) 17. The Network Simulator - ns-2, http://www.isi.edu/nsnam/ns/ (September 30,2009) 18. Gnawali, O., Fonseca, R., Jamieson, K., Moss, D., Levis, P.: Collection Tree Protocol. In: Proc. 7th ACM Conf. Embedded Networked Sensor Systems, SenSys (2009) 19. Tmote Sky Datasheet, http://www.eecs.harvard.edu/ konrad/projects/shimmer/references/tmotesky-datasheet.pdf (September 30, 2009) 20. Guo, Y., Kong, F., Zhu, D., Tosun, A.S., Deng, Q.: Sensor Placement for Lifetime Maximization in Monitoring Oil Pipelines. In: Proc. 1st ACM/IEEE Int’l Conf. Cyber-Physical Systems (ICCPS), pp. 61–68 (2010) 21. Archer, B., Weisstein, E.W.: Lagrange Interpolating Polynomial. MathWorld–A Wolfram Web Resource (September 1, 2011), http://mathworld.wolfram.com/LagrangeInterpolatingPolynomial.html