_)
Fault Zone Architecture and Fluid Flow: Insights From Field Data and Numerical Modeling Jonathan Saul Caine and Craig B. Forster Department of Geology and Geophysics, University of Utah, Salt Lake City, Utah
Fault zones in the upper crust are typically composed of complex fracture networks and discrete zones of comminuted and geochemically altered fa ult rocks. Determining the patterns and rates of fluid flow in these distinct structural discontinuities is a three-dimensional problem. A series of numerical simulations of fluid flow in a set of three-dimensional discrete fracture network models aids in identifying the primary controlling parameters of fault-related fluid flow, and their interactions, throughout episodic deformation . Four idealized, but geologically realistic, fault zone architectural models are based on fracture data collected along exposures of the Stillwater Fault Zone in Dixie Valley, Nevada and geometric data from a series of normal fault zones in east Greenland. T he models are also constrained by an Andersonian model for mechanically compatible fracture networks associated with normal faulting. Fluid flow in individual fault zone components, such as a fault core and damage zone, and full outcrop scale model domains are simulated using a finite element routine. Permeability contrasts between components and permeability anisotropy within components are identified as the major controlling factors in fault-related fluid flow. Additionally, the structural and hydraulic variations in these components are also major controls of flow at the scale of the full model domains. The four models can also be viewed as a set of snapshots in the mechanical evolution of a single fault zone. Changes in the hydraulic parameters within the models mimic the evolution of the permeability structure of each model through a single deformation cycle. The model results demonstrate that small changes in the architecture and hydraulic parameters of individual fa ult zone components can have very large impacts, up to five orders of magnitude, on the permeability structure of tbe full model domains. Closure of fracture apertures in each fault zone magnifies the magnitude and orientation of permeability anisotropy in ways that are closely linked to the implicitly modeled deformation. Changes in fault zone architecture can cause major changes in permeability structure that, in tum, significantly impact the
Faults and Subsurface Fluid Flow in the Shallow Crust Geophysical Monograph 113 Copyright 1999 by the American Geophysical Union
101
102
FAULT ZONE ARCHITECTURE AND FLUID FLOW
magnitude and patterns of fluid flux and solute transport both within and near the fault zone. Inferences derived from the model results are discussed in the context of the mechanical strength of an evolving fault zone, fault zone sealing mechanisms which control the conduit-barrier systematics of a fault zone as a flow system, and how these processes are related to fluid flow in natural fault zones. INTRODUCTION Improving our understanding of how brittle fault zones form and, once formed, how they influence fluid flow in the upper crust is facilitated by field-based modeling of fault zone architectural style, fracture mechanics, and fluid flow processes through time. This process-based approach to field work and modeling will help to develop predictive solutions to problems involving seismic hazards, hydrocarbon migration and trapping, and the utilization of groundwater, mineral, and geothermal energy resources. Although a number of modeling studies have addressed the possible impacts that fault zones have on fluid flow [e.g., Mase and Smith, 1985; Forster and Evans, 1991; Ge end Garven, 1994; Haneberg, 1995; Lopez and Smith, 1995 and 1996; Roberts et al., 1996; Zhang and Sanderson, 1996; Flemming eta/., 1998; Matthtii et al., 1998; Ferrill et al., 1999], the permeability structures assigned in the simulated fault zones are either highly simplified or are modeled in two-dimensions. In most cases a homogeneous and isotropic permeability structure is assumed for the entire fault zone. Lopez and Smith [ 1996] included complex fault zone permeability structures in their three-dimensional fluid flow simulations, but, the theoretical permeability structures they created are not based on an analysis of field data. Modeling results presented in this paper help to illustrate a step towards creating more realistic fault zone architectural styles and associated permeability structures needed as input to numerical models of fluid flow in fault zones. A primary goal of this paper is to outline how threedimensional, geologically plausible fault zone permeability structures, developed using data colJected from outcrop, influence fluid flow in and near fault zones. We have not attempted to model the impact that fault zones have on regional flow systems. The work presented is based on the fault zone architectural models and permeability structures summarized by Caine et al. [1996] and shown in Figure I. Fault zones are commonly composed of a complex set of components, a fault core and a damage zone, which are distinct mechanical and permeability heterogeneities in the upper crust [Sibson, 1977; Chester and Logan, 1986; Davison and Kozak, 1988; Forster and Evans, 1991; Byerlee, 1993; Scholz and Anders, 1994; Caine et al., 1996]. The combined effect of different permeabilities associated with variations in the distribution of fault zone components leads to fault zones that may act as conduits, barriers, or combined conduit-barrier systems [Randolph end Johnson, 1989; Smith et al., 1990; Scholz, 1990;
Antonellini and Aydin, 1994; Bruhn, et al., 1994; Newman and Mitra, 1994; Goddard and Evans, 1995; Caine et al., 1996; Sibson, 1996; Evans et al., 1997; Forster et a/., 1997; Jones et al., 1998; Rowley, 1998]. In this paper we focus on permeability structures that correspond to complex fracture networks associated with brittle faulting in low permeability rocks. Fault-related permeability structures are derived by constructing outcropscale, three-dimensional stochastic models of discrete fracture networks for each architectural style shown in Figure 1. Each architectural style modeled in this study (Fig. 1) is tied to reality using field data and inferences derived from the Stillwater Normal Fault in Dixie Valley, Nevada [Caine and Forster, 1997) and from a series of normal fault zones in east Greenland [Caine, 1996]. Numerical fluid flow simulations provide estimates of the permeability structure of each individual fault zone component and each full model domain where components are combined within a protolith. Because the rock matrix is assumed to be impermeable, fluid flow is simulated only in the discrete fracture networks. Neglecting matrix permeability provides an opportunity to evaluate how macroscopic
Distributed Deformation
Zone M
1#
Hill Fracture Fault Meshes
Composite Deformation
~ Zone
~ Stillwater Fault Zone
Fault Zone Architectural Styles Shawangunk Mountains
Single #
Fracture Fault
San Gabriel Cataclasites
#
Localized
Deformation Zone
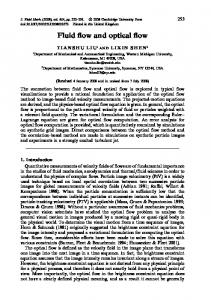
Figure 1. Conceptual model for idealized fault zone architectural styles with field examples [after Caine et al., 1996].
CAINE AND FORSTER fracture networks contribute to fault zone permeability structure. The flow experiments yield values of bulk permeability, computed in three orthogonal directions relative to the orientation of each modeled fault zone. Additionally, an evolving fault zone is simulated by stepwise closure of fracture apertures restricted to each fault core. The modeling results are then discussed with reference to the mechanics, permeability structure, and evolution of natural fault zones. FAULT ZONE ARCHITECTURAL STYLES AND IDEALIZED PERMEABILITY STRUCTURES The core and damage zone components of a fault zone are surrounded by a protolith, or country rock, where faultrelated permeability structures are generally absent [Chester and Logan, 1986; Caine er al., 1996; Evans er at., 1997). The geometry and intensity of fracturing associated with each component yield heterogeneity and anisotropy in bulk component permeabilities. Consequently, the bulk permeability anisotropy of a fault zone reflects the combined effect of anisotropy developed within each component and anisotropy caused by permeability contrasts between components. Field-based observations and permeability data obtained from fault rocks [Morrow et al., 1981; Forster and Evans, 1991; Antonellini and Aydin, 1994; Bruhn et al., 1994; Caine et al., 1996; Evans et al., 1997; Seront et al., 1998] suggest that the distinctive internal structure, external geometry, and composition of each component play an important role in controlling the patterns and rates of fluid flow in and around fault zones. A fault core is the component of a fault zone where comminution, fluid flow, geochemical reaction, and other fault-related processes alter the original lithology. For example, progressive grain-size reduction, dissolution, reaction, and mineral precipitation during fault zone evolution typically cause the core to have reduced permeability, relative to that of the adjacent damage zone and protolith [e.g., Chester and Logan, 1986; Antonellini and Aydin, 1994; Bruhn et al., 1994; Goddard and Evans, 1995; Caine et al., 1996; Evans et al, 1997; Seront et al., 1998; Fisher and Knipe, 1998]. Protolithology has a strong influence on the structure and composition of fault cores and their resulting permeability structure [Caine et al., 1996; Knipe et al., 1998). The detailed relationships, however, between the formation of fault cores and the varying processes that alter permeability structure are incompletely understood for different protolithologies. In mature fault zones hosted in granitic rocks the presence of feldspars may result in fault core lithologies that become rich in clay minerals, primarily due to reactions between fluids and comminuted minerals [Goddard and Evans, 1995; Evans et al, 1997; Seront et al., 1998). This may significantly lower fault core permeability relative to what might be expected for less feldspar-rich protolithologies. In small
103
displacement fault zones hosted in quartz-rich sandstones low permeability fault cores often develop by grain size reduction and the formation of deformation bands [Anronellini and Aydin, 1994). In protoliths that are heterogeneous, interbedded sandstones and shales or granitic rocks juxtaposed with sandstones, the combined effects of mechanical and geochemical processes can lead to the formation of fault cores with heterogeneously distributed high and low permeabilities [Chester and Logan, 1986; Caine, 1996; Foxford et al., 1998). At present, little work has been done to understand the formation of fault cores and their resulting permeability structures in carbonates, mafic igneous and metamorphic rocks, and pelitic metamorphic rocks that have undergone brillle deformation. Damage zones are the network of subsidiary structures including small faults, veins, fractures, cleavage, pressure solution seams, and folds that surround the • fault core. Damage zone structures result from the growth and linkage of fracture networks that accompany episodic deformation distributed in a fau lt zone [Chester and Logan, 1986; Evans, 1990; Bruhn et al., 1994; McGrarh and Davison, 1995; Caine et al, 1996; Cowie and Shipton, 1998; Knipe et al., 1998). Composed of both open and filled fractures, damage zones yield a heterogeneous and anisotropic permeability structure [Bruhn et al., 1994]. Damage zone permeability structures are dominated by macroscopic fractures and are typically enhanced relative to both the fault core and the undeformed protolith [Chester and Logan, 1986; Smith et al., 1990; Andersson et at., 1991; Scholz and Anders, 1994; Goddard and Evans, 1995; Caine et al., 1996; Evans er al. 1997; Seront et al., 1998). Figure I relates fault zone architectures with deformational style. The Distributed Deformation Zone (DDZ; not to be confused with Mitra's [1978) ductile deformation zones) and Localized Deformation Zone (LDZ) represent two idealized, architectural end members. The Single Fracture Fault (SFF) is a speciaJ case of the LDZ where deformation is accommodated along a single fault. The Composite Deformation Zone (CDZ) represents a hybrid between the Distributed and Localized Deformation Zones. Each idealized fault zone architecture represents only one moment in time and space [Caine et al., 1996). Because fault zone architectures evolve through time it should be noted that a range of styles varying between those shown in Figure I might be found along any section of a single fault zone. Additionally, individual fault zone strands with varying architectural styles are often combined as several sets of strands in a complex fault zone. Caine et al. [1996) associates each of the four architectural styles shown in Figure 1 with permeability structures in inactive fault zones as discussed by a variety of workers [Chester and Logan, 1986; Bruhn et al., 1990 and 1994; Forster and Evans, 1991; Moore and Vrolijk, 1992; Newman and Mitra, 1994]. Idealized permeability structures in non-deforming fault zones include localized conduits (SFF model), distributed conduits (DDZ model), localized barriers (LDZ model), and
104
FAULT ZONE ARCHITECTURE AND FLUID FLOW
combined conduit-barriers (CDZ model). Caine et a/. [ 1996] discuss these conceptual models in greater detail and outline a set of fault zone architectural indices that link fault zone architecture with permeability structure. The modeling presented here is based on the assumption that the magnitude and geometry of permeability anisotropy within each fault zone component, combined with permeability contrasts between the components, control the evolution of the hydraulic properties of a fault zone. For example, macroscopic fracture intensity in the fault core at the prefailure and postfailure stages of deformation is usually much less than that of the damage zone [Andersson et al., 1991 ; Chester et al., 1993; Caine et al., 1996]. 1lms, before and after failure the reduced permeability of the fault core is dominated by the intergranular porosity and microscopic fractures of the fault rocks, whereas the permeability of the damage zone is enhanced by the hydraulic properties of macroscopic fracture networks. The resulting permeability structure leads to a focusing of fluid flow within the damage zone during the prefailure and postfailure stages of deformation. During brittle deformation at failure, however, microscopic to macroscopic fractures that open and close within the fault core may allow this component to play a more significant, but transient, role in transmitting fluid through and across the fault zone. When not actively deforming, fault cores commonly act as localized barriers that restrict fluid flow across the fault zone because of their reduced permeability [Antonellini and Aydin, 1994; Caine, 1996; Evans et al., J997]. Thus, during periods of inactivity Localized Deformation Zones may act as localized barriers (Fig. 1). Distributed Deformation Zones contain networks of both open and closed macroscopic fractures throughout their evolution. These distributed fracture networks allow DDZs to act as distributed conduits that enhance fluid flow along the fault zone at any time during the cycle of deformation [e.g., Sibson, 1996; Caine et al., 1996]. When a damage zone surrounds a well developed, low permeability fault core a Composite Deformation Zone may have a combined conduit-hamer permeability structure. The specific characteristics of each permeability structure will depend on in situ stress state, fau lt rock heterogeneity, fracture interconnectivity, and the extent of fracture filling by mineral precipitation. THREE-DIMENSIONAL DISCRETE FRACTURE MODELS We explore the way that fault zone architectures influence fluid flow by modeling idealized fault zones where A fractures provide the principal pathways for flow. primary goal is to illustrate how the geometry, variability, and intensity of fracturing associated with faulting processes might lead to permeability heterogeneity and anisotropy within individual fault zone components and the surrounding rocks. To do this we simulate fluid flow through a set of field-based, three-dimensional, discrete fracture network
models that represent the four idealized architectural models shown in Figure I. The models are not representations of fault zones from actual field sites. Rather, we have used the lield data to generate realistic and generalized fracture model parameters in order to model each of the idealized architectural styles. Specifically, we used fracture density and trace length data from the Stillwater Fault Zone. Representative fault zone component widths are generalized from field data collected along the fault zones in east Greenland where each of the four architectural styles are observed. Fracture types and orientation data are generalized primarily from the Stillwater Fault Zone but are similar to what is observed in east Greenland. Other fracture parameters, such as aperture and transmissivity, are not taken from field data because they are poorly constrained. The choice of these parameters and how they are derived are discussed in detail below. The fracture data used in constructing the models are summarized in Table 1. The discrete fracture models are constructed in three steps. First, fracture orientation and morphology data from field work are organized and plotted on equal area stereonets to segregate genetically-related fracture sets. Second, statistical fracture network parameters are delineated for each type of field data used to constrain the models. Finally, the stochastic three-dimensional fracture network models are created using the fracture network parameter data and the code FracMan™ [Dershowitz et al., 1996]. Several key features of natural fault zones are represented in the fracture models and subsequent fluid tlow modeling experiments. These features include distinct sets of faultrelated macroscopic fractures whose densities and orientations are mechanically realistic and based on field data. We also simulated component specific fracture networks that obliterate and replace earlier structures. We investigate the mechanical evolution of a single fault zone where each idealized model can be viewed as a single step in that evolution. Finally, we explore the evolution of permeability structure in each of the idealized models through a single deformation event. FIELD DATA AND SEGREGATION OF FRACTURE TYPES Fracture data collected along exposures of the footwall of the Stillwater Fault Zone provide the primary field-based dataset used in parameterizing the models. The Stillwater Fault Zone is an active, crustal-scale, seismogenic normal fault that lies along the eastern margin of the Stillwater Mountains [Parry and Bruhn, 1990; Power and Tullis, 1989; Bruhn et a/., 1994; Caskey et al., 1996; Caine and Forster, 1997; Seront et at., 1998; Caine, 1999]. The architectural style of the Stillwater Fault Zone observed at several localities is that of a Composite Deformation Zone. Detailed fracture mapping was done along scanlines located on sets of outcrop faces oriented roughly parallel and perpendicular to the nominal plane of the fault zone [Caine
CAINE AND FORSTER
105
Table I. Fault zone architectural styles and fracture model parameters. Architectura l Fault zone Type of Mean Mean trace length Density Total number of model and com pon e nt fracture or ien ta tion of (m ), distribution, (m 1 /m') and fractures and com pone n t widths" setb each set and standard termination total density (D) (%)d (trend/p lunge)" deviationd
Single Fracture Fault Protolith 10m on each side Extension of fault core Cross A Cross B lmm
Fault
Shear
Distributed Deformation Zone Protolith 1m on each side Extension of fault zone Cross A Cross B Fault Zone
5m
Shear A Shear B Step Shear
Localized Deformation Zone Protolith 19m on each side Extension of fault core Cross A Cross B Fault Zone
Composite Protolith
lm
Shear A Shear B
Deformation Zo11e 6m on each side Extension Cross A ofDZ Cross B
Damage Zone
3m on each side Shear A of fault core Shear B Step
090 I 30 344/26 196 I 26
2, Log Normal, 0.5 2, Log Normal, 0.5 2, Log Normal, 0.5
0.2. 0 0.2, I 0.2, I
090 I 00
20, Constant
0.05, 0
090 I 30 3441 26 196126
2, Log Normal, 0.5 2, Log Normal, 0.5 2, Log Normal, 0.5
0.2, 0 0.2, I 0.2. I
270 I 090 I 270 I 090 I
00 30 80 00
6, 4, 4, 20,
Constant Constant Constant Constant
4.0. 0 2.0, I 1.0, I 0.25, 0
090 /30 344/ 26 196/ 26
2, Log Normal, 0.5 2, Log Normal, 0.5 2, Log Normal, 0.5
0.2, 0 0.2. I 0.2, I
270 I 30 090 I 60
0.6, Constant 0.4, Constant
4.0, 0 2.0, 0
090 I 30 344/ 26 196 I 26
2, Log Normal, 0.5 2, Log Normal, 0.5 2, Log Normal, 0.5
0.2, 0 0.2, I 0.2, I
270 I 00 090 I 30 270 I 80
6, Constant 4, Constant 4, Constant
4.0, 0 2.0, I 1.0. I
408 Fractures
708 Fractures
5 fractures with slip 4990 Fractures
5436 Fractures
Shear A 270 I 30 0.6. Constant 4.0, 0 090 I 60 0.4, Constant 2.0. 0 Shear B Note: Foe each model: Fracture model domain size= 20m by 20m by 20m; Flow simulation region= 18m by 18m by 18m; No matrix permeability; DZ = Damage Zone. • Component widths are representative of fault zones from east Greenland where each architectural style is represented. b From field observations along the Stillwater and east Greenland fault zones of fracture network sets that are mechanically compatible with an Andersonian mechanical model generalized into the model domains. • Fracture set orientations are from the types of fractures associated with a generalized Andersonian normal fault zone. d From field observations and data collection along the Stillwater Fault Zone. Core
lm
and Forster, 1997]. Note that the actual geometry of the fault zone is curviplanar to lenticular. Two orthogonal scanlines were used to minimize orientation bias. Data collected along each scanline include fracture position, orientation, type, trace length, apparent aperture, geometry (planar, curviplanar, irregular, etc.), roughness, mineral fillings, slickenline orientations on slip surfaces, truncation and termination style, and age relationships. The fracture orientation data are plotted on equal area nets as poles to fracture planes (Fig. 2). The data are then contoured and individual clusters of data are segregated into distinct fracture sets (Fig. 2). The mean vector, or average orientation, for each f~cture set is computed, and the corresponding Fisher
dispersions, a measure of the spread of each set, are calculated [e.g., Marshak and Mitra, 1988]. The fracture sets are assigned to a genetic mode of formation based on an assumed mechanical compatibility with an Andersonian model of a normal fault [Anderson, 1951; Davis, 1984; Sibson, 1994], as well as field observations of each fracture type. Figure 2b shows a fault-related fracture network composed of shear, extension, and step fractures that are primarily found in the damage zone data, but not in the protolith data shown in Figure 2a. The protolith primarily contains cross fractures while shear fractures are notably absent (Fig. 2a). Additionally, the presence of quartz-kaolinite mineralization found in the fau lt
106
FAULTZONEARCHITECTUREANDFLUlDFLOW
A
8
N
core and damage zone fracture networks suggest syntectonic, fault-related fluid flow [Power and Tullis, 1989; Caine and Forster, 1997; Seront et al., 1998; Caine, 1999]. The cross fractures labeled set 4 in Figure 2 are of uncertain origin. The cross fractures are both unfilled and filled with faultrelated mineral assemblages and may be related to an early stage of ENE I WSW regional extension [Parry et al. , 1991 ]. The fault core is dominated by highly silicified and comminuted fau lt rocks where poorly developed macroscopic fracturing occurs in generally random orientations. The idealized geometric and spatial relationships between an Andersonian master fault zone and the subsidiary fracture types accounted for in the fracture models are illustrated in The fracture networks observed along the Figure 3. Stillwater Fault Zone may have formed in non-Andersonian stress fields, particularly localized stress field s near the fault zone. The Andersonian model, however, allows us to link the formation of distinct fracture sets in our generalized models to a mechanical model for fault-related fracturing. Extension fractures are curviplanar to planar, generally rough, opening mode fractures that are typically mineral filled in the damage zone and unfilled in the protolith. Shear fractures are often curviplanar, smooth walled, mineral fi lled, and typically show polished and striated slip surfaces. These are interpreted to be Mode 2 or hybrid Mode 2 and Mode 3 fractures. Step fractures are of uncertain origin but they are generally curviplanar, filled and unfilled, and form at a high angle to the average orientation of the master fault zone and are typically subhorizontal. T he step fractures may form because of bending stresses related to shear during faulting. Alternatively, the step fractures may be similar to the linking fractures and small faults found in compound fault zones of the Sierra Nevada of central California [Martel, 1990]. Cross fractures are typically steeply dipping, cut across the fault zone at a high angle, are often smooth walled, and are typically filled when in the damage zone while unfilled when found in the protolith. Because they are generally cut by fault-related fractures, the cross fTactures are assumed to have formed prior to faulting but were hydraulically active during faulting. DETERMINATION OF FRACfURE NETWORK PARAMETERS
Figure 2. Equal area, Kamb contoured poles to all fracture data from the Mirrors Locality, Stillwater Fault Zone, Dixie Valley, Nevada (C.I. = 2.0 sigma). A: Data from protolith only. 8: Data from damage zone only. Fractures broken into sets from raw data are assigned to a mode of formation based on mechanical compatibility with an Andersonian model of a normal fault. Relative to the master fault zone the following sets are defined: I = Extension; 2 = Shear; 3 = Step; 4a, 4b, and 4c = Cross fractures. Great circles indicate average orientation of master fault zone (066/55). In general, shear and step fractures are found within the damage zone while extension and cross fractures are found in both the protolith and damage zone.
The field-based stochastic fracture models are created using FracManTM. Our first step in model construction is to determine fracture density for each fracture set. The total number of fractures, from the fracture position field data, for each pair of scanlines are input into a trial model. Simulated trace planes, with the same orientations as the outcrop faces, are cut from the model volume. The modeled patterns of fracture traces are visually compared to photographs of each outcrop face and qualitatively evaluated to determine how closely the model represents the photograph. The fracture models are iteratively regenerated and compared to the field data until there is a satisfactory match between the
CAINE AND FORSTER model, the photographs, and the statistics of the field data. When a satisfactory result is obtained the fracture density is calculated by FracManTM and used in subsequent model construction. An Enhanced Baecher model [Dershowitz et al., 1996) is found to yield fracture models that best match the field observations. The Enhanced Baecher model locates fracture centers in a model domain using a Poisson distribution and allows for fracture terminations at intersections with preexisting fractures [Dershowitz et al., 1996]. The Enhanced Baecher model produces fracture sets with relatively uniform spatial distributions and minimal clustering, as observed in the field. All fractures in this study are modeled as hexagonal plates with lengths matched to the observed variability in fracture traces. Fracture lengths are modeled in the protolith and damage zones using a log normal distribution. A constant fracture length is used in the fault cores. Fracture density and orientation are most closely honored in the models because these data are most reliably measured in the field. Because it is uncommon to see both tips of a single fracture exposed along a scanline, fracture length is moderately well honored in the models. Length estimates are obtained, however, by measuring individual traces associated with a specific fracture type wherever they are found with both tips exposed. The mean length computed for each fracture type is used in generating the fracture models (Table 1). Fracture aperture and roughness are elusive parameters that we do not attempt to constrain with field data. Because it is nearly impossible to measure a meaningful value for fracture aperture in the field, uniform fracture apertures of I00 IJ.m are initially assigned throughout the fracture models. The range of aperture values used in our models are reasonable for fractures found in the shallow subsurface and are based on measurements [Snow, 1968] and rock mechanical experiments [Krantz et al., 1979; Witherspoon et al., 1980]. We use this approach to illustrate how better constrained parameters, such as fracture geometry and density, might influence fault zone permeability structure. We also examine the eftect of reducing fracture apertures within the fault zone as a way of modeling the consequences of fault zone sealing. This illustrates how changes in component-specific permeabilities might influence the bulk permeability structure of a fault zone and its evolution though a deformation cycle.
107
mean fracture density and spacing model for each set; the mean, standard deviation, and probability distribution function for lengths in each set; termination percent for each set; and the aperture, transmissivity, and storativity for each set. For each fault zone component, within each model, we use the statistics generated from the iterative process discussed above to construct the models. For example, each fracture set in each model protolith is constructed using the same mean and standard deviation for a log normal length distribution, a mean density, and a mean orientation randomly chosen within the dispersion range. Thus, each final model is an outcrop scale representation (cubes that are 20 m on a side) of the field-based data; constructed by a component-wise piecing together of each part of the model domain (Fig. 4). Each model is populated with a mechanically compatible network of fractures appropriate for each
Master Fault Zone Step - - - Fractures
Extension Fractures
THREE-DIMENSIONAL FRACTURE NETWORK MODEL CONSTRUCTION We created idealized, three-dimensional fracture network models for each fault zone model shown in Figure 4 using the statistics of the field data and the FracManTM code [Dershowitz et al., 1996]. Building each model requires a series of input parameters that include the size of the model region; mean orientation and dispersion for each fracture set;
Figure 3. Schematic, field-based cross section of an idealized network of mechanically compatible Andersonian fracture traces. Fracture orientations with respect to the master normal fault zone and extensional stress field are shown.
108
FAULT ZONE ARCHITECTURE AND FLUID FLOW
Single Fracture Fault
Distributed Deformation Zone
pp 10 Flow { ntrace
=66
ntotal = 408
-13
.2
••
-15 -16
- 6- .
•
I
LDZ
FAULT ZONE
PL
I I
CDZ
FAULT ZONE
PL
I I
FAULT ZONE DZ I CORE
I
I
I
I
I
I
I
I
I
I
I
I
I
I
I
I
I
I
®~
I
I
I
I
I
I
I
I
I
I
I
I
I
I
I
I
I
I
••
I
I
I
16
I
I
I
I
-14
I
I
I
N'
PL
I
I
· 10
FAULT ZONE
I
I
.s
DDZ
SFF
PL
... - - - I
•
-6 - ·
I
•
- 1 - - - - - - 6- . I
•
6
.
... - - - -
•
•• •• I
I
16
16
I
I
I
I
.£::. - . ... - - - - ... - - - -
I
I
I
I
I
I
I
I
I
I
I
I
I
I
I
I
I
16
I
16
I
I
I
I
I
I
I
I
@~
113
6®~
®~
-17
6100IU11 and 6 10J.Lm: e100J.lm and
® 10J.Lm:
• 100J.lm and ~ 10J.1m: PL
=Protolith,
DZ
Flow Normal to Fault Zone and Slip Vector (NN) Flow Parallel to Fault Zone and Normal to Slip Vector (PN) Flow Parallel to Fault Zone and Slip Vector (PP)
=Damage Zone
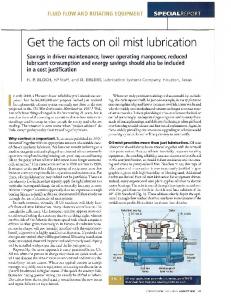
Figu re 6. Bulk log permeabilities of each protolith and each fault zone calculated from model results for each of the three flow directions (NN =triangles, PN = circles, and PP =sq uares). SFF is the single fracture fault model, DDZ is the distributed deformation zone model, LDZ is the localized deformation zone model, and CDZ is the composite deformation zone model (note that the fault zone in the CDZ model includes a damage zone and a fault core). The filled set of points show the permeability structure where fracture apertures are uniformly 100 ).lm in each fault zone component. The hatched points show the permeab ility structure where the protolith and damage zone fracture apertures arc uniformly I 00 ).lm and fault zone fracture apertures arc 10 Jlm. The horizontal dashed line is shown for reference to an average protolith value for each model.
and similar to that of the protolith. It is, however, noteworthy that the penneability ratio is the largest in the DDZ model (Fig. 6 and Table 2). This is because the fault zone is composed of a network of very long (-5 m), high density (7 m2/m 3), shear fractures as compared with the very short (-0.5 m), high density (6 m2/m 3), shear fracture network in the LDZ and CDZ models (Tables I and 2). This suggests that fracture length and orientation is more important than fracture density in controlling bulk anisotropy at the fault zone component scale. Bulk penneability anisotropy of a fault zone is influenced by the anisotropy of individual fault zone components combined with the integrated effect of penneability contrasts between components. Penneability contrasts between components is estimated by comparing the geometric mean permeabilities (Table 2) computed for each component. The unifonn, I00 Jlm cases yield penneability contrasts between the fault zones and protoliths that range between one and two orders of magnitude for the DDZ, LDZ, and CDZ models. These relatively large contrasts can cause significant changes in the patterns and rates of fluid flow in porous or fractured media that would not otherwise occur in
homogeneous, isotropic penneability structures [Freeze end The enhanced penneabiUty of the fault zones in these models occurs because they contain higher density fracture networks that include both long shear fractures and small step fractures (Table I ). The SFF model is a special case where kNN is undefined because the penneability across the open space in the single fracture is infinite. However, if the single fracture is filled with fine-grained comminuted or precipitated minerals. it will have an internal permeability with magnitude and anisotropy dictated by the pore structure and/or microscopic to macroscopic fractures . The permeability contrast between the protolith and the fault in the SFF model is up to five orders of magnitude because the penneability of a single relatively open fracture is very high compared with that of even a dense network of fractures (Fig. 6). The possible impact of fault zone sealing by progressive comminution and mineral precipitation is modeled in each architectural style by varying fracture aperture within each fault zone from I to 1000 Jlm (Table 2). A subset of these results is shown in Figure 6. A large reduction in equivalent permeability occurs when fracture aperture is changed
Cherry, 1979].
114
FAULTZONEARCHITECTUREANDFLUIDFLOW
Table 2. Fault zone architecrural modeling results for bulk component permeabilities. C om po n e nt Architectura l a pertu re compo n e nt (J.Lm )
Geometric mean permeability o f NN, PN, PP directi ons ( m')
P er m ea b i lit y in NN di r ection ( m')
Per mea bility i n NN, P N, pp di rections nor malized to I he NN direction pp NN PN
kmu : k mln di recti o n s
Single Fracture Fault 100
Protolith
7.4E- 15
1.3E- I 4
0.2
0.8
NN:PN
1000 100 I0 I
Fault Fault Fault Fault
9.8E-08 9.8E-IO 9.8E-12 I.OE- 13
9.8E-08 9.8E- 10 9.8E-1 2 I.OE-13
1.0 1.0 1.0 1.0
1.0 1.0 1.0 1.0
ISOTROPIC ISOTROPIC ISOTROPIC ISOTROPIC
Distributed Deformation
5..?'l~
t?
1M"?.
Zo n e
100
Protolith
1.9E-14
1.1 E-14
3.3
1.5
PP : PN
1000 100 10 I
Fault Zone Fault Zone Fault Zone Fault Zone
4.1E-10 4 . 1E-13 4.1 E-16 4.1E-19
1.3E-1 0 1.3E- 13 1.3E-16 1.3E-19
6.3 6.3 6.3 6.3
5.4 5.4 5.4 5.4
PN : NN PN:NN PN :NN PN:NN
Localized Deformation Zone 100
Protolith
9.2E-15
1.4E-14
0.4
0.8
NN:PN
1000 100 10 l
Fault Zone Fault Zone Fault Zone Fault Zone
l.IE-10 I.IE-13 1.1 E-16 1.1 E-19
7.4E- I I 7.4E-14 7.4E-17 7.4E-20
2.6 2.6 2.6 2.6
1.3 1.3 1.3 1.3
PN :NN PN:NN PN :NN PN :NN
Composite
Deformation
Zone
100
Protolith
2.0E-14
1.6E- 14
4.7
0.4
PN :PP
1000 100 10 I
Damage Zone Damage Zone Damage Zone Damage Zone
4.7E-10 4.7E-13 4.7E-16 4.7E- 19
2.1E-IO 2.1E-13 2.1E-16 2.1E-19
3.7 3.7 3.7 3.7
2.9 2.9 2.9 2.9
PN:NN PN :NN PN:NN PN :NN
PN :NN Core 4.3E-10 2.1E-IO 3.7 2.4 1000 2.1E-1 3 3.7 PN :NN Core 4.3E-13 2.4 100 2.4 2.1E-16 Core 4.3E-16 3.7 PN:NN 10 PN:NN 4.3E-19 2.1E-19 3.7 2.4 Core I Note: For each fault zone component model run: No matrix permeability; lnjtjaJ conditions @ time=O, head=O. and tlux=O; Hydraulic gradient = I; Steady state flow; k.... and k,;. refer to the directions of maximum and minimum permeability. ~
because total volumetric flux through a fracture is related to the cube of fracture aperture: (4)
where W is the width [L] of the fracture measured normal to the direction of flow within the fracture plane. Thus, a 10fold change in fracture aperture yields a I ,000-fold change in the value of Q that, in turn, yields a 1,000-fold change in bulk permeability (Equation 3). Figure 6 and Table 2 illustrate how closure of the fault zone fractures from 100 to I 0 ~m in the DDZ and LDZ models reduces the bulk permeability of the fau lt zones by three orders of magnitude. This produces a fault zone with significantly lower permeability than the surrounding
protoli th. As a consequence, hydraulic gradients oriented subparallel to the fault zone (e.g., PP and PN directions) would cause most fluid to flow through the adjacent protolith while flow across the fault zone would be restricted by its reduced permeability. Note that the anisotropy of the fault zones remain unchanged because all fracture apertures are uniformly reduced. Reducing fracture apertures in the core of the CDZ model reduces the bulk permeability of the core while leaving the damage zone as a primary pathway for fluid flow. The resulting permeability structure produces a combined conduit-barrier flow system similar to those described by Forster and Evans [1991], Caine et al. [1996], and Evans et al. [ 1997]. In this type of system, fluid flow across the fault zone is restricted and redirected in directions parallel to the nominal orientation of the plane of the fault zone [Caine et al., 1996].
CAINE AND FORSTER
115
Table 3. Fault zone architectural modeling results: variation in bulk permeability ofprotolith multiple realizations. Flow direction NN
PN pp
Permeability range of 20 realizations (m1 } 4.7E-15 to 1.2E-14 2.2E-15 to 8.8E-15 S.IE-15 to 1.3E- 14
Arithmetic mean permeability of 20 realizations (m 1 ) 7.6E-15 S.OE-15 9.7E-15
Stand ard deviation of permeability (m 1 ) 2.2E-l5 l.6E-15 1. 8E-1 5
Note: For each protolith realization: Fracture model domain size = 20 m by 20 m by 20 m; Flow simulation region = 18 m by 18 m by 18 m; No matrix permeability; Initial conditions @ time=O, head=O, and tlux=O; Hydraulic gradient = I; Steady s tate flow; Apertures are uniformly 100jlm with trans·missivities of 10·• m 2/s. All parameters are the same for each of the 20 realizations modeled.
Permeability Structure of the Full Fault Zone Models The previous section outlined how fluid flow simulations help to understand the permeability magnitude and anisotropy of different fault zone components. The following section describes the results of a similar approach used to assess how combining different component types influences the bulk permeability magnitude and anisotropy of each full model domain (Table 4 and Fig. 4). In this section, bulk model permeabilities are computed at each of four stages in an idealized fault zone evolution. This provides insight into the time-dependent evolution of fault zone permeability structure and is an important first step in defining geologically plausible and heterogeneous perme-ability structures. Equivalent bulk permeability values obtained for each full model domain (Fig. 4) are shown in Figure 7 as sets of three log (k) values, in m 2 , for each flow direction. These results are also summarized in Table 4. Again, calculated geometric mean permeabilities and permeability ratios (kNN : kpN : kpp) provide insight into the averaged bulk permeability and anisotropy of each model (Table 4). The impact of fracture opening and closure during fault zone evolution is approximated by uniformly varying fracture apertures in each fault zone from 1 to 1000 J.!m (Table 4 and Fig. 7). The uniform fracture aperture cases of 100 jlm are assumed to represent an intermediate stage in the evolution of a fault zone that undergoes an idealized mechanical deformation cycle from prefailure, to failure, to postfailure. Stepwise fracture closure from 100 J.!m to 10 jlm and then to 1 jlm represents a series of postfailure to prefailure stages with progressively more extensive fracture sealing. Uniformly increasing fracture apertures to 1000 jlm in the fault zones represents the increase in permeability that likely occurs during failure. Flow simulation results obtained for the uniform aperture case suggest that the SFF and LDZ full models are effectively isotropic with bulk permeability values similar to that of the proto lith (-10-14 m 2). This result is obtained because fluid flow both parallel (PP, PN directions) and normal (NN direction) to the fault zone is effectively controlled by the protolith. With an aperture of 100 jlm, the fault in the SFF model transmits insufficient fluid to
influence the bulk t1ow through the model domain. The higher density network of shear fractures in the fault zone of the LDZ model provides only a small (factor of two) increase in bulk permeability parallel to the fault zone (SFF fault zone fracture density = 0.05 m 2/m 3 versus LDZ fault zone fTacture density= 6 m 2/m 3 , Table 1). In contrast, incorporating high density, long shear and step fractures in the fault zones of the DDZ (7 m2/m 3 ) and CDZ (13 m 2/m 3) models yields a large (one order of magnitude) increase in bulk permeability parallel to the .... fault zone at the full model scale (PP and PN directions). This suggests that fracture length and orientation has a greater impact on anisotropy than does fracture density at the full model scale, as it did at the component scale. As a consequence, the fault zone can act as a conduit for fluid flow in directions parallel to the fault zone at this intermediate stage in fault evolution. During failure a net increase in fracture aperture is expected within the fault zone, even though some fractures open while others close (e.g., dilation versus shearing). This effect is simulated by uniformly increasing fracture apertures in each fault zone from 100 to 1000 jlm. In the DDZ, LDZ, and CDZ models the bulk permeability normal to the fault zone is slightly enhanced by a factor of two to three (Fig. 7 and Table 4). Increasing the aperture in the SFF model, however, has little impact on bulk permeability normal to the fault because the protolith fracture network controls flow normal to the fault. In all cases the. lO-fold increase in fracture aperture yields a large increase in permeability parallel to the fault zone (two to three orders of magnitude: Fig. 7 and Table 4). Permeability anisotropy ratios of two to three orders of magnitude demonstrate that fluid flow will be focused into the fault zone whenever the hydraulic gradient is not exactly perpendicular to the fault. Thus, at failure great potential exists, from a fault zone architecture and permeability structure standpoint, for significant fault-related fluid t1ow as demonstrated from many field studies [e.g., Sibson, 1994; Newman and Mitra, 1994; Goddard and Evans, 1995; Caine, 1996]. In summary, mineral comminution, stress relaxation, and mineral precipitation localized in the fault core progressively seal fault zones during the postfailure stage of
116
FAULT ZONE ARCHITECTURE AND FLUID FLOW
Table 4. Faul t zone architectural modeling results: full model permeabilities. A r c h itectu r al Geome t r ic m ean Permea hili ty in Permea bility in NN, PN, pp Fracture kmox: kmln p erm eability of NN di rection directio ns n ormalized to t h e d i r ecti o n s aper t ures m o d el ( m z) NN, PN, PP NN di r ectio n in fa ul t pp directions ( mz) NN PN zone (!l m ) 4.3E-13 1.3E-14 1.9E+2 1.9E+2 PN:NN 1000 SFF 3.1E-14 PN:NN DDZ 1.1 E-1 I 7.5E+3 6.5E+3 1.8E-12 3.0E-14 6.2E+2 PN:NN I.DZ 3.4E+2 3.5E-12 4.6E-14 8.8E+2 5.0E+2 PN:NN CDZ 100
SFF DDZ I.DZ CDZ
I. 7E-14 1.1 E-13 2. 1E-14 l.lE-13
1.3E-14 1.9E-14 1.4E-14 2.4E-14
I.OE+O 1.4E+l 2.0E+0 1.2E+l
2.0E+O 1.2E+I 2.0E+0 9.0E+0
PP:NN PN:NN PN:NN PN:NN
10
SFF DDZ I..DZ CDZ
1.4E-14 6.4E-15
1.2E-14 4.8E-16 3.8E-16 9.8E-16
l.OE+O 5.8E+I 7.2E+l 2.9E+2
I .OE+O 4.0E+l 2.0E+I 2.0E+2
ISOTROPIC PN:NN PN:NN PN:NN
4.4E~l5
3.8E-14
1.3E-14 1.2E- 14 ISOTROPIC SFF l'.OE+O l.OE+O 6.6E-16 5.2E-19 5.3E+4 3.7E+4 PN:NN DDZ 3.4E- 19 I.DZ 4.2E-16 2.5E+4 PN:NN 8. 1E+4 3.8E- 15 l.OE-18 CDZ PN:NN 2.8E+5 1.9E+5 Note: For each full model run: Fracture model domain size= 20 m by 20 m by 20 m; Flow simulation region = 18 m by 18 m by 18 m; No matrix permeability; Initial conditions @ time=O, head=O, and flux=O; Hydraulic gradient= I; Steady state flow; k,..., and k""" refer to the directions of maximum and minimum permeability.
deformation [e.g., Power and Tullis , 1989]. Reducing fracture apertures in each fault zone from 100 to I 0 J..l.m, then to I J..l.m (Fig. 7 and Table 4) mimics the way that reduced faull zone permeability might cause significant reductions in bulk permeabmty normal to the fault zone (one to two orders of magnitude for the I 0 J..l.m case and four to five orders of magnitude for the 1 J..l.m case). Permeability parallel to the fault zone, however, is little affected by sealing because fluid directed toward the fault zone is primarily transmitted through the adjacent protolith in the SFF, LDZ, and DDZ models, or in the damage zone of the CDZ model (Fig. 7 and Table 4). The net effect of this significant anisotropy resulting from sealing causes redirection of fluid flow. For example, progressive sealing during the postfailure stage of deformation leads to a permeability structure that directs flow along the outside of a low-permeability fault zone when hydraulic gradients are not exactly perpendicular to the fault zone. Under the same hydraulic conditions, significant permeability enhancement in fault zone-parallel directions can occur during failure to cause fluid flow to be focused in the fault zone. As the deformation cycle continues, sealing in the fault zone causes progressively less fluid to flow through it as flow is redirected through the adjacent protolith. Additionally, when fracture aperture between components is not uniform; fracture length, orientation, and density become less important than aperture in controlling anisotropy at the full model scale.
Patterns of Fault-Related Fluid Flux The patterns and rates of fluid flux within and near a fault zone are thought to play an important role in the processes of fault zone sealing, mineral deposition, hydrocarbon migration, solute transport, geothermal fluid migration, and e volution of fau lt zone strength due to reequilibration of pore fluid pressures before, during and after failure events. For example, fault zone sealing can, in part, be attributed to mechanical processes such as grain-size reduction [Chester and Logan, 1986; Hippler, 1993]. However, aqueous geochemical reactions are also an integral part of sealing and other processes [Knipe, 1993; Fisher and Knipe, 1998; Caine, 1999]. Graphic illustrations of the magnitudes and directions of fluid flux within each fault zone architectural model help to conceptualize the spatial variations of fluid flux and how those variations might influence fault zone evolution (Figs. 8 and 9). Flux magnitude plots (Fig. 8) are created using the three-dimensional fluid flux vectors computed at the centroid of each triangular finite element. The plots show the flux results located within a 1 m wide, vertical slab parallel to the PP and NN flow directions centered within each model domain. The values of fluid tluxes computed at each element centroid are first projected onto a single plane and then contoured. Using a thin slab from the full model domain allows a limited amount of the three-dimensional
CAINE AND FORSTER
-9
-
.. : .. : ..
SFF
DDZ
-11
LDZ
CDZ
-
-13
'6
'6
E
'6
~-- L - - - ~--- - ' - - - -
~
..2
LDZ
-19
..
-~ L6 _-.! /:;:.----•-- A ..... l
SFF
DDZ
LDZ
-15
-13
~
I
.. . .
L--
I
'6 I
.! -
..
-
I
. . -• - - -
I
I
'6 I
Aperture Settings PL = DZ = Core = 100f-1.m
CDZ
N
_g' -15
I
-19 .__ _ _ _ _ _ _ _ _ ___,
.L-----------..1
-11
~
-- ·6
-13
Aperture Settings PL = DZ = 1OOf-l.m, Core = 1OOOf-l.m
-9
CDZ
-17
-17
E
DDZ
-11
~
C)
_g' -15
--
SFF
N
N
E
-9
117
•
6
-9
SFF
DDZ
LDZ
CDZ
-11
N'
E
-13
I
_g' -15
..
.I-- .-·---
.. 1.
I
I
I
I
'6
-~ L -I
~
-17
-17
-19 ..__ _ _ _ _ _ _ _ _ _......
o6_ _ _ _ _ _ I -19 ..__ _ _ ___,
I
Aperture Settings PL = DZ = 100f-1.m, Core= 10f-1.m
•6
Aperture Settings PL = DZ = 100f-1.rn, Core= 1f-1.m
6
Flow Normal to Fault Zone and Slip Vector (NN)
e
Flow Parallel to Fault Zone and Normal to Slip Vector (PN)
•
Flow Parallel to Fault Zone and Slip Vector (PP)
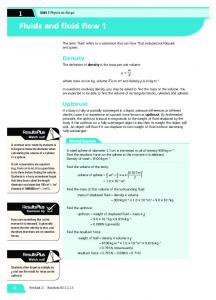
Figure 7. Bulk log permcabilities for each full model domain calculated from model results for each of the three flow directions (NN =triangles, PN =circles, and PP =squares). Results for each model (SFF, DDZ, LDZ, and CDZ) show the progressive closure of fault zone fracture apertures uniformly from I j.lm to 1000 J.lm. The protolith and damage zone fracture apertures are uniformly 100 J.lm in each model. nux structure to come into view without obscuring the details. The two-dimensional flux vector plots of Figure 9 show the directions of fluid flux within a l em thick, vertical slab located within the I m wide slab used to create the flux magnitude maps of Figure 8. Only they and z components of fluid flux are used because it is difficult to present the three-dimensional vectors that fully capture all aspects of
the fluid now patterns. The reader must note that the actual three-dimensional flow directions are different. With this cautionary note in mjnd, however, insight can be gained from the flux vector plots. The detailed variability of fluid flux shown in Figures 8 and 9 can be djrectJy Jjnked to the variations in fracture density, orientation, trace length, interconnectivity, and aperture associated with the protolith and each fault zone.
FAULT ZONE ARCHITECTURE AND FLULD FLOW
118
~ PP Flow~
.,_NNFiow.,_ 10
PL
FZ
PL
10
PL
pp
~PN
lJ.llf
NN
. --
FZ
PL
E
o
·10 !':--~~~~~~~~~-:~0
0
10
PL
FZ
10
PL
F Z+
t
Origin= Y-- 0,0,0-Y+
0
(meters) ~
z·10 "'=-~~~~~~~~~-:' · 10 0 10 10
PL
FZ
PL
G PL: a= 100 1-1m DZ: a= 100 )lm FZ I C: a 1 0 )lm
=
•1~1:-.;o:--'----'-~----;:o:--'~--""--::' 1o 10
PL
DZ C DZ
PL
H -4.5
i
)(
"'
-5.5 ~
:;
u::
01
.s -6.5
I
CAINE AND FORSTER Note that Figures S and 9 are created only for prefailure and postfailure stages of deformation where fracture apertures in each fault zone are assigned a value of lO Jl.m while all other fractures are I00 Jl.m. Large gradients in fluid flux (several orders of magnitude) found both within and between fault zone components highlight the location of important transitions between regions of low and high fluid flux in each model (Fig. S). Consider the results presented in Figures S and 9 for the SFF model. Fluid fluxes (Figs. Sa and 8e) are uniformly high within the protolith regardless of gradient orientation while fluxes in the I0 Jl.m, single fracture fault are several orders of magnitude lower. The corresponding fluid flow vectors of Figures 9a and 9b clearly illustrate how the overall direction and the detailed patterns of flow differ between the two flow directions (NN versus PP flow). Detailed ·variations within the protolith of the SFF model reflect the internal variation of fracture interconnectivity. Results obtained for the DDZ model emphasize the observations made in the previous sections regarding the way that the reduced fracture apertures (10 versus 100 Jl.ID) in the fault zone cause the bulk of the fluid moving parallel to the fault to be transmitted at higher flux rates through the protolith (Figs. Sf and 9t). When the hydraulic gradient is normal to the fault zone flow is restricted by smaller fracture apertures in the fault zone. This causes fluxes in the protolith of the DDZ model (Figs. Sb and 9b) to be reduced by several orders of magnitude below that of the SFF model (Figs. Sa and 9a). In the case of flow in the NN direction, flux variations are much reduced within the model domain (Fig. Sb) when compared to the variations computed for flow in the PP direction (Fig. Sf). Similar results are obtained for the thinner fault zone in the LDZ model (Figs. 8c, Sg, 9c, and 9g). Fluid flux magnitudes and flux vector patterns obtained for the CDZ model reveal an interesting aspect of faultrelated fluid flow. When the hydraulic gradient is normal to the fault zone, fluid fluxes in the fault core are greater than those found in both the damage zone and the protolith. This occurs because the lower permeability protolith defines the overall rate of fluid delivered to both the damage zone and the fault core (Table 2). The large aperture (100 Jl.m), long length (-5 m), high density (7 m2/m 3) fracture network in the damage zone, on the right-hand side of the fault core, efficiently transmits the fluid from the protolith to the core at reduced fluxes. Yet, the small aperture (10 Jl.m), short length (-0.5 m), high density (6 m2/m 3) fracture network in
119
the fault core must transmit the fluid at much higher fluxes to the damage zone on the left-hand side of the fault core (Figs. Sd and 9d). Note that the fracture density in the fault core and damage zone are one order of magnitude greater than that of the protolith (0.6 m 2/m 3, see Table 1). This suggests that, at a one order of magnitude difference between component apertures, fracture aperture has a much larger effect on flux than does fracture orientation, density, and length at the full model scale. Although a similar effect occurs for flow normal to the fault zone in all models, the two-component fault zone of the CDZ model amplifies the effect (Figs. Sa, 8b, 8c, and 8d). The fau lt core of the CDZ model (Figs. Sd and 9d) forms a localized zone of high fluxes when flow is directed normal to the fault, similar to what is hypothesized for natural fault zones [e.g., Sibson, 1996]. DISCUSSION AND IMPLICATIONS FOR NATURAL FAULT ZONES The fault zone models shown in Figures 1 and 4 can be viewed as sequential steps in the mechanical initiation and growth of a brittle fault zone. For example, when a single fault 'plane' with a very small initial displacement (i.e., the SFF model) experiences multiple deformation events it may grow into a DDZ type of fault zone. As the fault zone continues to grow it may take a path toward either the LDZ type of fault zone, with highly localized strain, or the CDZ type of fault zone where the strain is partitioned between the core and the damage zone (Fig. 4). Increasing mineralogical ' maturity' in the fault core of LDZ and CDZ type faults (through mechanical and geochemical assimilation of protolith) likely leads to important changes in the permeability structure of a fault zone [e.g., Knipe, 1993; Caine, 1996]. Progression through the evolution of a fau lt zone is accompanied by episodic cycles of deformation [Byerlee, 1993; Sibson, 1994; Caine et al., 1996]. In the previous sections we use the model results to illustrate possible relationships between the mechanics of the fault zone architectural styles and the evolution of fault zone permeability structure in the context of stress cycling and associated deformation [e.g., Sibson, 1994 and 1996]. By closing fracture apertures in the fault zone we mimic the evolution of fault zone permeability structure through various stages of deformation (e.g., Fig. 7). This evolution can be thought of as reflecting the mechanical dcfonnation
Figure 8. Maps of the two-dimensional magnitude of Darcy fluid flux for each model. A through D shows results for flow normal to the fault zone and normal to the slip vector (NN) or flow from right to left. E through H shows results for flow parallel to the fault zone and parallel to the slip vector (PP) or flow from top to bottom. Each map represents the contoured data from a I m thick slab (in the x direction) projected on to the y, z plane (Note: the coordinate system depiction has the orientation of the mapped slabs as a gray plane). In each case the 'plane of the fault zone' is perpendicular to the page. The fau lt zone components are listed as PL = Protolith, PZ = Fault Zone, DZ =Damage Zone, C =Core. The uniform fracture aperture settings are 100 l!m in each protolith and 10 ~-Lm in each fault zone.
120
FAULT ZONE ARCHITECTURE AND FLUID FLOW
~ PP Flow~
~ NN Flow+10
PL
FZ
PL
10
PL
FZ
PL
PL
FZ
PL
pp
e .2
~PN
0
~ ::::
at~ ..!!!"
~ NN
0
o
~ ..... (I)
8.9e-04 m/s ~
-10 -10
c:
10
PL
PL
,0
10
B
.::::: a,
e .E
\ .. .. ... 'J?/N .. y; '/' / . 1.. . .. I ~~ .
ti l .
t
cuCU
Origin= Y-- 0,0,0 - Y+ (meters) ~ Z-
'tl~ .!!! :l
;Q
F
li ~ : : : }/ Z+
QC: 0
-
·10 -10
1.,'()
0
~:
: : : >! . ~ ; •
.
t
•
•
•
. •
• •
...
. • •
I
'
....
t
.
'
~/' ,.. o
'
•
•
'
I
•
•
•
•
•
I
I
..,.
\'
;;::
'\,
.~
~ ~~' . ~ · . ; 'v~ ~ 3.~rnls
Q
c:
,~~
-10 -10
-10 -10 PL
10
.::::: a,
•
e .Ecu
'
•
•
•
'
'
'
'
'
'
•
, ,
•
'
.,\
1
-~< -
--
Q)
.
•
I
'
'
I
II '
.. ' '
'
'
•
•
f
/
'
'
I
I
I
, \
"
I
.... - ........
t
•
I
I
I
I
0
•
0
PL: a= 100J.tm DZ: a= 100J.tm FZ I C: a 1 OJ.tm
'
=
: •
•
//b; . "' ' "§!if#' . , . ... • . - - . 5. ~·05 rnls
••• "
•
'
,.
-::. •
•
-10 -1~ 0~~~~~0~~----~10 10
.::::: a,
e
.E cu Cl)
QC: o
.!!!~ ~
8.5e-04 m/s ·10 !'=--...__....__....___-=-~~~-....:::;:; -10
10
,0
·~
0
..
... .,., ... ... \¥ . . . / •
•
10
'
I " . . ... .
. .• . . . .
0 PL
..
. . ,,, . '
::: . : : :-/ ~~~~-'--:
,
/I~
I' -
..
.....
\;"
-~,,
~
....
'1\\,
. ·'---
-, / ·· · -·'' - . I ' ' ' . ' I -
~0 c:
•
'
.~ .....
•
. .. •. ., .. ..
0
10
... ,--.·- C
,0
~~
PL
....
f'
I
I
-
..
\
··· ~ ·· ·" · '
8 _10'.ix-~~·_:~:~:_·. . . . .',~_' ~:_: ~:_:~:~~ ---z .5e-04 m/s 0
0
PL
DZ C DZ
10
PL
CAINE AND FORSTER cycle from prefailure, to failure, to postfailure for a brittle fault zone. In the prefailure stage microscale to macroscale fractures will begin to open and close depending on their orientations, the stress field, and their tendency to shear ancVor dilate [e.g., Brown and Bruhn, 1998; Caine, 1999; Ferrill et al., 1999]. The migration of pore fluids into incipient fault zone fractures may initiate and enhance brittle failure where localized increases of pore fluid pressure in the fault zones occur [e.g., Byerlee, 1993; Sibson, 1994 and 1996]. During the initial phase of failure, fault zone permeability structure might be exemplified by the models with fault core apertures of I 000 J..Lm (Fig. 7). At brittle fail ure new fractures develop, and preexisting fractures may grow, to cause enhanced permeability within the fault zone [e.g., Sibson, 1994]. Both the model results and outcrop observations suggest that fluid flow is enhanced and localized in the fault zone during failure. In the failure to postfailure stages comminution and fluid flow may facilitate geochemical reaction, thus localizing precipitation of minerals trapped in the fault core to cause fault zone sealing and reduced permeability [e.g., Knipe, 1993; Sibson, 1994; Caine, 1996; Fisher and Knipe, 1998; Caine, 1999]. If we assume a flux limited, fault-related flow system [e.g., Bunds et al., 1997] the greatest accumulation of mineral precipitates will form where fluid fluxes are high. Additionally, fluid pressure redistribution may also be associated with dilatancy hardening and subsequent localized rupture arrest
[Parry and Bruhn, 1990; Serom et al., 1998; Caine, 1999]. Lithologic heterogeneity of fault-rocks leads to inherent permeability heterogeneity within a fau lt zone that, in turn, produces a complex distribution of sealed and unsealed zones that may lead to spatial variations in fault zone strength [e.g., Cowie and Shipton, 1998] and pore pressures [e.g., Byerlee, 1993]. Nur and Booker [1972] and Miller et al. [ 1996] suggest that the spatial and temporal distribution of earthquake aftershocks may be linked to the process of heterogeneous fault zone sealing as deformation ceases and pore pressure readjusts within the fault zone. The relatively simple variations in permeability structure addressed in this paper provide preliminary insight regarding the more complex processes that operate in natural fault zones (Figs. 8 and 9). For example, large permeability contrasts may cause large, heterogeneously distributed pressure gradients due to transient, deformation-related fluid flow pulses. As deformation and fluid flow are accommodated, discrete zones of rupture and arrest may cause longitudinal and lateral
121
growth of the fault zone as well as further alteration of its permeability structure. A natural fault zone may contai n any or all of the architectural styles shown in Figures 1 and 4 within a single fault strand. Additionally, many natural fault zones are not the simple, single fault zone features studied here. Rather, they are sometimes composed of many strands of deformed zones also containing any or all of the architectural styles. Although many variations of cyclic fault zone evolution might be proposed, the one discussed here forms a useful backdrop for interpreting the modeling results that, in tum, helps in thinking through the complex interplay of coupled mechanical and fluid-flow processes that operate in natural fault zones. In reviewing the modeling results, it is important to recall that the impact of ambient regional stress and localized deformation-related stress found in the subsurface are not considered when assigni ng values for fracture apertures in the models. Stress will cause significant variations in fracture aperture as a function of orientation that, in turn, must influence permeability anisotropy of both individual fault components and the entire fault zone [Brown and Bruhn, I998]. Fracture surface roughness, particularly when coupled with stress and deformation, is also an additional source of potential anisotropy that may make the use of the cubic law to model real fracture networks under stress invalid [Brown, 1995; Brown and Bruhn, 1998]. Aperture may also vary as a function of host rock lithology, degree of mineralization, and fracture type [Neuzil and Tracy, I 98 I; Mozley and Goodwin, I 995; Brown and Bruhn, 1996 and 1998; Caine, 1999]. This is particularly true for shear fractures where variations in the surface topography of slickensided surfaces may cause channelized flow parallel to the slip vector [Brown aid Bruhn, 1996]. An alternative to using the cubic law for aperture is presented in Brown and Bruhn [1998] where approximations for fracture surface roughness using fractal surface geometries are coupled with stress and deformation. In spite of the additional sources of anisotropy, the simple parallel plate models used to represent fractures in this modeling study do help in discerning the overall impact of the different fault zone components. While the use of stressed fracture models and their associated aperture variations would be ideal, the models presented are meant to be a first look at the impacts of fault zone architecture and component heterogeneity on fluid flow without being
F igure 9. Maps of the two-dimensional, y, z components, of the Darcy fluid fluxes for each fault zone model corresponding to the same maps in Figure 8. A through D show results for flow normal to the fau lt zone and normal to the slip vector (NN) or flow from right to left. E through H shows results for tlow parallel to the fau lt zone and parallel to the slip vector (PP) or flow from top to bottom. Each map represents the vector data from a I em thick slab (in the x direction) projected on to they, z plane (Note: the coordinate system depiction has the orientation of the mapped slabs as a gray plane). In each case the 'plane of the fault zone' is perpendicular to the page. The fault zone componems are listed as PL = Protolith, FZ = Fault Zone, DZ = Damage Zone, C = Core. Note that the three-dimensional now directions are different and these are shown to illustrate the complexity of each flow system. The empty space in some of the maps is due to lack of fracture connection with a flow boundary.
122
FAULT ZONE ARCHITECTURE AND FLUID FLOW
obscured by variations in aperture. One consequence, however, of neglecting stress-related aperture anisotropy may be exhibited by the result that the maximum permeability computed within the fault zone, in the PP and PN tlow directions, is found normal to the slip vector in the PN flow direction (Figs. 6 and 7). This is in agreement with that postulated by Sibson [1996], but differs from the suggestion by Brown and Bruhn [ 1998] and Caine [1999] that the direction of maximum permeability within the fault zone is subparallel to the slip vector or PP flow direction. One goal of this study has been to explore permeability anisotropy in directions related to the major fabric elements of the fault zone models. Results obtained from these numerical experiments are used to compare the apparent anisotropy in each component and each architectural style. Although it is of great practical interest to define equivalent continuum permeability tensors at the fault zone component or 20 m full model scale, this may not be possible [National Research Council Committee on Fracture Characterization and Fluid Flow, 1996]. For example, a variety of workers [e.g., Snow, 1969; Long et al., 1982; Long and Witherspoon, 1985] have tried unsuccessfully to define when fracture networks may be properly represented by equivalent continuum permeability tensors. Even if plausible tensors could be defined for the fracture networks included in this study, the flow directions we use do not necessarily coincide with the principal directions of permeability. Despite our inability to define permeability tensors (scale-independent or otherwise), our results do yield insight into apparent permeabilities in directions related to the geometric character of the fracture networks in the fault zones. The orientations of the one-dimensional flow experiments are generally parallel to the orientations of major fabric elements (e.g. , mean orientation of the planes of fracture sets and their intersections). Thus, the results provide useful first approximations to the permeability anisotropy of the fault-related fracture network fabric. Inferences made using the model results resemble those made by mapping natural fault zones exposed in outcrop. Field observations made along outcrops of the Stillwater Fault Zone show that the fracture sets most consistently filled with the latest fault-related mineral assemblage are found in fracture networks subparallel to the fault zone. Because the fault core and damage zone fractures of this CDZ type of fault zone (Fig. 4) are filled with the same mineral assemblage, we can infer syntectonic fluid flow extended into the damage zone. Fault rock textures from the core of the Stillwater Fault Zone also show a preferred orientation subparallel to the fault zone that are related to the coupled processes of deformation and fluid flow [Caine, 1999]. Similar observations are reported by Caine [ 1996] from the sequence of clastic rocks that have undergone normal faulting in east Greenland. Because strike slip and thrust fault zones commonly contain the same architectural elements found in the normal fault zones considered in this
paper, the model results may be applicable to any style of faulting. The results of this modeling study can also be compared to in situ fluid flow measurements made in the Dixie Valley geothermal field that is hosted in the Stillwater Fault Zone [Hickman et al. , 1997; Barton et al., 1998]. Although the boreholes are several kilometers from the outcrop exposures where the data used in building the models was collected, the downhole studies were performed in similar rock types subjected to similar deformation histories. Our models suggest that the permeability anisotropy in the fault zones are controlled primarily by long shear fractures that may also contribute to the bulk permeability anisotropy inferred by Hickman et al. [1997] and Barton et al. [1998] in the geothermal reservoir. For example, Hickman et al. [1997] and Barton et al. [1998] found that the hydraulically conductive fractures in the boreholes are optimally oriented and critically stressed for frictional failure in the present stress field. The orientation data for the conductive fractures that Hickman et al. [1997] and Barton et al. [1998] found in the boreholes are similar to the shear fracture orientations as mapped in outcrop (Fig. 2). Both sets of data are mechanically compatible with an Andersonian model for shear fractures associated with a normal fault. Thus, the model results presented here support the field-based inference that the relatively large aperture, long trace length, high density networks of shear fractures associated with faulting can exert an significant impact on bulk permeability anisotropy within a natural fault zone. In addition, Hickman et al. [1997] and Barton etal. [1998] show that the in situ stress data at the Dixie Valley Geothermal Reservoir indicates a present day stress regime that is consistent with an Andersonian fault model and associated fault-related fracture networks. Although an Andersonian model is not the only model that could be used to explain the Dixie Valley stress and fracture data, we have used it in our modeling because of its simplicity and general applicability to many different fault zones. Computed permeabilities based on outcrop data from the Stillwater Fault Zone can be used to infer the cause of enhanced fault zone permeabilities found during in situ testing at the Dixie Valley geothermal field [Barton et al., 1996; Rose et al., 1997; Hickman et al., 1997]. For example, the various in situ tests at depths of 2.5 km suggest a fault zone permeability of 10" 12 to 10" 11 m 2 • Hickman et al. [ 1997] suggest that the fractures causing the zone of enhanced permeability are preferentially open and accessible for flow because they are optimally oriented with respect to the local stress regime. Extrapolating our modeling results suggests that increasing fracture apertures in the fault zone components of the non-SFF fault types by only a factor of 5 (from 100 to 500 ).tm) would yield fault zone permeabilities similar to those measured in situ. This modeling study addresses only outcrop scale volumes (20 m by 20 m by 20 m) of faulted rock that
CAINE AND FORSTER influence the local patterns and rates of fluid flow within and near a fault zone. The flow of fluid to the fault, however, is ultimately controlled by regional-scale flow systems [Forster and Evans, 1991] driven by a variety of mechanisms (e.g., topography, thermal gradients, or tectonic activity). Thus, the next step in examining the impact of fault zone penneability structure on fluid flow requires incorporating the effective permeability magnitudes and anisotropies estimated in this study into larger, stressed and unstressed, regional-scale fluid flow simulations. This approach would not only remove the need to apply arbitrary orientations of hydraulic gradients to the fault model blocks, but would also aid in evaluating how fluids moving through the regional-scale flow systems can carry solutes from sources either close to, or far from, the fault zone. For example, Power and Tullis [ 1989] note that, once delivered to the fault zone, solutes carried by the migrating fluids can participate in the processes that contribute to fault zone sealing, mineral comminution, stress relaxation and mineral precipitation. SUMMARY OF MAJOR RESULTS AND CONCLUSIONS We have created four stochastic, three-dimensional discrete fracture network models (single fracture fault, SFF; distributed deformation zone, DDZ; localized deformation zone, LDZ; and composite deformation zone, CDZ) that exemplify the field-based fault zone architectural styles summarized by Caine et al. [ 1996]. The models represent outcrop scale (cubes that are 20 m on a side) idealized fault zones developed in low permeability rocks. Each model type contains one or both fault zone components, a damage zone or fault core, surrounded by a protolith. Fracture densities, trace lengths, and orientations included in the models were based on data obtained from detailed outcrop mapping along the Stillwater Fault Zone in Dixie Valley, Nevada and from a series of normal fault zones in east Greenland which exhibit each of the four architectural styles. Fault zone component widths were based on data from east Greenland. Insights regarding fault mechanics and kinematics are also used in constructing the models. Thus, fluid flow simulations perfonned on the discrete fracture network models provide direct insight into the permeability structure of the Stillwater Fault Zone in particular, and normal faults in general. Furthermore, because strike slip and thrust fau lt zones contain similar architectural elements, the model results may apply when considering any style of fault zone. Simulating fluid flow through the discrete fracture network models allowed us to quantify inferences made by Caine et al. [ 1996] and other workers regarding the relationships between fault zone architecture and permeability structure. Fracture networks associated with each component type impart bulk permeabilities that, when combined,
123
lead to bulk permeability anisotropy that can exert a significant impact on patterns and rates of fluid flow. For example, if we exclude the SFF (single fracture fault) then simulations performed with a uniform 100 J..lm fracture aperture yield permeabilities for the protolith (-10- 14 m 2 ), damage zone (-10· 13 m 2), and fault core (-10-13 m2). Two distinct types of anisotropy were identified as major controlling factors in fault-related fluid flow and permeability structure. The first is the internal bulk anisotropy within individual fault zone components contributed by the character of the fracture network fabrics. The second source of anisotropy is derived from the permeability contrasts that result from juxtaposing different fault zone components. Thus, component-scale permeability heterogeneity leads to bulk fault zone scale anisotropy. Both types of anisotropy reflect the protolithology, deformation style, and the stress, temperature, pressure, and geochemical conditions encountered throughout the evolution of a fault zone. The resulting fault zone architectures and permeability structures for any given set of conditions and histories, at any given point in time, can cause changes in the magnitude and direction of local fluid fluxes that vary by orders of magnitude. Ratios of permeability anisotropy were determined in three orthogonal flow directions with respect to the average orientation of each fault zone (kNN : krN : krr). Anisotropy values obtained within each individual component in each non-SFF model where all fracture apertures are the same ( I 00 J..lm), were small and range from =I :0.2:0.8 in a protolith to =1:6:5 in a fault core for NN, PN, and PP flow directions respectively. The permeability contrasts between components that contribute to bulk anisotropy in fault zone permeability are much larger. For example, permeability contrasts range from appro~imately one to five orders of magnitude between a fault core and a protolith (=I0· 1Y m 2 and = 10. 14 m 2 respectively). Thus, the architecture of multiple fault zone components has more impact than internal fault zone component architecture alone. With uniform apertures between and within fault zone components, the model results suggest that fracture length and orientation are more important in controlling anisotropy than fracture density. This was found to be the case at both the fault zone component scale and the full model scale. When fault zone fracture apertures are uniformly opened or closed relative to the protolitb or damage zone, aperture becomes the controlling parameter of anisotropy relative to fracture length, orientation, and density. This is due to the cubic law correlation between aperture and transmissivity used in the models. Variations of fracture aperture in natural fault zones, due to different types of fracture sets, stress, and degree of mineral filling may change these sensitivities, but were not investigated here. Thus, the modeling results suggest that the orientation of fracture sets and particularly fracture length, which is often very difficult to measure, are the most important field data to collect for later model input.
124
FAULT ZONE ARCIDTECTURE AND FLUID FLOW
Geologically plausible fracture networks constructed for each non-SFF fault zone component yielded permeabilities within the fault zone and parallel to slip that are consistently smaller than those computed perpendicular to the slip vector. Additional sources of anisotropy not included in the fracture models (e.g., orientation-dependent aperture variability caused by: differential stress, variations in fracture roughness, and anisotropy in fracture surface topography) could be used to explain why the maximum permeability in the fault zone is not found to be parallel to the slip vector in the simulations. The model results also demonstrate that regardless of the regional flow direction, fault zone architectural style, and magnitude of displacement fluid flow is enhanced parallel to the fault zone and impeded normal to the fault zone when fracture apertures are reduced relative to an 'unfaulted' protolith reference case. Increasing or decreasing fracture apertures by only one order of magnitude within the fault zone of each non-SFF model yields one to five orders of magnitude change in component permeability that, in turn, yields similarly large permeability anisotropy for all non-SFF type fault zone models. Values of permeability anisotropy in excess of one order of magnitude can significantly modify the patterns and rates of fluid flow within and near fault zones, depending upon the orientation of hydraulic gradients acting at the location of interest The modeled variations in fracture aperture mimic the changes that might occur during fault zone evolution. Thus, increased bulk anisotropy caused by enhanced permeabilities in the fault zone can lead to a focusing of fluid flow into the fault zone during failure. On the other hand, similarly large anisotropy caused by sealing of fractures in the fault zone can cause fluid flow to be distributed throughout the adjacent protolith, or damage zone. When the model results are considered in conjunction with contemporaneous deformation they highlight how a fault zone may be destined to seal itself and arrest deformation because initial opening of the fault-related permeability structure causes mass transport in the core of the fault zone. Positive feedback between mineral precipitation, permeability reduction, and pore pressure relaxation in the fault core may cause localized, but heterogeneously distributed, mechanical strength. The modeling results and conjectured processes also highlight the means by which, and the controls on how, fault zone architecture, permeability structure and growth might be intimately involved with the distribution of earthquakes and the deposition of economic mineral deposits. Furthermore, the models illustrate how fault zone architectural styles and the hydraulic parameters identified may lead to conduit, barrier, or combined conduitbarrier permeability structures. This study also forms a first step in outlining a methodology for constraining fau lt-related permeability values assigned in continuum (porous media) fluid flow simulators. For example, the model results yield permeability estimates that can be used in parameterizing fluid flow
simulations for the geothermal reservoir hosted in the Stillwater Fault Zone. If sufficient computational capacity is available, simulator grid blocks can be sized to map the heterogeneous permeability structure defined by the spatial distribution of permeability associated with each fault zone component type. If b.l ocks no smaller than those used in this study can be used, then bulk permeability anisotropies defined for the full width of the fault zone should be assigned in an effort to preserve the detailed heterogeneity contributed by the individual fault zone components. Acknowledgments. The authors would like to thank the University of Utah, Department of Geology antl Geophysics for financial ~and computer faciLity support of the first an thor during his graduate studies there. We most gratefully thank Glori Lee, William Dershowitz, Paul LaPointe, and Trenton Cladouhos of Golder Associates, Inc., for support in using FracMan™, MeshMaker™, EdMeshTM, and Mafic™. We thank Stephen Snelgrove and Steven Schulz for their input and efforts in completing the model runs and associated output. Constructive and thoughtful reviews from Simon Cox, an anonymous reviewer, and Bill Haneberg were helpful in clarifying several issues in the manuscript. Comments from Ron Bruhn and Jim Evans were also much appreciated. Fracture network visualizations were created using GeomView by the Geometry Center, University of Minnesota.
REFERENCES Anderson, E. M., The dynamics of faulting, Oliver and Boyd, Edinburgh, 1951. Anderson, L. J., Osborne, R. H., Palmer, D. F., Petrogenesis of cataclastic rocks within the San Andreas fault zone of southern California, USA, Tectonophysics, 61 , 221-249, 1980. Andersson, J. E., Ekman, L., Nordqvist, R., and Winberg, A., Hydraulic testing and modeling of a low-angle fracture zone at Finssjon, Sweden, J. Hydro/., 126, 45-77, 1991. Antonellini, M., and Aydin, A., Effect of faulting on fluid flow in porous sandstones, petrophyscial properties, AAPG Bull., 78, 355-377, 1994. Barton, C. A., Hickman, S., Morin, R., Zoback, M. D., and Benoit, D., Reservoir scale fracture permeability in the Dixie Valley, Nevada, geothermal field , Proc. 23rd Workshop on Geothermal Reservoir Eng., Stanford Univ., California, 1998. Brown, S. R., Fluid flow through rock joints: The effect of surface roughness, J. Geophys. Res., 92, I 3 37-1 347, 1987. Brown, S. R., and Bruhn, R. L., Formation of voids and veins during faulting, J. Struct. Geol., 18, 657-671, 1996. Brown, S. R., and Bruhn, R. L., Fluid permeability of deformable fracture networks, J. Geophys. Res., 103, 24892500, 1998. Bruhn, R. L., Yonkee, W. E., and Parry, W. T., Structural and fluid-chemical properties of seismogenic normal faults, Tectonophysics, 175, 139-157, 1990. Bruhn, R. L., Parry, W. T., Yonkee, W. A., and Thompson, T.,
CAINE AND FORSTER Fracturing and hydrothermal alteratio n in normal fault zones, Pure Appl. Geophys., 142, 609-644, 1994. Bunds, M. P., Bruhn, R. L., and Parry, W. T., Comparing nature and experiment at the top of the seismogenic zone: The Castle Mountain fault, Alaska (abstract), Eos, Trans. AGU, 77, 718, 1996. Byerlee, J., Model for episodic flow of high-pressure water in fault zones before earthquakes, Geology, 21, 303-306, 1993. Caine, J. S., Regional comparison of melange fabrics in the Taconic Orogen, southeastern New York state and western Newfoundland, Canada (abstract), 2nd Ann. Cen. Can. Geol. Conf Prog., Toronto, 2, 24, 1989. Caine, J. S., Coates, D. R., Timoffeef N. P., Davis, W. D., Hydrogeology of the northern Shawangunk mountains, NY State Geo/. Surv. open file report I g806, 72, 1991. Caine, J. S., Deformation, fault zone architecture, permeability structure and evidence for fluid llow in a brittle normal fau lt, Traill Island, east Greenland, in Faulting, fault sealing and fluid flow in hydrocarbon reservoirs (abstract), edited by G. Jones, Q. Fisher, and R. Knipe, Univ. of Leeds, U.K., 8182, 1996. Caine, J. S., Evans, J. P., and Forster, C. B., Fault zone architecture and permeability structure, Geology, 24, I 0251028, 1996. Caine, J. S. and Forster, C. B., Architecture and permeability structure of the Stillwater normal fault, Dixie Valley, Nevada (abstract), Ann. Meeting Geol. Soc. Am., Salt Lake City, Utah, 29, A-226, 1997. Caine, J. S .• The architecture and permeability structure of brittle fault zones, Ph.D. dissertation, Univ. of Utah, Salt Lake City, UT, 1999. Caskey, S. J., Wesnousky, S. G., Zhang-Peizhen, Slemmons, D. B., Surface faulting of the 1954 Fairview Peak (Ms 7.2) and Dixie Valley (Ms 6.8) earthquakes, central Nevada, Bull. Seism. Soc. Am., 86, 761-787, 1996. Chester, F. M. and Logan, J. M., Composite planar fabric of gouge from the Punchbowl Fault, California, 1. Struct. Geol., 9, 621-634, 1986. Chester, F. M., Evans, J. P., and Biegel, R. L., Internal structure and weakening mechanisms of the San Andreas fault, J. Geophys. Res.• 98, 771-786, 1993. Cowie, P. A., and Shipton, Z. K., Fault tip displacement gradients and process zone dimensions, J. Struct. Ceo/, 20, 983-997. 1998. Davis, G. H., Stmctural geology of rocks and regions, John Wiley and Sons, New York, 1984. Davison, C. C. and Kozak, E. T., Hydrogeologic characteristics of major fracture zones in a large granite batholith of the Canadian shield, Proc. 4th Can. Am. Conf on Hydrogeo., Banff, 1988. Dawers, N. H., Anders, M. H., Scholz, C. H., Growth of normal faults: Displacement-length scaling, Geology, 21, II 071110, 1993. Dershowitz, W., Lee, G., Geier, J., Fox ford, T., LaPointe, P., Thomas, A., FracManlM: Interactive discrete feature data analysis. geometric modeling, and exploration simulation, User Documentation, version 2.5, Golder Associates, Inc., Redman, Washington, 1996. Evans, J. P., Forster, C. B., Goddard, J. V., Permeability of fault-related rocks, and implications for hydraulic structure of fault zones: 1. Struct. Geol., 19, 1393-1404, 1997.
125
Evans, J. P., Textures and deformation mechanisms and the role of fluids in cataclastically deformed granitic rocks, in Deformation mechanisms, rheology, and tectonics, edited by R. J. , Knipe and E. Rutter, Ceo/. Soc., Lond., Spec. Pub. 54, 29-39, 1990. Ferrill, D. A., Winterle, J., Willmeyer, G., Sims, D., Colton. · S., Armstrong, A .• Stressed rock strains groundwater at Yucca Mountain, Nevada, GSA Today, 9, 1-8, 1999. Fisher, Q. J. and Knipe, R. J., Fault sealing processes in siliciclastic sediments, in Fat1lting, Fault Sealing, and Fluid Flow in Hydrocarbon Reservoirs, edited by G. Jones, Q. J ., Fisher, and R. J. Knipe, Geol. Soc., Lond., Spec. Pub. 14 7, 117-134, 1998. Fleming, C. G., Couples, G. D., and Haszeldine, R. S., Thermal effects of fluid flow in steep fault zones, in Faulting, Fault Sealing, and Fluid Flow in Hydrocarbon Reservoirs, edited by G. Jones, Q. J., Fisher, and R. J. Knipe, Geol. Soc., Lond., Spec. Pub. 147, 2 17-229, 1998. Forster, C. B. and Evans, J. P., Hydrogeology of thrust faults and crystalline thrust sheets: results of combines field and modeling studies, Geophys. Res. Let., 18, 979-982, 1991. Forster, C. B., Caine, J. S., Schulz, S., and Nielson, D. L., Fault zone architecture and fluid now: an example from Dixie Valley, Nevada, Proc. 22nd Workshop on Geothermal Reservoir Eng., Stanford Univ., California, 1997. Freeze, R. A. and Cherry, J. A., Groundwater, Prentice Hall, New Jersey, 1979. Foxford, K. A., Walsh, J. J., Wallerson, J., Garden, I. R., Guscott, S. C., and Burley, S. D., Structure and content of the Moab Fault Zone, Utah, USA, and its implications for fault seal prediction, in Faulting, Fault Sealing, and Fluid Flow in Hydrocarbon Reservoirs, edited by G. Jones, Q. J ., Fisher, and R. J. Knipe, Ceo/. Soc., Lond., Spec. Pub. 14 7, 87-103, 1998. Ge, S., and Garven, G., A theoretical model for thrust-induced deep groundwater expulsion with application to the Canadian Rocky Mountains, J. Geophys Res. , 99, 13,85113,868, 1994. Goddard, J. V. and Evans, J. P., Chemical changes and fluidrock interaction in faults of crystalline thrust sheets, northwestern Wyoming, U.S.A., J. Struct. Geol., 17, 533547, 1995. Haneberg, W. C., Steady state groundwater flow across idealized faults, Water Resour. Res., 31, 1815-1820, 1995. Hickman, S., Barton, C. A., Zoback, M. D., Morin, R., Sass, J., and Benoit, R., In situ stress and fracture permeability along the Stillwater fault zone, Dixie Valley, Nevada, Int. J. Rock Mech. Min. Sci., Paper 126, 34, 1997. Hill, D. P., A model for eanhquake swarms, J. Geophys. Res., 82, 347-352, 1977. Hippler, S. 1., Deformation microstructures and diagenesis in sandstone adjacent to an extensional fault: Implications for the flow and entrapment of hydrocarbons, AAPG Bull., 77, 625-637' 1993. Jones, G., Fisher, Q. J., and Knipe, R. J., editors, Faulting, Fau lt Sealing, and Fluid Flow in Hydrocarbon Reservoirs, Geol. Soc., Lond., Spec. Pub. 147, 1998. Knipe, R. J., The influence of fault zone processes and diagenesis on fluid flow, in Diagenesis and basin development, edited by A. D. Horbury and A. G. Robinson, AAPG Studies in Geol. 36, 135-151, 1993. Knipe, R. J., J ones, G., and Fisher, Q. J., Faulting, fault
126
FAULT ZONE ARCHITECTURE AND FLUID FLOW
sealing and fluid flow in hydrocarbon reservoirs: an introduction, in Faulting, Fault Sealing, and Fluid Flow in Hydrocarbon Reservoirs, edited by G. Jones, Q. J. , Fisher, and R. J. Knipe, Geol. Soc., Lond., Spec. Pub. 147, vii-xxi, 1998. Krantz. R. L .• Frankel, A. D., Engelder, T., and Scholz, C. H. , The permeability of whole and jointed Barre granite (abstract), Int. J. Rock Mech. Min. Sci. Geomech., 16, 225-234, 1979. Long, J. C. S .• Remer, J. S., Wilson, C. R., Witherspoon, P . A., Porous media equivalents for networks of discontinuous fractures, Water Resour. Res., 18, 645-658, 1982. Long, J. C. S. and Witherspoon, P. A., The relationship of the degree of interconnection to permeability in fracture networks, J. Geophys. Res., 90, 3087-3098, 1985. Lopez, D. L. and Smith, L., Fluid flow in fault zones: Analysis of the interplay of convective circulation and topographically-driven groundwater flow , Water Resour. Res., 3 I. 1489-1503. 1995. Lopez, D. L. and Smith, L., Fluid flow in fault zones: Influence of hydraulic anisotropy and heterogeneity on the fluid flow and heat transfer regime, Water Resour. Res. , 32, 32273235, 1996. Marshak, S and Mitra, G., Basic methods of strnctura/ geology, Prentice Hall, New Jersey, 1988. Martel, S. J .• Formation of compound strike-slip fault zones, Mount Abbot quadrangle, California, J. Struct. Geol.• 12, 869-882. 1990. Mase, C. W. and Smith, L., Pore-fluid pressure and frictional heating on a fault surface, Pure Appl. Geophys .• 122, 583607, 1985. Matthlii, S. K.• Aydin, A., Pollard, D. D.• Roberts, S. G., Numerical simulation of departures from radial drawdown in a faulted sandstone reservoir with joints and deformation bands, in Faulting, Fault Sealing, and Fluid Flow in Hydrocarbon Reservoirs, edited by G. Jones, Q. 1.• Fisher, and R. J. Knipe, Geol. Soc., Lond., Spec. Pub. 147, 157-191 , 1998. McGrath, A. G., Davison, 1., Damage zone geometry around fault tips, J. Struct. Geol., 17, 1011-1024, 1995. Miller, 1., Lee, G., Dershowitz, W., and Sharp, G .• MaticTM: Matrix I fracture interaction code with solute transport: User Documentation, Version ~ 1.5, Golder Associates, Inc.• Redman, Washington, I 995. Miller, S. A., Nur, A., Olgaard, D. L., Earthquakes as a coupled shear stress-high pore pressure dynamical system, Geophys. Res. Let., 23, 197-200, 1996. Mitra, G., Ductile deformation zones and mylonites: The mechanical processes involved in the deformation of crystalline basement rocks, Am. J. Sci., 278, 1057-1084, 1978. Moore, J. C. and Vrolijk. P., Auids in accretionary prisms, Rev. Geophys.• 30, I 13-135, I 992. Morrow, C. A., Shi, L. Q., and Byerlee, J. D., Permeability and strength of San Andreas fault gouge under high pressure, Geophys. Res. Lett., 8, 325-328, 1981. Mozley, P. S. and Goodwin, L B., Patterns of cementation along a Cenozoic normal fault: A record of paleoflow orientations, Geology. 23, 539-542, 1995.
National Research Council Committee on Fracture Characterization and Fluid Flow. Rock fractures and fluid flow, National Academy Press, Washington, D.C.• 1996. Neuzil, C. E. and Tracy, J. V., Flow through fractures. Water Resour. Res., 17, 191-199, 1981. Newman, J. and Mitra, G .• Fluid-influenced deformation and recrystallization of dolomite at low temperatures along a natural fault zone, Mountain City window, Tennessee, Geol. Soc. Am. Bull., 106, 1267-1280. 1994. Nur, A., and Booker, J. R., Aftershocks caused by pore fluid flow?, Science, 175, 885-886, 1972. Parry, W. T., Hedderly-Smith, D., and Brhun, R. L., Fluid inclusions and hydrothermal alteration on the Dixie Valley Fault, Nevada, J. Geophys. Res., 96, 19,733-19,748, 1991. Parry, W. T. and Bruhn, R. L., Auid Pressure transients on scismogenic normal faults, Tectonophysics, 179. 335-344, 1990. Power, W. L. and T ullis, T. E .• The relationship between slickenside surfaces in fine-grained quartz and the seismic cycle, J. Struct. Geol., II, 879-893, 1989. Randolph, L. and Johnson, B., Influence of faults of moderate displacement on groundwater flow in the Hickory sandstone aquifer in central Texas (abstract), 23rd Ann. Meeting. Geol. Soc. Am., sowh-central Sec., 21, 242, 1989. Roberts, S. J .• Nunn, J. A., Cathles, L. M. and Cipriani, F. D., Expulsion of abnormally pressured fluids along faults, J. Geophys. Res., I 0 I, 28,23 I -28,252, 1996. Rose, P. E., Apperson, K. D.• Johnson, S .• and Adams, M. C .. Numerical simulation of a tracer test at Dixie Valley, Nevada, Proc. 22nd Workshop on Geothermal Reservoir Eng .• Stanford Univ., California, 1997. Rowley, P. D.• Cenozoic transverse zones and igneous belts in the Great Basin, western United States: Their tectonic and economic implications, in Accommodation zones and transfer zones: The regional segmentation of the Basin and Range province, edited by J. E. Faulds and J. H. Stewart, Geol. Soc. Am. Spec. Paper 323, 195-228, 1998. Schlische, R. W., Young. S. S., Ackermann, R. V.• and Gupta, A.• Geometry and scaling relations of a population of very small rift-related normal faults, Geology, 24, 683-686, 1996. Scholz, C. H.• The mechanics of earthquakes and faulting, Cambridge University Press. Cambridge, 1990. Scholz, C. H., and Anders, M. H., The permeability of faults, in The mechanical involvement of fluids in faulting, edited by S. Hickman, R. Sibson, R. Bruhn, U.S. Geol. Surv. RedBook Conf. Proc., open-file report 94-228, 247-253, 1994. Screaton, E. J., Wuthrich, D. R.• and Dreiss, S. J., Permeabilitics, fluid pressures, and flow rates in the Barbados ridge complex, J. Geophys. Res., 95, 8997-9007, 1990. Seront, B., Wong. T-f., Caine, J. S., Forster, C. B., Bruhn, R. L., and Fredrich, J. T., Laboratory characterization of hydromechanical properties of a seismogenic normal fault system, J. Struct. Geol.• 20, 865-881, 1998. Sibson, R. H., Fault rocks and fault mechanisms, J. Geol. Soc., Land., 133, 191-231, 1977. Sibson, R. H., Crustal stress, faulting, and fluid flow: in Parnell, J., Geofluids: Origin, migration, and evolution of
CAINE AND FORSTER fluids in sedimentary basins, Ceo/. Soc., Lond., Spec. Pub. 78, 69-84, 1994. Sibson, R. H., Structural permeability of flujd-driven faultfracture meshes, J. Struct. Ceo/., 18, 1031-1042, 1996. Smith, L., Forster, C. B., and Evans, J. P., Interaction between fault zones, fluid flow, and heat transfer at the basin scale, in Int. Assoc. Hydro/. Sci., Selected Papers in Hydrology, edited by S. Newman and I. Neretnieks, 2, 4 1-67, 1990. Snow, D. T., Rock fracture spacings, openings, and porosities, J. Soil Mech. Found. Div., Am. Soc. Civ. Eng., 94, 73-91, 1968. Snow, D. T., Anisotropic permeability of fractured media, Water Resour. Res., 5, 1273-1289, 1969. Vermilye, J. M. and Scholz, C. H., The process zone; an
127
analysis of naturally formed fault zones (abstract), Ann. Meeting, Ceo/. Soc. Am., Seattle, 26, 267, 1994. Witherspoon, P. A., Wang, J. S. Y., Iwru, K., Gale, J. E., Validity of cubic law for flujd flow in a deformable rock fracture, Water Resour Res., 16, 1016-1024, 1980. Zhang, X., Sanderson, D. J., Numerical modeling of the effects of fault slip on fluid flow around extensional faults, J. Struct. Ceo/., 18, 109-1 19, 1996.
J. S. Caine and C. B. Forster, Department of Geology and Geophysics, University of Utah, 135 South 1460 East, WBB 719, Salt Lake City, UT, 841 12-0111 (e-mail:
[email protected] and
[email protected])