Is a 30-Year Mortgage Preferable to a 15-Year Mortgage? Peter M. Basciano, James M. Grayson, and James Walton Better financial results accrue to some borrowers when they select a 30-year mortgage coupled with a simultaneous investment plan rather than a 15-year mortgage term and a subsequent investment plan. These results are particularly applicable in a low mortgage rate environment; however, for the vast majority of borrowers, there remains a significant probability that the 30-year mortgage is the better mortgage product even in higher mortgage rate scenarios. Further, the financial benefit associated with a 30-year mortgage increases as the borrower’s marginal tax rate and risk tolerance increase. Key Words: debt planning, home mortgage, retirement, retirement planning
Introduction Although the purchase of a home is often the largest single purchase and one of the most significant financial decisions consumers will make, Talaga and Buch (1998) reported that few homebuyers expend as much time on searching for a home mortgage as on the home search. The required payments associated with a home mortgage can result in a significant opportunity cost for the borrower with the funds required for monthly mortgage payments no longer available for other savings or consumption goals. In addition, the borrower realizes a loss of budgetary flexibility and is often exposed to a greater degree of financial or default risk. Mortgage instruments vary widely and can be very complex, and consumers have minimal guidance on this process. In fact, the advice a borrower receives on how to optimize their mortgage financing decision is oftentimes conflicting. For example, a recent working paper by Basciano (2003) concluded that the opportunity costs associated with a 15-year contracted mortgage term exceeds the realized financial benefits and suggested that the 30-year mortgage is a better financing product for a wide cross-section of borrowers. Contrary to these findings, Orman (2005) suggested that mortgage borrowers are better off accelerating their mortgage principal payments even if it involves diverting
contributions from their deferred retirement savings accounts. Given the conflicting recommendations concerning the optimal mortgage financing strategy, it is of no surprise that borrowers oftentimes are uncertain as to the “optimal strategy” and take a haphazard approach to mortgage financing. For example, Weston (1997) reported that more than half of potential homebuyers see a real estate agent before consulting a lender. In many cases, a consumer will identify a property of interest and then determine the appropriate mortgage by their ability to obtain financing, for example required coverage ratios or budgetary comfort level. Alternatively, some borrowers begin by identifying their maximum borrowing capacity given a preference for a given mortgage term and subsequently locate a property that is consistent with their borrowing capacity. The potential problem associated with either of these two common approaches stems from a failure to adequately quantify the potential opportunity costs associated with the mortgage products. The research findings presented in this paper are intended to assist financial planners in determining the “optimal strategy” that a client should use to identify the proper mortgage financing. Further, the presented results provide a framework to evaluate the “optimal strategy” across a
Peter M. Basciano, Assistant Professor of Finance, CFP® Certification Education Program Director, Augusta State University, College of Business Administration, 2500 Walton Way, Augusta, GA 30904,
[email protected], (706) 667-4535 James M. Grayson, Associate Professor of Management, Augusta State University, College of Business Administration, 2500 Walton Way, Augusta, GA 30904,
[email protected], (706) 667-4532 James Walton, Assistant Professor of Marketing, University of Houston at Victoria, School of Business Administration, 3007 N. Ben Wilson, Houston, TX 77901,
[email protected], (281) 275-3381
© 2006 Association for Financial Counseling and Planning Education. All rights of reproduction in any form reserved.
14
Financial Counseling and Planning Volume 17, Issue 1 2006
wide range of client characteristics and mortgage market conditions. Literature Review Several articles have focused on the potential benefits associated with utilizing a 30-year mortgage rather than a 15-year mortgage. Although the consensus of these articles appears to support the 30-year mortgage option, none of the results are complete. For example, Marshall (1989) and McCartney (1989) illustrated the interest savings associated with the 15-year mortgage but contended that an opportunity cost associated with the 15-year mortgage is a decrease in the borrower’s budgetary flexibility. Vrunik and Fisher (1995) indicated that the total payment difference between a 15-year and 30-year mortgage is a function of both mortgage market rates and individual tax brackets. In addition, these same factors determine a borrower’s opportunity cost for the resultant payment differential. Accordingly, the ideal situation for a 30-year mortgage is a borrower with a relatively high marginal income tax rate in a low mortgage interest rate environment. Further, the authors indicated that tax deferred savings accounts may make the 30-year mortgage even more attractive; however, no empirical results were provided. These contentions are interesting in light of the findings reported by Dhillon, Shilling, and Sirmans (1990) indicating that well-to-do individuals, the best candidates for a 30-year mortgage given their high relative marginal tax rates, are more likely to select a 15-year mortgage. Kistner (1998) extended the discussion of the benefits of a 30-year mortgage by including other potential considerations like interest, dividends, and portfolio turnover and concluded that a 30-year mortgage offers potential advantages over a 15-year mortgage. Goff and Cox (1998) investigated the benefits associated with a 30year mortgage coupled with a tax-deferred savings account. Their findings indicated that a 30-year mortgage coupled with a tax-deferred savings account provided a significant benefit over a 15-year mortgage. Tomlinson (2002) extended the discussion by introducing simulation methodology to analyze the risk associated with a 30-year mortgage with simultaneous investment account outperforming a 15-year mortgage. The results of the Tomlinson (2002) study indicated that the probability of a 30-year mortgage strategy outperforming a 15-year
15
mortgage increased with the associated investment rates of return and the time horizon considered. Basciano (2003) extended the analysis of the 30-year mortgage and simultaneous investment plan to consider various mortgage rate environments, mortgage rate spreads, marginal tax rates, and investment asset classes. These results indicated that the 30-year mortgage and simultaneous investment plan outperformed the 15-year alternative across most mortgage rate environments, marginal tax rates, and investment classes. Using a similar methodology to Tomlinson (2002), this paper extends the prior research utilizing a simulation to ascertain the degree of certainty associated with the 30year mortgage and coupled savings plan outperforming the 15-year alternative considering various portfolio allocation models, portfolio rebalancing, and transaction costs. Consistent with earlier studies, various marginal tax rates and mortgage rate environments are analyzed. Methodology The optimal decision concerning selecting between a 15year or 30-year mortgage is predicated upon an accurate calculation of the potential opportunity costs associated with the higher monthly payment of the 15-year mortgage term. The methodology employed in this paper to determine the associated opportunity costs is based upon the prior research of Goff and Cox (1998) and Basciano (2003). Specifically, a borrower is assumed to have two mortgage financing alternatives: a 15-year or 30-year mortgage term. It is assumed that an individual has the financial capacity to meet the higher monthly mortgage payment associated with the 15-year mortgage. Next, in order to evaluate the potential opportunity costs, an investment account is coupled with the 30-year mortgage. Each month, an individual would either make the required payment on the 15-year mortgage or make the 30-year mortgage payment plus an investment. The amount of the monthly investment in the coupled account is determined by the monthly mortgage payment differential: (PMT15 – PMT30) Given the tax deductibility of the mortgage interest, the incremental difference in tax savings between the two
© 2006 Association for Financial Counseling and Planning Education. All rights of reproduction in any form reserved.
(1)
30-Year Mortgage Vs. 15-Year Mortgage
financing options is determined. First, for each month (T) the incremental difference in interest is identified: (2) Interest30,T – Interest15,T; where, Interest30,T = Balance30,T * Interest Rate30 /12 Interest15,T = Balance15,T * Interest Rate15 /12 In each month, the resultant interest differential (Equation 2) is positive given the higher remaining mortgage balance at every (T) and the higher contracted interest rate associated with the 30-year mortgage. Next, the incremental tax shield (ITS) for each month (T) is determined as follows: (3) ITST = TS30,T – TS15,T; where, TS30,T = Interest30,T * tF TS15,T = Interest15,T * tF tF = the borrower’s marginal federal income tax rate Note that it is assumed that the borrower is able to itemize the mortgage interest as a deduction for income tax purposes, that he/she invests the ITS (Equation 3) each month, and that the marginal tax rate (tF) is constant over the planning period. Further, only federal income taxes are considered in this paper. If state taxes are included, the ITS in each period would be higher predicated upon the borrower’s ability to deduct mortgage interest in the determination of their state income taxes. Three marginal federal income tax rates are analyzed in this research: 15%, 25%, and 28%. In each month, the borrower is assumed to either (a) make the required payment on the 15-year mortgage or (b) make the required payment on the 30-year mortgage plus make a monthly contribution into an investment account. The monthly contribution into the investment account (MIT) is determined as follows: MIT = (PMT15 – PMT30) + ITST
(4)
In order to accurately quantify the potential benefit associated with the mortgage financing options, it is necessary to equalize the time periods under consideration. This is achieved by assuming that subsequent to paying off the 15-year mortgage, the borrower would begin to make
monthly contributions to an investment account. The amount of the monthly contribution would be equal to PMT15. Given the matched holding period, the accumulated savings under the (a) 15-year mortgage with a subsequent 15-year investment plan can be compared to (b) the 30-year mortgage with a coupled 30-year investment plan. The incremental difference between the savings accumulated under the 30-year mortgage and the savings accumulated under the 15-year mortgage is referred to as the Net Benefit (NB). A positive NB (accumulated savings under the 30-year mortgage and simultaneous investment option less the accumulated savings under the 15-year mortgage with a subsequent investment option) would indicate that a borrower obtained a financial benefit in a given scenario by taking out the 30-year mortgage with simultaneous investment as compared to the 15-year mortgage and a subsequent investment option. Conversely, a negative NB would indicate a better financial outcome associate with a 15-year mortgage alternative. In the calculation of the NB amount, assumptions are made concerning the type of investment account utilized, the current mortgage interest rate environment, the borrower’s marginal federal income tax rate, the asset allocation of the investment account, and the investment performance. The NB results presented later in the paper are based upon an initial mortgage amount of $100,000. Note that any indicated NB amounts are scalable to the initial borrowed amount. We begin by looking at five potential mortgage rate environments based on the historic levels of interest rates observed in the United States from September of 1991 through January of 2005 as reported by Freddie Mac (2006). A borrower’s mortgage payment is calculated for each rate environment using the historic mortgage rates and average interest rate spread (48 basis points) associated with the 30-year and 15-year mortgages. Next the two mortgage financing strategies described above are compared. Given that the monthly tax shield is a function of an individual’s marginal federal income tax rate, three marginal tax rates are considered: 15%, 25%, and 28%. Once the MIT is determined, it is assumed that it is invested in a tax-deferred savings account using an asset allocation model based on the borrower’s level of risk tolerance. Four asset allocation models are considered
© 2006 Association for Financial Counseling and Planning Education. All rights of reproduction in any form reserved.
16
Financial Counseling and Planning Volume 17, Issue 1 2006
Table 1. Portfolio Allocation Models and Asset Class Weights Allocation model
Small co. stock
S&P 500
LT corp bonds
LT govt bonds
IT govt bonds
Total
5%
15%
30%
20%
30%
100%
Blended
20%
30%
30%
10%
10%
100%
Growth
30%
40%
15%
5%
10%
100%
Aggressive growth
40%
45%
10%
5%
0%
100%
Conservative
ranging from “Conservative” to “Aggressive Growth.” For each asset allocation model, target investment weights are assigned to five investment categories. Table 1 presents the target weights across the four asset allocation models. On a monthly basis, the returns on each of the investment asset classes are randomly determined based on an assumed normal distribution and the respective historical means and standard deviations. To analyze the impact of portfolio rebalancing on the observed NB, annual rebalancing frequencies are considered. For each year, the portfolio is rebalanced if the observed portfolio weights are +/- 10% from the specified target weights. To incorporate transaction costs associated with purchases and sales, a 2.5% transaction fee is assumed. For each mortgage rate considered, there are 12 possible combinations of variables (3 tax rates and 4 allocation models). In addition to the selected allocation model and an individual’s marginal tax rate, the observed NB is a function of the underlying investment performance. The estimated monthly investment performance is based on an assumed normal distribution using the historical mean and standard deviation of return for each asset class as reported by Ibbotson (R. G. Ibbotson Associates, 2004). A
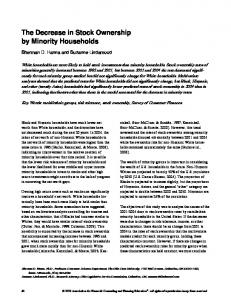
simulation is utilized to replicate the random draw of monthly returns and corresponding NB. The simulation is applied to the 12 combinations of variables across five mortgage rate environments. Results To observe the impact of the variables considered in this research upon the observed NB, the results are presented in four sections. Within each section, all of the variables are held constant with the exception of the analyzed variable. The first section reports the simulation results for the NB as a function of the various interest rate environments across the various individual tax brackets. The next section reports simulation results for the NB as a function of an individual’s marginal tax rate. The third section reports the NB as a function of the portfolio allocation models. The fourth section presents some concluding observations concerning the full set of results reported in the Appendix. Sensitivity of the NB to Changes in the Mortgage Rate Environment The results of the simulation for the NB across various mortgage interest rate environments are presented in Table 2. Five mortgage rate environments are considered corresponding to the minimum and quartile historical interest rates on a 30-year mortgage. The historic
Table 2. Sensitivity of the Net Benefit to Various Mortgage Rates 30-year mortgage rate
M of NB
SD of NB
p NB > 0
z
5.23%
$93,572
$45,850
97.97%
45.63
6.82%
$61,911
$42,956
92.49%
32.18
7.38%
$49,758
$41,733
88.34%
26.66
8.00%
$35,929
$40,410
81.30%
19.88
9.20%
$7,882
$37,781
58.26%
4.67
17
© 2006 Association for Financial Counseling and Planning Education. All rights of reproduction in any form reserved.
30-Year Mortgage Vs. 15-Year Mortgage
minimum rate is included since it closely corresponds to the current mortgage rate environment. As indicated earlier, the 15-year mortgage rate is expressed as a function of the 30-year mortgage rate by subtracting 48 basis points. The other variables are held constant to isolate the impact of the mortgage rate on the NB. Specifically, it is assumed that a individual is in a 15% marginal federal income tax bracket, uses a conservative allocation model, rebalances annually if the observed portfolio weights are +/- 10% of the target weights, and incurs 2.5% in transaction costs. It is worth noting that this scenario represents the combination of variables resulting in the lowest potential NB given the underlying relationships. All of the reported NB amounts in Table 2 are based on an assumed mortgage amount of $100,000. Note that all of the reported NB amounts are scalable to the initial mortgage. As illustrated in Table 2, the NB is negatively related to mortgage interest rates. However, the results indicate that even in a historically high interest rate environment, for individuals with a conservative investment allocation subject to a low marginal tax rate (15%), the 30-year mortgage coupled with an investment account significantly outperforms the 15- year alternative as indicated by the reported z-values. Of further interest is the probability associated with a positive NB. For our hypothetical
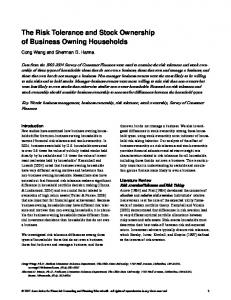
borrower is assumed to have a conservative portfolio allocation, rebalances annually if the observed portfolio weights are +/- 10% of the target weights, incurs 2.5% transaction costs, and borrows $100,000. In this section, the mortgage interest rate is held constant at 9.2%. Given the negative relationship between mortgage rates and NB reported earlier, the resultant NB amounts should represent the least optimal mortgage rate environment for the 30year mortgage strategy. The resulting NB amounts across the three marginal federal income tax brackets are reported in Table 3. Recall that on a monthly basis, an individual pursuing the 30-year strategy would invest the monthly payment differential plus any differential in the tax shield between the two mortgage alternatives. Given that the tax shield is a function of interest and the borrower’s marginal tax rate, it is of no surprise that a positive relationship is observed between the NB and the borrower’s marginal tax rate. As indicated in Table 3, the 30-year mortgage alternative outperforms the 15-year alternative across all three tax rates considered. Further, the probability that the 30-year provides positive NB ranges from a low of approximately 58% for individuals subject to the lowest marginal tax rate to over 97% for individuals subject to a 28% marginal tax rate. All of the reported mean NB amounts are statistically greater than zero well beyond the 1% confidence level. Although not reported in this paper, the same relationships
Table 3. Sensitivity of the Net Benefit to Various Marginal Federal Income Tax Rates Marginal federal income tax rate
M of NB
SD of NB
p NB > 0
z
15%
$7,882
$37,781
58.26%
4.67
25%
$76,874
$47,324
94.79%
36.32
28%
$97,524
$50,407
97.35%
43.26
borrowers, even in the highest mortgage rate environment, they would still have an approximately 58% probability that the NB associated with the 30-year mortgage alternative is positive. Sensitivity of the NB to Marginal Income Tax Rates Consistent with the methodology applied in the first section, all of the variables are held constant with the exception of the marginal tax rate. For comparability, a
hold for individuals subject to marginal tax rates in excess of 28%. Sensitivity of the NB to the Portfolio Allocation Model In this section of results, all of the variables are held constant with the exception of the selected portfolio allocation model. We now assume that a borrower will couple the 30-year mortgage with one of four portfolio
© 2006 Association for Financial Counseling and Planning Education. All rights of reproduction in any form reserved.
18
Financial Counseling and Planning Volume 17, Issue 1 2006
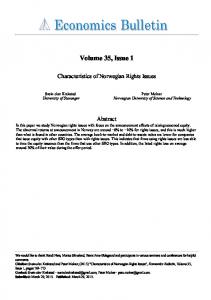
Table 4. Sensitivity of the Net Benefit to the Portfolio Allocation Model Portfolio allocation model
M of NB
SD of NB
$7,882
$37,781
58.26%
4.67
Blended
$117,715
$142,392
79.58%
18.49
Growth
$239,729
$296,204
79.08%
18.10
Aggressive growth
$389,999
$540,692
76.46%
16.13
Conservative
allocation models. The various allocation models and their respective asset class weightings are indicated in Table 1. For comparability with the earlier results, we again assume that the investor is subject to a 15% marginal tax rate, borrows $100,000, has a 9.2% interest rate on a 30-year mortgage, rebalances the portfolio annually with a 10% rebalancing condition, and incurs 2.5% transaction costs. The resulting NB amounts are reported in Table 4. Obviously, the selection of a portfolio allocation model has a significant impact upon both the potential risk and return associated with the NB. The selection of a more conservative portfolio allocation model will result in considerably less risk exposure but a lower mean NB. Conversely, at the other extreme, an aggressive growth portfolio allocation model has considerably more risk but a much greater mean NB. This tradeoff between risk and return is illustrated by the probability associated with the 30-year alternative outperforming the 15-year alternative. With the exception of the results associated with the conservative portfolio allocation model, the probability of a positive NB decreases as the weight invested in riskier investment options increases. As would be expected given the underlying relationship between risk and return, the loss in probability associated with a positive NB is associated with an increasing mean NB. The full set of results presented in the Appendix is consistent with the underlying relationship between risk (probability of a positive NB) and return (mean NB). In general, whether or not an individual should select one option over the other would depend on the borrower’s risk tolerance. The seemingly anomalous result reported in Table 4 associated with the conservative allocation model is explained by the low level of return coupled with the least
19
p NB > 0
z
favorable combination of variables: mortgage rate and marginal tax rate. As indicated in Table 3, the probability of the 30-year alternative outperforming the 15-year alternative is in excess of 58% across all considered portfolio allocation models. All of the reported mean NB amounts are significantly greater than zero, well beyond a 1% confidence level. Additional Results and Comments on Appendix The results presented in this paper indicate that the NB is a function of the mortgage interest rate, the marginal tax rate of the borrower, and the selected portfolio allocation model. As indicated in the earlier sections, there is a negative relationship between the NB and contracted mortgage rate, a positive relationship between the NB and the marginal tax rate, and a positive relationship between the NB and the risk level of the selected investment options (portfolio allocation model). In summary, the lowest NB would correspond to a scenario involving a high mortgage rate environment, a low marginal tax rate, and a conservative investment allocation model. This scenario corresponds to the base case presented in the prior three sections. Obviously this combination of variables corresponds to a limited number of potential borrowers and market conditions. The question remains how the 30year mortgage strategy compares to the 15-year alternative given deviations from this limited base case combination of variables. The full set of results presented in the Appendix confirms that the 30-year option provides a positive NB across the remaining variable combinations with a high degree of certainty. For example, the best-case scenarios corresponding to the maximum observed NB amounts for the 30-year alternative are presented in the Appendix. The best case is represented by the minimum interest rate environment (5.23%) and a borrower subject to a high marginal tax rate (28%). Depending on the risk tolerance of the individual,
© 2006 Association for Financial Counseling and Planning Education. All rights of reproduction in any form reserved.
30-Year Mortgage Vs. 15-Year Mortgage
the mean NB ranges from $142,497 (conservative portfolio allocation) to $698,622 (aggressive growth portfolio allocation). Given this combination of factors, the individual would need to assess whether the potentially higher mean NB (return) is worth the loss in probability of experiencing a positive NB (risk). For example, an individual selecting a conservative portfolio allocation model would have nearly a 100% probability of a positive NB; whereas, the probability decreases to approximately 83% if he/she selects an aggressive portfolio allocation model. Conclusions The results in the Appendix corresponding to the 5.23% mortgage rate environment closely resemble the 2005/2006 mortgage market. Given the indicated NB, there is little question as to which mortgage product is currently optimal across a wide range of borrower and market characteristics. Even in the scenario involving the least optimal combination of variables (lowest marginal tax rate, conservative allocation model), there is close to a 100% probability that the 30-year alternative results in a positive NB. As expected, as the borrower’s marginal tax rate increases, the probability of the 30-year mortgage alternative outperforming the 15-year alternative increases and the observed mean NB increases. Further, as the level of risk associated with the portfolio allocation model increases, the mean NB increases but the probability associated with experiencing a positive NB decreases. Even in the most uncertain case representing a borrower with a low marginal federal income tax rate and an aggressive portfolio allocation model, there is over an 80% probability that the 30-year alternative will outperform the 15-year alternative with a minimum mean NB of $573,823. As interest rates increase, both the mean NB and probability associated with the 30-year alternative outperforming the 15-year alternative will decrease. However, as the results in the Appendix indicate, even in a scenario corresponding to the historical high contract interest rates on the 30-year mortgage, the 30-year alternative will remain the optimal strategy across a wide range of borrower and market conditions. It is worth repeating that in the scenarios involving high mortgage rates and a borrower subject to a low marginal federal income tax rate, both the mean NB and probability of the
30-year alternative outperforming the 15-year alternative decrease. However, as indicated earlier, there would still remain approximately a 58% probability of the 30-year alternative resulting in a positive NB. In this paper, the borrower’s marginal federal income tax rate is held constant for the entire planning period (30 years). In the case of the lowest marginal tax rate, this assumption assumes that the borrower’s income will not increase over the 30-year period sufficiently enough to move the borrower into higher marginal tax brackets. It is also assumed that no changes are made to the prevailing marginal tax rates. If the marginal tax rates were to increase in the future, the reported NB amounts are understated. Further, it is important to note that the simulation applied in this paper assumed a normal distribution based on the historic mean and standard deviation of the various considered investments. Obviously, future capital market performance may differ from the assumed historical means and standard deviations. At this point, it is also worthwhile to comment on a few practical limitations associated with pursuing the 30-year alternative. It is assumed that on a monthly basis the individual will invest the payment differential between the mortgage payments plus any differential in the mortgage tax shields in a tax deferred account. Obviously this assumes two critical components: (a) that the individual has access to tax deferred accounts and (b) that the individual will have the financial discipline to follow the strategy for the full term of the mortgage. Although for most individuals the first assumption should not present much of a practical problem, the second assumption may be tenuous! In general the 30-year strategy analyzed in this research is very similar to the “buy term and invest the rest” insurance strategy and as such has similar practical pitfalls. It is also important to note that, in the case of the 15-year mortgage with a subsequent investment option, the assumption of available tax deferred accounts becomes more problematic. In summary, the 30-year alternative appears to be the best option in a low mortgage rate environment and will continue to be the better option for the vast majority of borrowers as mortgage rates increase. Most critically, this conclusion is predicated upon an assumption that the individual exercises the required financial discipline. The one possible exception to this general observation involves
© 2006 Association for Financial Counseling and Planning Education. All rights of reproduction in any form reserved.
20
Financial Counseling and Planning Volume 17, Issue 1 2006
an individual subject to a low marginal tax rate, in a high interest rate environment, and would opt to select a conservative portfolio allocation model. However, even under this less than optimal combination of variables, there would still remain approximately a 58% probability that the 30-year strategy would outperform the 15-year mortgage combined with a subsequent investment. References Basciano, P. (2003). The 30-year mortgage: A potential source of retirement funding. Unpublished working paper. Dhillon, U., Shilling, D., & Sirmans, C. (1990). The mortgage maturity decision: The choice between 15year and 30-year FRMs. Southern Economic Journal, 56(4). 1103-1116. Freddie Mac. (2006). Historical PMMS data. Retrieved from http://www.freddiemac.com/dlink/html/PMMS/ display/PMMSOutputYr.jsp?year=2006 Goff, D., & Cox, R. (1998). 15-year versus 30-year mortgage: Which is the better option? Journal of Financial Planning, 11(2), 88-95. Kistner, W. (1998). Home mortgage loan term options. Healthcare Financial Management, 52(10), 86-88. Marshall, P. (1989, January). Help buyers make the right mortgage wish. Real Estate Today, pp. 56-61. McCartney, L. (1989, July/August). 15- vs. 30-year mortgages. Consumers Digest, pp. 66-67. Orman, S. (2005). Home in on a stress free retirement. Retrieved February 7, 2005, from http:// biz.yahoo.com/pfg/ e26retire/art011.html R. G. Ibbotson Associates. (2004). Stocks, bonds, bills and inflation, 2004 yearbook. Chicago: Ibbotson Associates. Talaga, J., & Buch, J. (1998). Consumer trade-offs among mortgage instrument variables. International Journal of Bank Marketing, 16(6), 264-270. Tomlinson, J. (2002). Advising investment clients about mortgage debt. Journal of Financial Planning, 15, 100-108. Vrunik, D., & Fisher, D. (1995). The effects of income tax rates and interest rates in choosing between 15- and 30-year mortgages. The CPA Journal, 65(11), 72-75. Weston, E. (1997). All mortgages are not alike. Mortgage Banking, 58(1), 141-147.
21
© 2006 Association for Financial Counseling and Planning Education. All rights of reproduction in any form reserved.