Radiology
Technical Developments Thomas K. F. Foo, PhD Vincent B. Ho, MD Manojkumar Saranathan, PhD Liu-quan Cheng, MD Hajime Sakuma, MD Dara L. Kraitchman, DVM, PhD Katherine C. Wu, MD David A. Bluemke, MD, PhD Published online 10.1148/radiol.2353040090 Radiology 2005; 235:1025–1030 Abbreviations: CNR ⫽ contrast-to-noise ratio LAD ⫽ left anterior descending LCX ⫽ left circumflex RCA ⫽ right coronary artery SNR ⫽ signal-to-noise ratio 3D ⫽ three-dimensional 1
From the Applied Science Laboratory, GE Healthcare Technologies, Room 110MRI, 600 N Wolfe St, Baltimore, MD 21287 (T.K.F.F., M.S.); Dept of Radiology and Radiological Sciences, Uniformed Services Univ of the Health Sciences, Bethesda, Md (V.B.H.); Dept of Radiology, Chinese PLA General Hosp, Beijing, China (L.C.); Dept of Radiology, Mie Univ, Tsu, Japan (H.S.); and Dept of Radiology (D.L.K., D.A.B.) and Div of Cardiology (K.C.W.), Johns Hopkins Univ, Baltimore, Md. Received Jan 19, 2004; revision requested Mar 19; final revision received Aug 9; accepted Sep 2. Research grant by GE Healthcare Technologies (V.B.H.) and Bracco Diagnostics (V.B.H., D.A.B.). Address correspondence to T.K.F.F. (e-mail:
[email protected]). See Materials and Methods for pertinent disclosures. The opinions and/or assertions contained herein are the private views of the authors and are not to be construed as official or reflecting the views of the Uniformed Services University of the Health Sciences or the Department of Defense. Author contributions: Guarantor of integrity of entire study, T.K.F.F.; study concepts, T.K.F.F., V.B.H., D.A.B.; study design, T.K.F.F., V.B.H., D.A.B., M.S.; literature research, T.K.F.F.; clinical studies, T.K.F.F., L.C., H.S., K.C.W., D.A.B., V.B.H.; experimental studies, D.L.K., T.K.F.F., M.S.; data acquisition, T.K.F.F., L.C., H.S., K.C.W., D.A.B., V.B.H., D.L.K.; data analysis/interpretation, T.K.F.F., V.B.H., D.A.B.; statistical analysis, T.K.F.F.; manuscript preparation, definition of intellectual content, editing, revision/review, and final version approval, T.K.F.F., V.B.H., D.A.B.
©
RSNA, 2005
Feasibility of Integrating High-Spatial-Resolution 3D Breath-hold Coronary MR Angiography with Myocardial Perfusion and Viability Examinations1 The study was institutional review board approved and Health Insurance Portability and Accountability Act compliant. All subjects provided informed consent. Three-dimensional breath-hold coronary magnetic resonance (MR) angiography with use of steady-state free precession was performed in 12 patients up to 20 minutes after 0.2 mmol gadolinium-based contrast material per kilogram of body weight was administered. Within 24 heartbeats, a spatial resolution of up to 1.0 ⫻ 1.2 ⫻ 2.0 mm was achieved. Sixty-five (82%) of the 79 visualized coronary artery segments had a grade of 3 or 4 on a four-point scale of depiction in which grade 4 indicated excellent depiction. Twenty-seven percent (n ⫽ 21) of the 79 segments were assigned a grade of 4; 56% (n ⫽ 44), a grade of 3; 16% (n ⫽ 13), a grade of 2; and 1% (n ⫽ 1), a grade of 1. Coronary MR angiography performed as part of a first-pass myocardial perfusion and viability assessment MR imaging examination is feasible and does not involve additional imaging time. ©
RSNA, 2005
Three-dimensional (3D) breath-hold coronary magnetic resonance (MR) angiography (1–5) has substantial advantages in terms of time efficiency compared with free-breathing navigator MR imaging of coronary arteries (5– 8). With current 3Dvolume coronary MR angiography tech-
niques, short imaging times for breathhold acquisitions can be achieved but at the expense of spatial resolution. To reduce imaging time requirements, these techniques typically involve segmentation of the linear k-space trajectory by dividing the number of phase-encoding steps per segment such that three heartbeats (or cardiac R-R intervals) per section are required to yield temporal acquisition windows of 120 –150 msec per section. Consequently, the section thickness is fairly thick (3.0 mm) for a typical coronary MR angiographic acquisition because adequate spatial coverage (20 –30-mm thickness) during a single breath hold limits the number of sections to six to eight (3,9). An increasingly important cardiac MR imaging examination is that performed to assess myocardial viability (10 –12). To maximize the information derived from this examination, first-pass myocardial perfusion MR imaging is typically performed during the gadolinium chelate contrast material delivery. Subsequently, there is an interval of 10 –20 minutes between the administration of the contrast material and the delayed-enhancement (ie, viability) examination. It would be useful to conduct a coronary artery examination during this interval to maximize the use of the imaging time. A coronary MR angiography examination could yield knowledge about the diseased vessel to complement the information derived from the myocardial perfusion and delayed-enhancement (viability) MR imaging studies. For example, on coronary MR angiograms, one could delineate the approximate location of the culprit lesion in an ischemic myocardial territory or construct a suitable preproce1025
Radiology
dural planning “road map.” Coronary MR angiography findings could also provide advance warning of the presence of an aberrant coronary anatomy before further interventional procedures are performed. Thus, the objective of this study was to determine the feasibility of integrating a coronary MR angiography examination with first-pass myocardial perfusion and viability MR imaging examinations.
Materials and Methods For this pilot evaluation, 12 consecutive patients (11 men, one woman; mean age, 60 years ⫾ 19 [standard deviation]; age range, 22– 80 years; mean weight, 72 kg ⫾ 15) who were already scheduled to undergo myocardial viability MR imaging were enrolled. Participation in this study was voluntary, and all subjects provided informed consent. The study was performed in accordance with the human-use guidelines of the participating institutions: It was approved by the institutional review boards of Uniformed Services University of the Health Sciences and Johns Hopkins University or performed according to the local ethics guidelines of Chinese PLA General Hospital and Mie University. The study was also Health Insurance Portability and Accountability Act compliant. D.A.B. is a paid consultant for GE Healthcare Biosciences. Acquisition Strategy We used an acquisition strategy that allows imaging of a moderately thick slab— between 24 and 28 mm—with section thicknesses of between 2.0 and 2.4 mm. This strategy involves the use of a 3D, electrocardiographically gated, breathhold acquisition with steady-state free precession (by using steady-state free precession or fast imaging employing steady-state acquisition techniques) with fat suppression. No additional magnetization preparation (eg, T2 preparation or IR preparation) was used. Unlike conventional gradient-recalled-echo MR angiography, which requires image acquisition during the first pass of contrast material for maximal contrast enhancement, this acquisition technique enables us to exploit the persistent gadolinium chelate–induced contrast enhancement achieved with fast imaging employing steady-state acquisition pulse sequences for an improved vessel image signal-to-noise ratio (SNR) several minutes after the first pass of the contrast material bolus (13). 1026
䡠
Radiology
䡠
June 2005
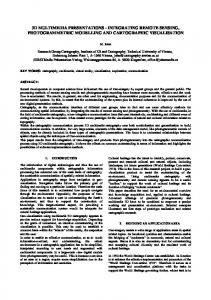
Figure 1. Diagram of pulse sequence illustrates the relative positions of the spectrally selective inversion radiofrequency (rf) pulse phase, the dummy excitation and half ␣ (␣/2)-half repetition time (TR/2) phases, and the data acquisition phase. Two imaging segments per section-encoding view are carried out, with the central k-space views acquired in a smaller temporal window than the higher k-space views. The preparation segment was used to accelerate the approach to steady state and minimize signal intensity variations during data acquisition. kr ⫽ spatial frequency encoding views.
To complete the acquisition within a short breath hold, a variable temporal sampling scheme (14) was used to divide the acquisition into two R-R intervals per section-encoding partition. This scheme has already been successfully used for the assessment of myocardial viability with a 3D sequence (14,15). Hence, for a 12section acquisition volume, 24 heartbeats were needed to complete the data acquisition. With such a small acquisition slab thickness, targeted volume acquisitions (1,2) were made for each coronary artery vessel. The pulse sequence that we used is illustrated in Figure 1, which shows the relative position of the spectrally selective inversion radiofrequency pulse (16) with respect to the MR imaging sequence for fat suppression. A half ␣– half repetition time prepulse followed by 20 dummy radiofrequency excitations was also used to accelerate the approach to the steady state (17). Because the acquisitions were contrast material enhanced, no additional magnetization preparation schemes were used (18). To further reduce the total imaging time, a partialFourier (with 0.5 signal acquired) acquisition with 20 overscans were used. The overscan region was defined as the number of additional k-space views in the conjugate k-space region that was acquired to provide an estimate of the lowspatial-frequency phase for partial-Fourier (ie, homodyne) image reconstruction (19). Imaging Protocol All MR imaging experiments were conducted by using 1.5-T CV/i or TwinSpeed imaging units (GE Medical Systems,
Waukesha, Wis) equipped with high-performance gradient systems (40 –50 mT/m and 150 T/m/sec). For the patient examinations, an initial first-pass myocardial perfusion MR imaging examination, with six to nine sections acquired every two R-R intervals (20), was performed by using 0.1 mmol gadolinium chelate contrast material per kilogram of body weight followed by a second 0.1 mmol/kg dose of the agent. This protocol yielded a cumulative 0.2 mmol/kg dose of gadolinium chelate contrast material that was administered as part of the myocardial viability assessment. No imaging was conducted during the second contrast material injection. The time between the two injections was the time required for myocardial perfusion MR imaging, which lasted approximately 1–2 minutes. After myocardial perfusion MR imaging, targeted-volume 3D coronary artery examinations of as many coronary artery vessels (right coronary artery [RCA] and left main [LM], left anterior descending [LAD], and left circumflex [LCX] arteries) as possible were performed before the start of the delayed-enhancement (viability) study. Imaging planes were optimized for visualization of the longest proximal length of each vessel. Because all subjects had initially been referred for the clinical assessment of myocardial viability, the initiation of viability MR imaging limited the time that was available for coronary artery imaging to 15–20 minutes, and in some patients, this amount of time did not allow the imaging of all coronary arteries. In nine of the 12 patients examined, a precontrast 3D breath-hold acquisition of the RCA also was performed. This enabled us to meaFoo et al
Qualitative Vessel Segment Depiction Grades
Radiology
Vessel Segment
No. of Visualized Segments*
Mean Grade†
Visualized Segments with Diagnostic and Good Image Quality (%)‡
11/11 11/11 11/11 10/10
3.7 ⫾ 0.5 3.5 ⫾ 0.4 3.0 ⫾ 0.9 3.4 ⫾ 0.5
91 (10/11) 100 (11/11) 73 (8/11) 90 (9/10)
10/10 8/10 2/10
3.2 ⫾ 0.4 2.9 ⫾ 0.7 2.5 ⫾ 0.7
90 (9/10) 63 (5/8) 50 (1/2)
10/10 5/10 1/10
3.1 ⫾ 0.6 2.7 ⫾ 0.7 3.0
80 (8/10) 60 (3/5) (100) (1/1)
RCA Proximal Middle Distal LM artery LAD artery Proximal Middle Distal LCX artery Proximal Middle Distal
* Number of vessel segments visualized/total number of segments. † Mean qualitative vessel depiction grades (⫾ standard deviation) assigned by two independent observers and tabulated as a function of specific coronary artery vessel segments. Grades were assigned by using a scale of 1– 4. ‡ Vessels assigned a score of 3 or higher were considered to be diagnostic and of good image quality. The RCAs and the LM arteries were well depicted in all cases, whereas only the proximal LAD and proximal LCX arteries were consistently well visualized with an acceptable qualitative grade. Numbers in parentheses are the numbers of segments used to calculate the percentages.
sure the vessel SNR and the vessel contrast-to-noise ratio (CNR) before and after contrast material administration so that we could assess the advantages of imaging the coronary arteries after the firstpass perfusion examination. The RCA was chosen for these measurements because it was the most consistently visualized vessel. Imaging parameters were as follows: 3.9 – 4.7/1.5–1.9 (repetition time msec/ echo time msec), a 24 –28-cm field of view, a 2.0 –2.4-mm section thickness interpolated to 1.0 –1.2 mm, 10 –12 acquired sections, a 256 ⫻ 192 to 256 ⫻ 224 acquisition matrix, and a 65° flip angle. This protocol yielded acquired voxel spatial resolutions of 0.9 –1.0 ⫻ 1.1–1.3 ⫻ 2.0 –2.4 mm. The imaging time was 20 or 24 heartbeats (two heartbeats per acquired section), respectively, depending on whether 10 or 12 sections were selected. The mean breath-hold duration for the acquisition of 12 sections was 22 seconds ⫾ 5 (standard deviation), with the imaging time varying according to patient heart rate. Image Evaluation and Statistical Analyses The acquired images were independently assessed by two radiologists experienced in cardiac MR imaging (D.A.B. and V.B.H., with 9 and 11 years experience, respectively). The radiologists graded each depicted coronary artery segment (proximal, middle, and distal) by using a four-point depiction scale: Grade 1 indiVolume 235
䡠
Number 3
cated poor depiction—that is, the coronary vessel was barely seen or was obscured by noise; grade 2, marginal depiction—that is, the vessel was visible, but confidence in the diagnosis was low; grade 3, good depiction—that is, the vessel was adequately visualized, with confidence in the diagnosis; and grade 4, excellent depiction—that is, the vessel was well visualized. The readers were blinded to the patients’ medical histories, other MR image data (ie, perfusion and delayed-enhancement examination results), and conventional coronary angiography results. Each coronary artery segment was defined as a 3-cm vessel segment. Qualitative vessel grades of 3 and 4 were deemed to be diagnostic. Although each set of vessel segments was from the same coronary artery, the individual segments were in different spatial locations and had different orientations and flow-gradient interactions. Thus, we considered the segments to be separate vessels and did not deem that there was any clustering of data that necessitated different statistical analysis. Vessel SNRs and CNRs were also measured in the proximal RCAs before and after contrast material administration. Paired t test analysis (two-tailed, with two samples for means) of the vessel SNR and CNR data was performed by using computer software (Excel 2000; Microsoft, Redmond, Wash). Vessel SNR was defined as follows: SNR ⫽ SIm/SDa, as measured in a small region of interest, where SIm is the mean vessel signal intensity and SDa is the standard deviation in a
region of interest measured in air. Vessel CNR was defined as follows: CNR ⫽ 100 ⫻ [(SIm ⫺ SIb)/(SIm⫻ SDa)], where SIb is the signal intensity of the adjacent background tissue. Assessment of interreader correlations was performed by using the Cohen test (MEDCALC 7.4; MedCalc Software, Mariakerke, Belgium). Coronary artery vessel lengths were measured in each subject, and the mean lengths were calculated (by T.K.F.F.).
Results Images of 11 RCAs and 10 LAD, 10 LM, and 10 LCX arteries were acquired. With each major coronary artery divided into three segments (proximal, middle, and distal), with the exception that the LM coronary artery was evaluated as a single vessel segment, a total of 103 segments possibly could have been visualized. Of the 103 vessel segments that could be visualized, 79 were visualized, and the mean grade was 3 or 4 for 29 of 33 “possible” RCA segments, for 15 of 30 possible LAD artery segments (with 10 of 30 segments not seen), for nine of 10 possible LM artery segments, and for 12 of 30 possible LCX artery segments (with 14 of 30 segments not seen). Thus, the majority (65 of 79 [82%]) of all vessel segments observed were noted to have a qualitative grade of 3 or 4: 29 (88%) of 33 visible RCA segments, nine (90%) of 10 visible LM artery segments, 15 (75%) of 20 visible LAD artery segments, and 12 (75%) of 16 visible LCX artery segments. The overall results, with the grades averaged for the two observers, are summarized in the Table. Of all 79 visualized segments, 21 (27%) were assigned a grade of 4; 44 (56%), a grade of 3; 13 (16%), a grade of 2; and 1 (1%), a grade of 1. When the data were evaluated by using statistics, the value for the correlation of findings between the two readers was 0.60, indicating moderate agreement. As noted in the Table, all RCA segments and the LM coronary artery were assigned a mean grade of 3 or higher. In addition, the proximal segments of the LAD and LCX arteries were also deemed to be evaluable and of good image quality. The middle and distal segments of the LAD and LCX arteries were not as well visualized and had mean depiction grades of between 2 and 3. Of all 103 possible segments, 24 (mostly distal LAD and LCX segments) were not visualized. Image SNRs were compared between the pre- and postcontrast MR images obtained in nine subjects. The postcontrast coronary artery images exhibited a mean
Coronary Artery and Myocardial Assessment MR Imaging
䡠
1027
Radiology
improvement in SNR of 150% ⫾ 29 (P ⬍ .002), despite being obtained at a substantial delay after the first pass of the contrast material bolus. The mean time after the second contrast material injection (yielding a cumulative dose of 0.2 mmol/kg) for the SNR measurements was 9 minutes ⫾ 4. Pre- and postcontrast MR images (single 2.0-mm sections) obtained in the same patient are shown in Figure 2. Note that the suppression of signal in the myocardium, which was comparable between the pre- and postcontrast images, was due to the high flip angle used in the experiments. The postcontrast image exhibited a mean improvement in CNR of 115% ⫾ 27 (P ⬍ .18). When we measured vessel lengths by using the reformatted 3D volume acquisitions, a mean of 102 mm ⫾ 16 of the RCA was visualized. The mean lengths of the other vessels visualized were 18 mm ⫾ 3 of the LM coronary artery, 56 mm ⫾ 15 of the LAD coronary artery, and 45 mm ⫾ 17 of the LCX coronary artery. These measured lengths were consistent with those reported in other studies (2,3,6,7).
Discussion Our study results demonstrate the possibility of using 3D coronary MR angiography in combination with myocardial perfusion and delayed-enhancement (viability) MR imaging examinations. As shown in Figure 3, a first-pass perfusion study, a delayed-enhancement study, and visualization of the coronary arteries (LCX artery and RCA in Fig 3) can be completed during a single examination owing to the short imaging times that are possible with 3D breath-hold coronary MR angiography performed by using a variable temporal sampling scheme. With use of the proposed acquisition technique, 82% of the visible coronary artery segments were determined to be of sufficiently high image quality for diagnosis. However, 63% of all possible segments (including visualized and nonvisualized segments) were evaluable (grade ⱖ 3). Note that in prior studies (6,7), only the visible segments were considered in the assessment of the diagnostic effectiveness of coronary MR angiography (ie, in terms of percentage of diagnostic segments). The nonvisualized segments were primarily distal LCX and distal LAD coronary artery segments. This limited visualization probably was due to the fact that the positioning of the imaging planes was targeted for imaging the proximal coronary artery segments and thus not 1028
䡠
Radiology
䡠
June 2005
Figure 2. Single 2.0-mm MR images (4.7/1.9, 26-cm field of view, 256 ⫻ 224 matrix, 1.0 ⫻ 1.1 ⫻ 2.0-mm acquired voxels) obtained from (a) precontrast and (b) postcontrast 3D volume acquisitions (12 sections) in 60-year-old man. Each volume was acquired during a 19-second breath hold (heart rate, 75 beats per minute). Vessel SNR in the RCA (arrow) increased from 48 before to 80 after a cumulative 0.2 mmol/kg dose of gadolinium-based contrast material was administered. This represented a 1.6-fold increase in vessel SNR approximately 5 minutes after contrast material administration (ie, after second 0.10 mmol/kg injection).
optimal for visualization of the distal coronary artery segments. The use of thicker sections would have improved anatomic coverage and potentially facilitated an increase in the number of evaluable segments. Because high-spatial-resolution MR imaging was desired, however, thicker section thicknesses were not used. Furthermore, the research protocol required the acquisition of delayed-enhancement MR images (for the viability study) 20 minutes after the perfusion examination, and this limited the time that was available for coronary artery imaging. Additional imaging of the coronary arteries could have been performed after the delayed-enhancement examination and thus potentially facilitated an increased number of evaluable segments; however, this approach was not used in the current feasibility study. Our study results are consistent with those of earlier reported clinical studies (6,7). On the basis of our qualitative evaluations, the percentage of evaluable segments was comparable to the percentages reported with use of free-breathing acquisitions (6,7) but at a substantial reduction in imaging time. The ability to image each coronary artery during a single breath hold allows all three major coronary vessels (RCA and LM, LAD, and LCX arteries) to be imaged within three to four breath holds, and this capability is an advantage for incorporating coronary artery visualization into a comprehensive cardiac examination. The administration
of contrast material improved the vessel SNR to 150% of the precontrast image SNR within 20 –30 minutes after the initial contrast agent bolus injection. In the patients enrolled in this study, only two R-R cardiac intervals per section were used. In patients with higher heart rates (⬎80 beats per minute), segmentation into three R-R intervals per section can be used. This will reduce the temporal acquisition window in patients with high heart rates while permitting the imaging time to remain at less than 27 seconds. With this approach, higher heart rates will result in shorter imaging times, and, thus, increasing the segmentation will not adversely affect the breath-hold period. There were several limitations to the described MR image acquisition approach. Although 24 heartbeats may constitute a short breath-hold period, it may be challenging for—and even beyond the capability of—some patients, especially those with compromised pulmonary function. For patients who are unable to maintain a 20 –24-second breath hold, parallel imaging techniques (21–23) can be used. Parallel imaging allows reduction of the breath hold period by a factor of two or greater. Alternatively, if the breath-hold period can be maintained, higher spatial resolution can be achieved. This permits the acquisition of submillimeter in-plane– spatial-resolution images during a 20 –24second breath hold. With use of short imaging times, the performance of freeFoo et al
Radiology Figure 3. MR images obtained in 58-year-old man show results of (a) first-pass myocardial perfusion imaging combined with (b, c) 3D targeted breath-hold coronary MR angiography and (d) delayed-enhancement (viability assessment) imaging during a single examination (4.6/1.8, 26-cm field of view, 12 2.4-mm sections interpolated to 24 1.2-mm sections, 256 ⫻ 224 matrix, spatial resolution of 1.10 ⫻ 1.16 ⫻ 2.4 mm, acquisition completed during 21-second breath hold at heart rate of 70 beats per minute). (a) At-rest perfusion images show low-enhancing regions (arrows) indicative of a regional perfusion deficit. (b, c) Multiplanar reformations of the LCX artery (arrow) (b) and the RCA (arrow) (c) were obtained before the myocardial viability examination. (d) Three-dimensional delayed-enhancement images acquired during a single breath hold show highenhancing areas (arrows) indicative of myocardial infarction that correspond to the regions of perfusion deficit in a.
breathing navigator techniques can be improved. Applying parallel imaging further reduces the image acquisition time. Higher spatial resolution navigator-gated MR images can then be acquired by using the proposed 3D steady-state free precession acquisition technique in less than 3 minutes (using a conservative assumption of 10%–20% efficiency), as compared with the 10 –15-minute acquisition time required in other reported freebreathing navigator studies (5–7). Because our study involved the use of a small sample size, it was not a definitive assessment of the sensitivity and specificity of the described approach for assessment of coronary artery disease. Thus, a much larger study with conventional anVolume 235
䡠
Number 3
giographic correlation in each patient is needed. In conclusion, 3D coronary MR angiography performed in combination with first-pass myocardial perfusion and viability assessments is feasible. With use of a variable temporal sampling scheme, acquisition times (ie, breath-hold times) are short (24 seconds) and SNRs are significantly improved, compared with the acquisition times required and SNRs achieved with precontrast MR imaging. The described technique is most suitable for assessment of proximal and middle coronary artery segments. Thus, it seems feasible to complete a cardiac MR imaging examination that facilitates myocardial perfusion, myocardial viability, and
proximal and middle coronary artery vessel assessments within 30 – 45 minutes. References 1. Wielopolski PA, van Geuns RJ, de Feyter PJ, Oudkerk M. Breath-hold coronary MR angiography with volume-targeted imaging. Radiology 1998; 209:209 –219. 2. van Geuns RJ, Wielopolski PA, Wardeh AJ, de Bruin HG, Oudkerk M, de Feyter PJ. Volume coronary angiography using targeted scans (VCATS): a new strategy in MR coronary angiography. Int J Cardiovasc Imaging 2001; 17:405– 410. 3. Li D, Carr JC, Shea SM, et al. Coronary arteries: magnetization-prepared contrastenhanced three-dimensional volume-targeted breath-hold MR angiography. Radiology 2001; 219:270 –277. 4. Deshpande VS, Shea SM, Laub G, Simonetti OP, Finn JP, Li D. 3D magnetizationprepared true-FISP: a new technique for
Coronary Artery and Myocardial Assessment MR Imaging
䡠
1029
Radiology
5.
6.
7.
8.
9.
10.
1030
imaging coronary arteries. Magn Reson Med 2001; 46:494 –502. Stuber M, Botnar RM, Danias PG, Kissinger KV, Manning WJ. Submillimeter three-dimensional coronary MR angiography with real-time navigator correction: comparison of navigator locations. Radiology 1999; 212:579 –587. Kim WY, Danias PG, Stuber M, et al. Coronary magnetic resonance angiography for the detection of coronary stenoses. N Engl J Med 2001; 345:1863–1869. Sommer T, Hofer U, Hackenbroch M, et al. Submillimeter 3D coronary MR angiography with real-time navigator correction in 107 patients with suspected coronary artery disease. Rofo Fortschr Geb Rontgenstr Neuen Bildgeb Verfahr 2002; 174:459 – 466. [German] Taylor AM, Jhooti P, Wiesmann F, Keegan J, Firmin DN, Pennell DJ. MR navigatorecho monitoring of temporal changes in diaphragm position: implications for MR coronary angiography. J Magn Reson Imaging 1997; 7:629 – 636. Shea SM, Deshpande VS, Chung YC, Li D. Three-dimensional true-FISP imaging of the coronary arteries: improved contrast with T2-preparation. J Magn Reson Imaging 2002; 15:597– 602. Lima JA, Judd RM, Bazille A, Schulman SP, Atalar E, Zerhouni EA. Regional heterogeneity of human myocardial infarcts
䡠
Radiology
䡠
June 2005
11.
12.
13.
14.
15.
16.
demonstrated by contrast-enhanced MRI: potential mechanisms. Circulation 1995; 92:1117–1125. Kim RJ, Fieno DS, Parrish TB, et al. Relationship of MRI delayed contrast enhancement to irreversible injury, infarct age, and contractile function. Circulation 1999; 100:1992–2002. Kim RJ, Wu E, Rafael A, et al. The use of contrast-enhanced magnetic resonance imaging to identify reversible myocardial dysfunction. N Engl J Med 2000; 343: 1445–1453. Foo TK, Ho VB, Marcos HB, Hood MN, Choyke PL. MR angiography using steadystate free precession. Magn Reson Med 2002; 48:699 –706. Foo TKF, Stanley DW, Castillo E, et al. Myocardial viability: breath-hold 3D imaging of delayed hyperenhancement with variable sampling in time. Radiology 2004; 230:845– 851. Saranathan M, Rochitte CE, Foo TKF. Fast, three-dimensional, free-breathing MR imaging of myocardial infarction: a feasibility study. Magn Reson Med 2004; 51:1055–1060. Foo TK, Sawyer AM, Faulkner WH, Mills DG. Inversion in the steady state: contrast optimization and reduced imaging time with fast three-dimensional inversion-recovery-prepared GRE pulse sequences. Radiology 1994; 191:85–90.
17.
18.
19.
20.
21.
22.
23.
Deimling M, Heid O. Magnetization prepared trueFISP imaging (abstr). In: Proceedings of the Second Meeting of the Society of Magnetic Resonance. Berkeley, Calif: Society of Magnetic Resonance, 1994; 495. Brittain JH, Hu BS, Wright GA, Meyer CH, Macovski A, Nishimura DG. Coronary angiography with magnetization-prepared T2 contrast. Magn Reson Med 1995; 33: 689 – 696. Noll DC, Nishimura DG, Macovski A. Homodyne detection in magnetic resonance imaging. IEEE Trans Med Imaging 1991; 10:154 –163. Slavin GS, Wolff SD, Gupta SN, Foo TK. First-pass myocardial perfusion MR imaging with interleaved notched saturation: feasibility study. Radiology 2001; 219:258 – 263. Sodickson DK, Manning WJ. Simultaneous acquisition of spatial harmonics (SMASH): fast imaging with radiofrequency coil arrays. Magn Reson Med 1997; 38:591– 603. Pruessmann KP, Weiger M, Scheidegger MB, Boesiger P. SENSE: sensitivity encoding for fast MRI. Magn Reson Med 1999; 42:952–962. Sodickson DK. Tailored SMASH image reconstructions for robust in vivo parallel MR imaging. Magn Reson Med 2000; 44: 243–251.
Foo et al