Oct 25, 2008 - Feature Selection and Policy Optimization for Distributed. Instruction ..... isms with only two of the input features connected to the output.
In The Seventeenth International Conference on Parallel Architectures and Compilation Techniques (PACT-08), Toronto, Canada, October 2008.
Feature Selection and Policy Optimization for Distributed Instruction Placement Using Reinforcement Learning Katherine E. Coons, Behnam Robatmili, Matthew E. Taylor, Betrand A. Maher, Doug Burger, and Kathryn S. McKinley University of Texas at Austin
{coonske,beroy,mtaylor,bmaher,dburger,mckinley}@cs.utexas.edu ABSTRACT
Categories and Subject Descriptors
Communication overheads are one of the fundamental challenges in a multiprocessor system. As the number of processors on a chip increases, communication overheads and the distribution of computation and data become increasingly important performance factors. Explicit Dataflow Graph Execution (EDGE) processors, in which instructions communicate with one another directly on a distributed substrate, give the compiler control over communication overheads at a fine granularity. Prior work shows that compilers can effectively reduce fine-grained communication overheads in EDGE architectures using a spatial instruction placement algorithm with a heuristic-based cost function. While this algorithm is effective, the cost function must be painstakingly tuned. Heuristics tuned to perform well across a variety of applications leave users with little ability to tune performance-critical applications, yet we find that the best placement heuristics vary significantly with the application. First, we suggest a systematic feature selection method that reduces the feature set size based on the extent to which features affect performance. To automatically discover placement heuristics, we then use these features as input to a reinforcement learning technique, called NeuroEvolution of Augmenting Topologies (NEAT), that uses a genetic algorithm to evolve neural networks. We show that NEAT outperforms simulated annealing, the most commonly used optimization technique for instruction placement. We use NEAT to learn general heuristics that are as effective as hand-tuned heuristics, but we find that improving over highly hand-tuned general heuristics is difficult. We then suggest a hierarchical approach to machine learning that classifies segments of code with similar characteristics and learns heuristics for these classes. This approach performs closer to the specialized heuristics. Together, these results suggest that learning compiler heuristics may benefit from both improved feature selection and classification.
D.1.2 [Programming Techniques]: Automatic Programming; I.2.6 [Artificial Intelligence]: Learning
Permission to make digital or hard copies of all or part of this work for personal or classroom use is granted without fee provided that copies are not made or distributed for profit or commercial advantage and that copies bear this notice and the full citation on the first page. To copy otherwise, to republish, to post on servers or to redistribute to lists, requires prior specific permission and/or a fee. PACT’08, October 25–29, 2008, Toronto, Ontario, Canada. Copyright 2008 ACM 978-1-60558-282-5/08/10 ...$5.00.
General Terms Algorithms, Design, Performance
Keywords Instruction Scheduling, Machine Learning, Genetic Algorithms, Neural Networks, Compiler Heuristics
1.
INTRODUCTION
Achieving instruction-level parallelism requires a processor to exploit concurrency among instructions without imposing communication delays that negate the benefits of that concurrency. As concurrency becomes commonplace, minimizing communication delays will become increasingly important, especially for fine-grained parallelism. When placing instructions for an Explicit Dataflow Graph Execution (EDGE) processor, the compiler must manage both concurrency and communication at a fine granularity. In particular, instruction placement for the TRIPS system [21], an EDGE processor that uses static placement, is a very complex task. Unlike approaches for FPGA place-and-route and VLIW instruction placement, instruction issue times are unknown at compile time in TRIPS. This uncertainty, along with unknown memory latencies, makes it more difficult for the compiler to reason about the relative quality of different placements. In addition, the search space of possible placements scales exponentially with the number of machine instructions in the program. As a result, the search space for instruction placement is larger than that of many other compiler optimizations. For example, the search space for function inlining scales exponentially with the number of call sites in the program. The instruction placement problem is a good target for machine learning because the solution space is large and the compiler must make its decisions with only estimates of runtime behavior. In this study we pay careful attention to feature selection for reinforcement learning. Reinforcement learning algorithms perform best with fewer features because fewer features yield a smaller search space. Unlike prior work that uses correlation or covariance techniques, such as principal components analysis [1, 2], we propose a method that takes into account each feature’s effect on performance. We measure execution time on TRIPS hardware using placements
derived from cost models that systematically vary the coefficient of each feature. We then filter out those features that are poor predictors of performance using a dimensionality reduction technique called lasso regression [27]. Finally, we use traditional correlation techniques to eliminate redundant features. We use these techniques to select features that affect performance, and we use those features as input to a machine learning algorithm. We use machine learning to evolve a cost function that finds good placements. We select Neuro-Evolution of Augmenting Topologies (NEAT) [23] because it is effective, popular, and publicly available. We use a standard learning methodology, as follows. We train our instruction placement cost function on a set of representative benchmarks using measurements on the TRIPS hardware, and then evaluate the learned heuristic on new benchmarks, not included in training. Our results show that the hand-tuned heuristics described in prior work are actually very good general solutions; the heuristics learned on a training set of benchmarks were unable to significantly improve upon them when tested on novel benchmarks. When training and testing on individual benchmarks, however, we find significant room for improvement. We propose using an hierarchical algorithm, that rather than discovering a single general solution, allows the compiler to choose from among a variety of heuristics based on characteristics of the code being compiled. We suggest a clustering technique that uses clustering to find segments of code that require similar heuristics to perform well, and then use classification to differentiate those segments of code. We suspect that a similar hierarchical approach could be beneficial for other compiler heuristics such as function inlining, classic instruction scheduling, or register allocation, where the best heuristic may vary with characteristics of the method or other code segment being compiled.
2. BACKGROUND This section provides background information describing instruction placement for the TRIPS system [21], the spatial path scheduling algorithm [6], and the machine learning algorithm, NEAT [23], that we use to optimize the heuristics for that algorithm.
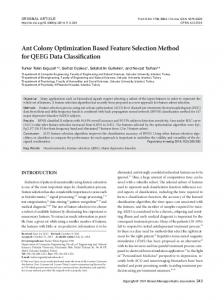
2.1 Instruction placement for TRIPS An Explicit Dataflow Graph Execution (EDGE) ISA breaks a program into a sequence of multi-instruction blocks that commit atomically. The atomic blocks commit in a sequential fashion. The register file is used only to communicate information between blocks, with register reads and writes occurring only at the beginning and the end of a block. Within each block, instructions execute in dataflow fashion. Instructions explicitly encode their location and the locations of their target instructions on a distributed substrate. The processor dynamically issues instructions once all of their source operands have arrived. After performing its computation, an instruction sends its result directly to its consuming instructions. The TRIPS system is a fully functional instantiation of an EDGE ISA that includes a 4 × 4 array of functional units, four distributed register banks, and four distributed, address-interleaved data cache banks, as shown in Figure 1. Each execution tile has an integer unit, a floating-point unit, and reservation stations for instructions. Each register tile
G
R0
R1
R2
R3
D0
E0
E1
E2
E3
D1
E4
E5
E6
E7
D2
E8
E9
E10
E11
D3
E12
E13
E14
E15
Up to 8 instructions per tile
E R D G
Execution tile Register tile Data cache tile Global control tile
1 cycle communication latency
Figure 1: TRIPS microarchitecture. Control flow graph
Dataflow Graph
reads
Execution Substrate
read R2
Block A
mul
writes
write R0
read R1
read R2
load
add
mul
add
mul
add
add D[0]
reads
reads
Block B
Block C
load
writes
D[0]
writes
reads Block D
add
read R1
mul
add
writes write R0
Execution tile Register tile Data cache tile Global control tile
Figure 2: TRIPS compiler flow.
includes 32 registers, for a total of 128 registers. There is a fixed, one-cycle latency to communicate a value between any two neighboring tiles. The operand network uses dimensionordered Y-X routing. The TRIPS compiler merges basic blocks in C and FORTRAN programs to form single-entry, multiple exit, predicated TRIPS blocks, similar to hyperblocks [15]. These blocks are the atomic execution unit and are subject to the following constraints imposed by the ISA. A block contains up to 128 instructions, including up to 32 loads/stores, and a single branch decision. The block header contains up to 32 register read and 32 register write instructions. Prior work describes the techniques that the compiler uses to form blocks that meet these constraints [22]. The compiler backend uses an iterative approach that combines block formation, loop unrolling, loop peeling, tail duplication, and scalar optimizations to form high quality blocks [14]. The instruction scheduler then places individual instructions onto the execution substrate. Figure 2 shows a program at various stages of compilation.
2.2
Spatial Path Scheduling
Prior work [6] describes a Spatial Path Scheduling (SPS) algorithm for EDGE architectures that uses a placement cost to determine in what order to greedily place instructions, as well as where to place each instruction. This heuristic function is a good candidate for machine learning because it is solely responsible for the final placement, making it easy to focus optimization efforts. The SPS algorithm greedily chooses to place the most critical instruction at each step in its best location. The best location and the most critical instruction are both deter-
mined by a single number, the placement cost. The scheduler uses the following max of mins approach: for each instruction, record the location at which the placement cost is minimum. Among all of the instructions under consideration, the one with the largest minimum placement cost is the most critical, so place that instruction next, at its minimum cost location. Repeat this process until all instructions have been placed. The SPS heuristic function calculates the placement cost based on features of the instruction, the location under consideration, and the data flow graph in which the instruction resides. We include these features, along with many others, in a feature selection step prior to machine learning. Prior work shows that the SPS hand-tuned heuristic provides results within 5% of those found via simulated annealing [6]. Although this result might suggest that this heuristic is close to an upper bound, NEAT generates heuristics that outperform simulated annealing for single benchmarks.
2.3 NEAT There are many possible techniques to decide how to place instructions in an EDGE ISA. In this paper, we use NeuroEvolution of Augmenting Topologies (NEAT), a general optimization method with many empirical successes on problems in the field of artificial intelligence [23, 26, 29]. NEAT is a genetic algorithm that uses biologically-inspired operators to stochastically improve a fitness metric over time. To begin, there is a fixed-size population of organisms, each of which can be used to perform some task. Each organism performs the task one or more times, and a cost function calculates fitnesses, which NEAT uses to evolve the population and create the next generation. Successive generations evolve, seeking to improve the fitness of the best organisms in the population. Organisms in different genetic algorithms can be represented in many ways. NEAT is a neuroevolutionary method [8, 31] that uses a neural network to specify each organism. Unlike many other neuroevolution methods, NEAT learns the topology of the neural network in addition to the network’s weights. The neural network can be thought of as a function approximator: input and output nodes correspond to functional inputs and outputs. The number of hidden nodes affects the complexity of the function that can be learned. Modifying the topology of the network through a pair of mutation operators, shown in Figure 3, allows NEAT to incrementally develop increasingly complex organisms to approximate increasingly complex functions. The goal of this complexification is to first find simple organisms that can perform well, and then only add complexity to the networks, and therefore add more parameters to tune, if increased complexity adds to the organisms’ fitnesses. When creating a new population at the end of a generation, NEAT probabilistically copies some of the best organisms from the previous generation to the new generation unchanged. NEAT also applies four genetic operators to organisms, based on their relative fitnesses. Mutation and crossover are similar to standard genetic algorithm operations, which stochastically modify the weights of an organism, or combine the weights from two different organisms. Two special mutation operators, add hidden node and add link, introduce new structure incrementally, and the structural mutations that improve organisms’ fitnesses are more likely to survive evolution, as shown in Figure 3.
Outputs Add Node Hidden Nodes
Mutation 11111111111111 00000000000000
Inputs Outputs Add Link Hidden Nodes
Mutation 111111111111111 000000000000000
Inputs
Figure 3: Examples of NEAT’s mutation operators for adding structure to neural networks.
In this work, we use a variant of the NEAT algorithm, called FS-NEAT [29], that assists with feature selection. When placing instructions for an EDGE ISA, there are many possible features that could determine a placement cost. FSNEAT assists in feature selection by incrementally adding links from possible inputs into the neural network over time, using the standard add link mutation. This procedure allows evolution to determine the features that most improve organisms’ fitnesses, while features that are less useful will not, on average, be added as inputs to the neural networks. NEAT is an appropriate choice for a variety of reasons. First, NEAT is a popular, publicly available package with nine different implementations that is supported by an active users group with approximately 350 members. Second, NEAT is a well understood, domain-independent method that has been successfully applied to a variety of tasks. Third, the process of complexification has been empirically shown [23] to reduce training times and thus make large optimization problems tractable. Fourth, relatively little parameter tuning is necessary for successful learning in practice, which is critical for discovering good heuristics quickly. The next section describes the statistical feature selection techniques that we used. These techniques are independent of NEAT and are used to reduce the number of features provided as inputs to NEAT, and thus the complexity of the space that NEAT must search. In addition, we describe how we use FS-NEAT in our final experiments to ensure that only those features that are useful for a particular benchmark are actually used in the final neural networks.
3.
FEATURE SELECTION
Feature selection is important for reinforcement learning problems because an unnecessarily large feature set increases the size of the search space, making it more difficult for the learning algorithm to find a near optimal solution. While various studies have used machine learning and other artificial intelligence techniques to improve compiled code [7, 11, 12, 28] and compiler heuristics [3, 4, 5, 25], few thoroughly address the problem of feature selection. Most studies use established features supplied by experts, without systematically reducing the feature set [3, 4, 25]. Others use correlation or covariance techniques such as principal components analysis that primarily find relationships among features, and eliminate redundant features [1, 2]. Instead, we chose a systematic feature selection technique that selects from a large set of features based on the extent to which each feature affects performance when used in the heuristic function
being optimized. We combine this statistical feature selection technique with a feature selection technique based on machine learning that leverages the NEAT infrastructure.
3.1 Statistical feature selection techniques We began by forming a thorough list of features that might affect the performance of the final schedule. We asked the TRIPS compiler and hardware teams for suggestions, and established a list of 64 unique features. We implemented functions to collect each of the 64 features whenever an instruction’s placement cost is calculated. To systematically remove features, we used correlation analysis and lasso regression [27]. Correlation resembles principal components analysis (PCA), which has been used in prior work [1, 10] to reduce the size of the feature space. Lasso regression is a linear regression technique that removes features by restricting the values of the coefficients, and has not to our knowledge been used for feature selection in compiler work. Lasso regression may be more effective than correlation because it directly incorporates the effect of each feature on performance. It requires more time, however, as it requires a large sampling of performance results. In addition, the sampling of results must be representative of the data sets that will be seen in practice. Correlation. Features that are highly correlated are likely to represent redundant information, so it may be possible to retain only one among a group of highly correlated features and eliminate the others without losing much information. We computed a correlation coefficient for each pair of features, and ranked the pairs. While some correlations were obvious (the latency of an instruction is highly correlated with that instruction being an integer divide), others were less obvious. For example, the number of stores in a block is highly correlated with the concurrency in that block. This correlation occurs because blocks with many stores often stride through an array, performing independent operations on each element, which often corresponds to a high degree of concurrency. Correlation was useful for eliminating redundant features, but we needed lasso regression to determine which features most affected performance when used to calculate placement cost. Lasso regression is a shrinkage method that attempts to minimize the sum of the squared errors, subject to an upper bound on the sum of the absolute values of the coefficients [27]. This constraint forces the coefficients of some variables to be set to zero, filtering out less helpful variables. We applied lasso regression to a data set generated in the following manner. We used a linear combination of all of the features to determine the placement cost in the instruction scheduler, and we systematically varied the coefficients to sample the space of possible linear placement cost heuristics. We measured performance across a set of ten benchmarks for each of these heuristics. This produced a data set where each data point consisted of 64 coefficient values, one for each feature, and a single speedup representing the geometric mean of the speedup across the benchmark set when compiled using a linear combination of the feature values with those coefficients. Next, we applied lasso regression to this data set to filter out features with little effect on performance. Lasso regression orders the feature set based on the order in which the coefficient for each feature is set to zero. Those features whose coefficients are set to zero first have the smallest im-
Group 1 2 3 2 4 5 6 7 8 9 10 11 11 5 11 12
Features for instruction placement Feature Baseline? Tile number No Local inputs No Criticality Yes Remote inputs No Link utilization Yes Remote siblings No Loop-carried dependence Yes Critical path length Yes Is load No Is store No Tile utilization Yes Latency sum No Instructions on tile No Local siblings No Issue cycle sum No Max resource usage No
Final? No Yes Yes No Yes Yes Yes Yes Yes Yes Yes Yes No No No Yes
Table 1: Instruction features ordered by their rank according to lasso regression. Features in the same Group in Column 1 are highly correlated, and thus we use only the first feature from each group. Column 3 indicates whether the feature is in the handtuned heuristic, and Column 4 indicates whether the feature is in the final set of features.
pact on performance, while those that are never set to zero impact performance the most. We selected the final feature set using the rankings generated via lasso regression. We pruned this list further by finding groups of features that were highly correlated and removing all but the top-ranked feature from each group. Table 1 shows the top ranked features using lasso regression. Column 1 groups the features such that features with the same group number are highly correlated (correlation coefficient > 0.9). Only the highest ranked feature from each group was chosen. Column 3 (Baseline?) indicates whether or not the feature was used in the initial hand-tuned heuristic function. Column 4 (Final?) indicates whether or not the feature was part of the final feature set chosen after lasso regression. We eliminated two of the features used in the original hand-tuned heuristic during feature selection: the fullness of the block and the concurrency within the block. We also added three features that were not included in the handtuned heuristic: the number of local (same tile) input instructions, the number of remote sibling instructions, and the maximum resource usage (in cycles) among all physical resources including both functional units and network links. Using these features, NEAT learned heuristics that produced code that performed 4% better than heuristics learned with the features used by the hand-tuned heuristic. One weakness of using lasso regression for feature selection is that because lasso is a dimensionality reduction technique for linear regression problems, it is unable to model more complex heuristic functions. Nonlinear approaches are possible, but substantially increase the size of the search space. We believe this limitation may explain the top ranked feature, a number representing which tile was being considered (Tile number in Table 1): the tile number appears most important in a linear heuristic function. It significantly in-
3.2 FS-NEAT In addition to the statistical feature selection techniques described in Section 3.1, we use a variation of NEAT called FS-NEAT [29] to further reduce the size of the search space. FS-NEAT, or Feature Selection NEAT, takes advantage of the fact that NEAT can evolve the topology of a neural network by not connecting all of the input features directly to the output node. We do not use this technique to decide which features to exclude from the feature set, but instead use it to create simpler networks that use only those features that are necessary for each training run. We found that all of the features selected via the techniques described in Section 3.1 were useful for some subset of the benchmarks, but that few individual benchmarks actually required all of the features. Using FS-NEAT, the initial population consists of organisms with only two of the input features connected to the output. To ensure that the initial population fairly represented each feature, we derived the population size, psize ` ´ from the feature set size, fsize, as follows: psize = fsize+1 × 2 4. We added one to fsize because NEAT always includes one additional feature, called the bias, that serves as an adjustment to a node’s output function. This value for psize allowed us to initialize the population to include all possible combinations of two features, with all possible combinations of negative and positive weights. To keep training time reasonable, we had to constrain the population size, limiting the initial feature set size. We wanted to ensure that it would not take more than a day to train a single benchmark, and found that we needed to keep the population size below 300 organisms to fit this constraint. Thus, we selected fsize such that fsize was maximized while fulfilling ` ´the following constraint: psize< 300, where psize= fsize+1 ∗ 4, as described above. Using this 2 constraint, we arrived at a final feature set size of 11 features.
4. NEAT We use the results of feature selection as input to NEAT and apply NEAT to the TRIPS Spatial Path Scheduler.
4.1 Framing the problem We built a wrapper around the scheduler that manages each NEAT generation. The wrapper compiles each benchmark in the training set with each neural network in the population during each generation. It thus performs a total of b ∗ o ∗ g compilations where b is the number of bench-
Placement Cost Negative weight Positive weight H
Output node Hidden node
I
Input node
O
O 2.1
H -.4 1.3
1.6 -.2
2.4
.7
-.3
.4
H -.5
-.6
.4 1.8
I
I U t T il i liz e at io n
I
Is Lo ad Lo de oppe ca nd rrie en d ce
I
Ut Lin i liz k at io n al In pu ts
I
Lo c
I B ia s
II
lit y Cr iti ca len l P gt ath h
II Cr iti ca
fluences performance because the top left corner of the ALU array is closest to both the instruction caches and the register banks, and is thus far more desirable than the bottom right for many instructions. In practice, however, we observed that none of the neural networks made use of this simple feature as they evolved more complex heuristics. We therefore eliminated the tile number from the final feature set. This technique may also be limited by the sample set. The sample set we used consisted of 4,000 data points. While this data set size may seem small for a 64-dimensional space, it is important to note that the goal during feature selection is not to find a single optimum point, but to discover which features can affect performance, making a smaller sample set size more appropriate.
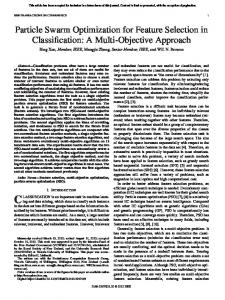
Figure 4: An example neural network including the inputs (features), the output (placement cost), two hidden nodes, and weights for the edges between each pair of nodes.
marks in the training set, o is the number of organisms in the population, and g is the number of generations. Each neural network determines the placement cost for an instruction at a given location. For each instruction within a block, ij , the scheduler computes the placement cost for ij at each available location, and selects the minimum cost location for ij . Then, the scheduler chooses the instruction whose minimum cost is largest, and places that instruction at its minimum cost location, because it is the most critical instruction. A single compilation uses a single neural network, and that network produces all of the scheduler’s placement costs. Figure 4 shows an example neural network. The scheduler computes values for the input features based on the placements so far, the dataflow graph for the block, the instruction, and the location under consideration. After scheduling each benchmark using a given organism, the wrapper determines the fitness of that organism. We equate performance with fitness: we run each benchmark on the TRIPS hardware, compute the geometric mean of their speedups over the baseline hand-tuned spatial path scheduler, and use this relative speedup as the organism’s fitness. Training across multiple benchmarks allows us to find a more general solution. If the benchmark set consists of only one benchmark then NEAT will produce a specialized heuristic for that benchmark. We also allow the user to specify the name of a specific TRIPS block, such that NEAT learns a specialized solution for that block. (All other blocks are scheduled with the hand-tuned heuristic.)
4.2
Training on Individual Benchmarks
We used NEAT to find specialized heuristics for individual benchmarks. Training NEAT to do well on an individual benchmark leads to overfitting: such solutions may not perform well on other benchmarks. The resulting performance, however, was typically the best performance observed for each benchmark, outperforming placements produced via either hard-coded heuristics or simulated annealing. Although the results from training on an individual benchmark may not be useful as general solutions, this technique is useful for optimizing a performance critical program or
library. The result of a single training run may be useful as the program evolves as well. Since NEAT finds a heuristic that works well for that benchmark, the resulting cost function can be used without additional training after relatively minor source code changes.
4.3 General solutions We also trained NEAT across a large set of benchmarks to find a general solution. Unlike Stephenson et al.’s Meta Optimization work [25], we found that machine learning was unable to find solutions that improved significantly over hand-tuned solutions in the general case. One explanation could be a baseline better optimized for the general case; prior work showed that the baseline came within 5% of solutions found via simulated annealing [6]. Another explanation might be the potential for improvement – Stephenson et al. focused on hyperblock formation, which may be an optimization that has greater impact on performance than instruction placement has. Although we were unable to find general solutions that significantly outperformed the hand-tuned solution, the difference between the performance of the general solution and the performance of the specialized solutions is pronounced. Thus, we investigated a hierarchical approach to the general solution to reclaim some of the performance lost when moving from specialized to general solutions.
4.4 Clustering and classification Classification is a supervised learning technique that uses training data to create a function that classifies new data. In a general classification problem, the training data contains a list of data instances, with a feature vector and a class (i.e., a label). The job of the classifier is to predict the class for new data instances. Classification is typically a supervised learning problem, requiring a correct set of class labels for training. We used clustering to find class labels for the critical blocks in the benchmark set, and we used those as training data for classification. We chose classes at a block granularity – each block of instructions was assigned a class label. It would be possible to classify at other granularities as well. For instance, a benchmark, method, or instruction could be assigned a class label. We chose the block because it represented a reasonable tradeoff in terms of ease of analysis, as the size of the code is strictly limited, and degree of useful information, as the block includes global information that could not be found in a single instruction. Other granularities may make sense for different problems, however.
4.4.1
Clustering
We intentionally selected relatively small benchmarks containing few critical blocks that significantly contribute to performance. Thus, the best neural network for a given benchmark should create a good placement for the few critical blocks within that benchmark. By attributing the performance of an entire benchmark to the quality of the placement of a few critical blocks, it was possible to perform classification based on qualities of individual blocks. The hypotheses underlying this assumption are that a different type of scheduling algorithm may be necessary for blocks with different characteristics, and that the critical blocks within a given benchmark are likely to share some of those characteristics.
One option to find class labels for blocks is to apply a clustering technique to features of the blocks. Such a clustering technique groups the blocks into clusters that minimize some distance metric among features. The problem with this approach is that the appropriate distance metric is unclear. We want a distance metric that will group the blocks into groups that require similar neural networks (and similar scheduling algorithms) to perform well. It is not immediately clear which block features would best differentiate blocks, or what the correct distance metric would be to allow a clustering technique to form the correct groups. To ensure that the distance metric would be representative of how well those blocks would perform if the instructions within them were placed using the same neural network, we chose to use the performance of benchmarks as the distance metric. We used the best n organisms trained on each benchmark to perform placement on every other benchmark for a total of n ∗ b ∗ b data points, where b is the number of benchmarks in the training set. We created a table with n∗b columns and b rows, where each data point represents the speedup of some benchmark using one of the n best neural networks trained to do well on some other benchmark. Using the data in this table, we created a similarity graph in which the nodes represent benchmarks and the edges between nodes represent the similarity between the two benchmarks connected by that edge. We experimented with several different similarity metrics and chose the one that created the most accurate classifier using cross-validation. To calculate the similarity between two benchmarks, we first calculate the geometric mean of the speedup on each benchmark across all neural networks tested. Thus, for each benchmark, we find a mean speedup across all neural networks, meanSpeedup b . To compute the similarity between two benchmarks, b1 and b2 , we find the difference between the speedup of a benchmark compiled using each organism and the average speedup for that benchmark. Thus, for each organism o and Speedup(o,b) benchmark b, we compute the value D(o,b) = meanSpeedup . b For each pair of benchmarks, we subtract these two numbers and sum across all organisms. Thus, the difference between benchmarks b1 and b2 is DIFF (b1 ,b2 ) =
X
|D(o,b1 ) − D(o,b2 ) |
(1)
o∈0..b×n
If two benchmarks are always affected in the same way by the same organisms, the difference between them will be small when using this metric. If the difference between them is large, the benchmarks’ performance varies in different ways with different organisms. We therefore use the inverse of DIFF (b1 ,b2 ) as the similarity function. We use the graph clustering tool Graclus [9] to read the similarity graph and generate a list of clusters. Graclus assigns a cluster number to each benchmark such that the similarity among blocks in the same cluster is maximized. The cluster for each benchmark provides the “correct” class for each critical block within that benchmark, which provides training data for the classifier. We chose benchmarks with few critical blocks, and associated all of the critical blocks in a benchmark with the class of that benchmark in the training data. We found that training NEAT to do well on individual blocks created overly specialized solutions that obfuscated useful global information. Training each of
Feature Outputs Loads Writes Branches Fanout Loop size Stores Critical path length Concurrency Fullness Predication Loop Contains LCDs Contains call Predecessors Successors
Description # branches + # stores + # writes # loads # writes # branches # fanout instructions # blocks in the loop # stores critical path length through block # instructions/critical path length # instructions in block/128 # explicitly predicated instructions True if block is in a loop True if block contains loop-carried dependences True if block contains a call # incoming control flow graph edges # outgoing control flow graph edges
Table 2: Feature set for block classification Classifier Cross-Validation Accuracy (%) Classifier 3 classes 4 classes 5 classes 6 classes J48 75.0 72.4 54.6 62.7 JRip 77.0 71.9 57.7 63.2 SMO 74.5 63.3 41.8 60.2 MLP 77.0 67.34 57.1 65.8 Table 3: Cross validation accuracy of the training data with different classifiers the critical blocks individually does not produce results that perform as well as training all of the critical blocks to work well together.
4.4.2
Block features and classification
After finding the class associated with each block, we extracted features of blocks for the classifier to use to predict their class. We chose not to use the same feature set that we use to place instructions because the features used to classify blocks must be representative of the entire block, rather than a single instruction at a given location. We emphasize the importance of feature selection for reinforcement learning because decreasing the size of the search space allows reinforcement learning algorithms to find better solutions more efficiently. Classification algorithms, on the other hand, are better able to handle large feature sets. The complexity of these algorithms is independent of the number of features. Thus, we do not perform the same exhaustive feature selection for the block features that we do for the instruction placement features. Instead, we allow the classification software to handle feature selection. Table 2 shows the initial feature set we chose in order of their importance as measured by the Weka software, a collection of supervised learning algorithms for data mining tasks that contains tools for data pre-processing, classification, regression, and visualization [30]. The Weka tool requires the user to select among classifiers. The accuracy of each classifier varies based on the distribution and correlation between features and classes in the data set. With more classes, we expect a higher speedup for the
training data in each cluster because the clusters are smaller, and finding a general solution for the training data in that cluster is thus easier. However, too many classes leads to overfitting and reduces the accuracy on novel benchmarks. We tried multiple classification algorithms. For each classifier, we varied the number of classes. Table 3 shows the cross validation accuracy for the following Weka classifiers: J48, JRip, SMO, and MLP, which implement a decision tree, a propositional rule learner, a support vector machine, and a multi-layer perceptron, respectively. In all cases, the accuracy of the classifier degrades with the number of classes (when tested on novel benchmarks via cross-validation), except for the 6-class column. When using 6 clusters, Graclus places most of the benchmarks in only one cluster and leaves the remaining clusters almost empty. Obviously, this results in higher classification accuracy, but finding an organism that performs well on that large cluster is no less difficult than finding a single general solution. Thus, we ignore the 6-class case. JRip and MLP achieve similar accuracy with three classes but JRip is much faster and it is more accurate for other cluster sizes. Therefore, we choose JRip with three classes. After training the classifier, we found organisms that create good placements for the blocks that fall into each class. One way to find these organisms would be to use the organism with the best average speedup across all the benchmarks in that class. This approach would take little time, but the results may be specialized to the particular benchmark on which it was trained. Instead, we trained an organism only on the blocks that the classifier places into a given class and used the best organism from that training run to schedule all future blocks that fall into that class. This method takes more time because it requires an additional training run, but may produce better results on novel benchmarks.
5.
RESULTS
We tested various placements by running them on the TRIPS system. TRIPS is a 170 million transistor ASIC implemented in 130nm technology with a 366 MHz clock, 32 KB L1 cache, 1 MB L2 cache, and 2 GB of SDRAM running at 200 MHz. We selected short-running benchmarks because simulated annealing and NEAT both require many executions of a program. We chose benchmarks with varied characteristics, including available parallelism and register/memory usage, to provide a full range of placement requirements during training. We include benchmarks where the unplaced assembly code has been generated by the compiler, as well as benchmarks with hand-tuned assembly. Hand-tuned benchmarks typically have larger blocks than compiler generated benchmarks, and instruction placement usually affects their performance more as a result. We selected a large number of benchmarks to ensure that the benchmark set sizes would still be reasonable after clustering. The final benchmark set contained 47 benchmarks including 17 SPEC2000 kernels (10 compiler generated, 7 handtuned), 11 Lincoln Labs kernels including computations such as corner turn, singular value decomposition, and convolution (7 compiler generated, 4 hand-tuned), 9 signal processing kernels from the GMTI radar suite (5 compiler generated, 4 hand-tuned), and 2 compiler-generated EEMBC benchmarks (pntrch01 and rspeed01). The remaining eight benchmarks consisted of matrix multiply, vector add, fast
Fitness of best network using baseline and lasso features Baseline Features
Lasso Features
1.04 1.02
Speedup
1 0.98 0.96 0.94 0.92 0.9 0
10
20
30
40
Generation
Figure 5: Training with two different feature sets: the baseline features used in the instruction scheduler, and the features chosen after feature selection.
Fourier transform, a prime number generator, and memset from the C libraries (3 compiler generated, 5 hand-tuned).
5.1 Feature selection To test the effectiveness of the new features selected via lasso regression as described in Section 3, we ran two NEAT experiments that differed only in the feature set used. For the baseline we chose the set of features used by the existing hand-tuned algorithm. We performed the same experiment using the set of features chosen using lasso regression and compared the results. Figure 5 shows the results of this experiment performed on a set of four training benchmarks - vector add, fast Fourier transform, matrix multiply, and complex matrix multiply. The best results obtained via NEAT on these experiments were 4% better with the new feature set chosen via lasso regression than they were with the feature set chosen by hand. Using the initial features on these benchmarks, NEAT was unable to surpass the hand-tuned scheduler after 40 generations, but with the new set of features NEAT surpassed the hand-tuned instruction scheduler after only nine generations. We performed the same experiment on another set of four benchmarks, kernels from the ammp, parser, bzip2, and gzip SPEC2000 benchmarks, and again observed a 4% improvement using the new feature set. Thus, we used the new feature set for the remaining experiments. Using FS-NEAT in combination with training on individual benchmarks, we determined the extent to which different benchmarks require different heuristics to produce good placements. We found that only 20% of the 47 benchmarks evaluated made use of all 12 of the available features. Table 4 shows the final feature set and the fraction of the best 10 organisms for each benchmark that used each feature. Column 3 shows the fraction of the best 10 general solutions that use each feature.
5.2 Training individual benchmarks compared to simulated annealing We use NEAT to find a specialized heuristic for each of the 47 benchmarks. To determine how many generations would be sufficient for a training run, we trained a subset containing nine of the benchmarks each for 200 generations.
Feature usefulness Feature Specialized Bias 94% Critical path length 87% Is store 82% Max resource usage 81% Loop-carried dependence 80% Is load 78% Tile utilization 76% Criticality 74% Link utilization 71% Remote siblings 69% Latency sum 64% Local inputs 61%
General 100% 100% 100% 100% 100% 100% 90% 100% 90% 100% 90% 90%
Table 4: Instruction features ordered by the proportion of the best ten solutions for each individual benchmark that use that feature (Column 2). Column 3 shows the proportion of the best 10 general solutions that use each feature. Technique Hand-tuned SPS + Annealing NEAT NEAT + Annealing
Speedup 1.08 1.12 1.14
Table 5: Geometric mean of speedups for benchmark-specific heuristics over the hand-tuned SPS scheduler across 46 benchmarks. We created graphs of the performance and the complexity of each network, with complexity measured by the number of edges. By analyzing the best networks from these 200 generation trials, we concluded that 100 generations were probably sufficient for the remaining runs. We then compared results for the specialized heuristics both to the instruction scheduler’s hand-tuned heuristic and to a simulated annealing scheduler. One common technique used to optimize placement problems is simulated annealing. An annealer takes as input a solution to the problem that is suboptimal. It iteratively improves this solution by randomly changing it. If the new solution is better according to some quality metric, it will always keep that solution. If the new solution is worse, then it will keep that solution with some probability that varies over time. While simulated annealing can often find very good solutions, the solutions that it finds are not general. If a source program changes then the entire annealing process must be run again to accommodate the changes. With NEAT, however, the end result is a heuristic that can be used to schedule any program. Although that heuristic may not perform well on programs that are not similar to the program on which it was trained, those solutions are likely to do well on similar programs or modified versions of the original program. We implemented a simulated annealing scheduler for TRIPS and used the instruction scheduler’s placement as the starting point. Table 5 shows the geometric mean of the speedup across 46 of the 47 benchmarks in the training suite normalized to the hand-tuned scheduler’s performance on the same benchmark. The pm benchmark from the Lincoln Labs kernels was omitted because it did not work with the annealer.
Simulated annealing was able to achieve a mean speedup of 1.08 over the hand-tuned Spatial Path Scheduler (SPS) on this benchmark set (Hand-tuned SPS + Annealing). Using NEAT to find a good heuristic for each benchmark, the mean speedup was 1.12. NEAT found a better solution than simulated annealing for 33 of the 46 benchmarks. For only 5 of the remaining 13 benchmarks did simulated annealing produce a result that was better than the NEAT result by more than 1%. Finally, we used the best placement produced by NEAT as the starting point for simulated annealing (NEAT + Annealing). The mean speedup over the Hand-tuned SPS was 1.14 after annealing the best NEAT result. Simulated annealing was able to achieve a speedup of only 1.02 over the best NEAT placement, compared to an improvement of 1.08 over hand-tuned SPS.
5.3 General solutions To learn a general scheduling heuristic, we trained NEAT across the entire benchmark set to produce a single general solution. The fitness of each organism using this approach was the geometric mean of the speedup of each benchmark over the hand-tuned SPS heuristic. The best organism trained using this approach provided a speedup of 1.01 over handtuned SPS. To test this general solution on new data, we ran the best organism trained across the 47 benchmark set on the EEMBC benchmarks, and compared the results to the scheduler using the hand-tuned heuristic. The general solution provided performance almost identical to the handtuned solution, with a speedup of 1.005. Although this result is significant given that it is compared to a highly hand-tuned result, it is modest compared to the results observed in Stephenson et al.’s Meta Optimization work, where they observed speedups of 1.44, 1.03, and 1.31 for block formation, register allocation, and data prefetching, respectively, using a general heuristic trained across sets of ten or fewer benchmarks. On novel benchmarks, they observed speedups of 1.09, 1.02, and 1.01 for the same three optimization problems. As discussed in Section 4.3, various factors may account for this difference, including the number of benchmarks used, the optimization’s effect on performance, and the complexity of the problem being solved. However, the specialized solutions improve over the general solution by 11%, using the geometric mean of the speedup over the benchmark set. We now show results for one way classification could be used to recover part of this speedup.
5.4 Classification We performed three training runs for classification, one to train each of three classes. We found that one of the classes contained a catch-all for all blocks that did not fit into either of the other classes, and we saw very little speedup training on these blocks, so we opted to use hand-tuned SPS to schedule those blocks to save training time. The blocks that did fall into the remaining two classes showed significantly better results. One experimental advantage to the clustering technique is that we could perform the training runs in parallel. When training across an entire set of benchmarks, one generation cannot proceed until the entire previous generation has completed. Using clustering, however, the groups are smaller and can be trained in parallel. Thus, while it took multiple weeks to perform a
complete training run with the general solution, it required less than a week to obtain significantly better results with classification. Across the 17 benchmarks that contained critical blocks belonging to the first cluster, we saw a speedup of 1.06. Among the 12 blocks containing critical blocks belonging to the second cluster, we saw a speedup of 1.04 after only a day of training.
6.
RELATED WORK
6.1
Machine learning
Stephenson et al. use genetic programming to learn a priority function for different compiler optimizations including hyperblock formation, register allocation, and data prefetching [25]. They evolve expression trees that calculate the result of the appropriate priority function. The genetic algorithm evolves the expression trees by changing the operators and the weights of each expression. The population evolves based on the fitness values (cycles) achieved using the previous population of expression trees. Using NEAT for instruction placement could be considered a form of meta optimization, however, the size of the search space for the problem that we investigate may be larger than the size of the search space for the problems investigated in Stephenson et al. While they use expression trees to extract a human readable mathematical model, they find that the formulas learned are too complex. NEAT allows the population to begin with a minimal structure of neural nets, with no hidden nodes. Hidden nodes are only added if they benefit performance, which helps NEAT find minimal networks, makes the solutions easier to understand, and decreases training time. Cooper et al. use a genetic algorithm to find phase orderings that reduce code size for embedded systems [7]. They allow the compiler to use different phase orderings to compile different modules and functions of the same program. Their genetic algorithm finds a good phase ordering for a given program or function, however, it does not find a good heuristic to choose what phase ordering to use. Thus, the results cannot be applied to new programs and do not provide insights regarding what factors determine which phase ordering is best. In another study, Waterman et al. use a technique called adaptive compilation to find the phase ordering that produces the code with the best performance [28]. For each phase ordering, an objective function counts the number of static instructions. This method shows significant performance improvements, but the results are not reusable. Similar studies have explored the compilation space and also found the best phase ordering for a given program or function rather than learning how to use the characteristics of the program or function to choose the best phase ordering [11, 12]. Cavazos and O’Boyle use genetic algorithms to automatically tune a dynamic compiler’s internal inlining heuristic [5]. Their technique shows a 17% improvement in total runtime on the SPECjvm98 benchmark suite and a 37% improvement in total runtime on the DaCapo benchmark suite. These reductions are largely due to a decrease in dynamic compile time, as the compiler learns not to inline if doing so will hurt total runtime. The average runtime was decreased by 1% for SPECjvm98 and increased by 4% for DaCapo, but the savings in dynamic compile time were significant.
Cavazos and Moss [3] use a supervised learning algorithm to recognize when the compiler can skip scheduling a basic block without significantly hurting performance. They improve the compilation speed of JIT compilers significantly, while retaining 90% of the run-time performance of scheduling every basic block. The same authors use rule learning, a type of classification, to choose between graph coloring and linear scan register allocators on a per-method basis, based on the features of the method [4]. This problem is much simpler than the problem we attempt to solve, as the heuristics used by each class are fixed, whereas we must learn both how to classify and what heuristic to use for each class. Moss et al. describe a method that uses reinforcement learning to discover good heuristics for temporal scheduling of basic blocks [19]. Their method uses supervised learning, where the training examples are optimal schedules of small basic blocks derived by exhaustive search. Because of the small search space involved, constructing these examples is not unreasonably time consuming. Monsifrot et al. use a supervised learning approach called boosted decision trees to choose loops to unroll [18]. By extracting the effective parameters for loop unrolling in different processors, they re-target the compiler to multiple platforms. They show modest improvements for two architectures. This classifier is a binary classifier, and it uses a handtuned compiler heuristic to determine the unroll factor. In a similar study, Stephenson and Amarasinghe use a classifier to determine the unroll factor for each loop where each class represents a different unroll factor [24]. This method predicts the best unroll factor correctly for 65% of 2,500 loops and achieves a 5% performance improvement on the SPEC2000 benchmark suite. To select good features, Leather et al. propose constructing a grammar for features, and using learning techniques to evaluate the features. They construct a classifier that selects an appropriate heuristic [13].
6.2 Instruction placement Mercaldi et al. [16] perform instruction placement for WaveScalar, a tiled dataflow processor with a hierarchical substrate, by using a profile-driven algorithm at the higher levels of the hierarchy, and an algorithm that balances communication and contention at the lower levels of the hierarchy. Instruction placement for TRIPS is most similar to placement at the lower levels of this hierarchy. Their finegrained placement algorithm contains two phases. The first phase groups instructions based on a width and a depth parameter. The second phase uses a tuning parameter to determine, for each group created in phase one, the probability it will favor optimizing for communication or optimizing for contention. We explore this same tradeoff via the features we supply to the machine learning algorithm. Versatile place and route (VPR) is a place and route tool for FPGAs that uses simulated annealing to place instructions. Unlike the instruction placement problems for TRIPS and WaveScalar, however, the latencies and resource conflicts are known at compile time, so the instruction placement heuristic does not have to guess what the latency will be or whether resource contention will be present. Because these latencies and conflicts are known, VPR can use a static cost function for simulated annealing. A static cost function for a dynamic issue processor such as TRIPS or WaveScalar would be too inaccurate due to unknown latencies, as Mer-
caldi et al. show while searching for a static instruction placement performance model [17]. Lastly, Force-Directed Scheduling is an algorithm proposed by Paulin and Knight for ASIC synthesis [20]. The significant features are different in these two contexts. A machine learning approach similar to the one presented here may be useful in the context of ASIC synthesis, but additional features become more important in that domain that do not receive attention here, such as area and power budget.
7.
CONCLUSIONS
Feature selection is important when applying a reinforcement learning technique. Feature selection techniques that only consider relationships among features such as those based on variance and correlation may be insufficient as they do not account for the features’ effect on performance. We use feature selection to find the features most likely to affect performance, in addition to removing redundant features. Neuro-Evolution of Augmenting Topologies (NEAT) is a publicly available reinforcement learning package with an active user base that can be used to tune compiler heuristics with very little modification. This paper demonstrates that NEAT is an effective technique for finding good instruction placements for an EDGE architecture. NEAT successfully tuned the placement cost heuristic in the spatial path scheduling algorithm for individual benchmarks. NEAT achieved performance significantly better than both hand-tuned heuristics and placements produced via simulated annealing when using specialized heuristics. NEAT requires significant computational time to find a good solution, but it requires almost no user intervention. Because NEAT learns a heuristic rather than a placement, the results of a training run are reusable for future compilations of the same program, slightly modified compilations of the same program, or even entirely new programs. Although NEAT produces good placements when specialized for individual benchmarks, finding good general solutions is very difficult. Different benchmarks may require significantly different placement heuristics. To compensate for these differences, we propose using a hierarchical approach that classifies units of code into groups that will perform well with similar heuristics. Finding heuristics that perform well on these groups of similar units of code is faster, and produces better solutions than general solutions that must handle all cases well. Using statistical or machine learning approaches to find the best groupings may reduce the complexity for the machine learning algorithm, as it will only need to find good heuristics for a subset of similar cases. How to find the best groupings is still an open question, however. Finding which factors best classify groups of instructions can also provide interesting insights for the compiler writer. Even if finding a final heuristic via machine learning is not found to be practical in practice, we believe that machine learning and data mining techniques could be used during compiler development to gain insights such as new features that will be useful even for hand-tuned heuristics.
8.
ACKNOWLEDGMENTS
We would like to thank Brian Kulis, Jason Davis, Inderjit Dhillon, Mark Stephenson, Shimon Whiteson, Emmett Witchel, and John Cavazos for their helpful feedback.
This work was supported by an NSF Graduate Fellowship, NSF CSR-0615104, NSF EIA-0303609, DARPA F33615-03C-4106, and Intel. Any opinions, findings and conclusions expressed herein are the authors’ and do not necessarily reflect those of the sponsors.
9. REFERENCES [1] F. Agakov, E. Bonilla, J. Cavazos, B. Franke, G. Fursin, M. F. P. O’Boyle, J. Thomson, M. Toussaint, and C. K. I. Williams. Using machine learning to focus iterative optimization. In International Symposium on Code Generation and Optimization, pages 295–305, Washington, DC, USA, 2006. [2] J. Cavazos, C. Dubach, F. Agakov, E. Bonilla, M. F. P. O’Boyle, G. Fursin, and O. Temam. Automatic performance model construction for the fast software exploration of new hardware designs. In ACM International Conference on Compilers, Architecture and Synthesis for Embedded Systems, pages 24–34, Seoul, Korea, 2006. [3] J. Cavazos and E. Moss. Inducing heuristics to decide whether to schedule. In ACM Conference on Programming Language Design and Implementation, pages 183–194, Washington DC, USA, 2004. [4] J. Cavazos and E. Moss. Hybrid optimization: Which optimization to use? In International Conference on Compiler Construction, pages 124–138, Vienna, Austria, 2006. [5] J. Cavazos and M. O’Boyle. Automatic tuning of inlining heuristics. In ACM/IEEE Conference on Supercomputing, page 14, Washington, DC, USA, 2005. [6] K. E. Coons, X. Chen, D. Burger, K. S. McKinley, and S. K. Kushwaha. A spatial path scheduling algorithm for EDGE architectures. In ACM Conference on Architectural Support for Programming Languages and Operating Systems, pages 129–140, San Jose, California, USA, 2006. [7] K. Cooper, P. Scheilke, and D. Subramanian. Optimizing for reduced code space using genetic algorithms. In ACM SIGPLAN Workshop on Languages, Compilers, and Tools for Embedded Systems, pages 1–9, Atlanta, Georgia, United States, 1999. [8] D. Dasgupta and D. McGregor. Designing application-specific neural networks using the structured genetic algorithm. In International Conference on Combinations of Genetic Algorithms and Neural Networks, pages 87–96, 1992. [9] I. S. Dhillon, Y. Guan, and B. Kulis. Weighted graph cuts without eigenvectors: A multilevel approach. IEEE Trans. Pattern Anal. Mach. Intell., 29(11):1944–1957, 2007. [10] C. Dubach, J. Cavazos, B. Franke, M. O’Boyle, G. Fursin, and O. Temam. Fast compiler optimisation evaluation using code-feature based performance prediction. In ACM International Conference on Computing Frontiers, pages 131–142, May 2007. [11] T. Kisuki, P. Knijnenburg, M. O’Boyle, F. Bodin, and H. Wijshoff. A feasibility study in iterative compilation. In Second International Symposium on High Performance Computing, pages 121–132, Kyoto, Japan, 1999. [12] T. Kisuki, P. Knijnenburg, M. O’Boyle, and H. Wijshoff. Iterative compilation in program optimization. In Compilers for Parallel Computers 2000, pages 35–44, Aussois, France, 2000. [13] H. Leather, E. Yom-Tov, M. Namolaru, and A. Freund. Automatic feature generation for setting compilers heuristics. In 2nd Workshop on Statistical and Machine Learning Approaches to Architectures and Compilation (to appear), 2008. [14] B. A. Maher, A. Smith, D. Burger, and K. S. McKinley. Merging head and tail duplication for convergent hyperblock formation. In IEEE/ACM International Symposium on Microarchitecture, pages 65–76, Orlando, Florida, USA, 2006.
[15] S. A. Mahlke, D. C. Lin, W. Y. Chen, R. E. Hank, and R. A. Bringmann. Effective compiler support for predicated execution using the hyperblock. In International Symposium on Microarchitecture, pages 45–54, Portland, Oregon, United States, 1992. [16] M. Mercaldi, S. Swanson, A. Petersen, A. Putnam, A. Schwerin, M. Oskin, and S. J. Eggers. Instruction scheduling for a tiled dataflow architecture. In ACM International Conference on Architectural Support for Programming Languages and Operating Systems, pages 141–150, San Jose, California, USA, 2006. [17] M. Mercaldi, S. Swanson, A. Peterson, A. Putnam, A. Schwerin, M. Oskin, and S. Eggers. Modeling instruction placement on a spatial architecture. In Symposium on Parallel Architectures and Applications, pages 158–169, Cambridge, Massachusetts, USA, 2006. [18] A. Monsifrot, F. Bodin, and R. Quiniou. A machine learning approach to automatic production of compiler heuristics. In Proceedings of the 10th International Conference on Artificial Intelligence: Methodology, Systems, and Applications, pages 41–50. Springer-Verlag, 2002. [19] E. Moss, P. Utgoff, J. Cavazos, D. Precup, D. Stefanovic, C. Brodley, and D. Scheeff. Learning to schedule straight-line code. In Proceedings of the Neural Information Processing Symposium (NIPS), pages 929–935, 1997. [20] P. G. Paulin and J. P. Knight. Force-directed scheduling in automatic data path synthesis. In ACM/IEEE Conference on Design Automation, pages 195–202, Miami Beach, Florida, United States, 1987. [21] K. Sankaralingam, R. Nagarajan, R. McDonald, R. Desikan, S. Drolia, M. S. Govindan, P. Gratz, D. Gulati, H. Hanson, C. Kim, H. Liu, N. Ranganathan, S. Sethumadhavan, S. Sharif, P. Shivakumar, S. W. Keckler, and D. Burger. Distributed microarchitectural protocols in the TRIPS prototype processor. In IEEE/ACM International Symposium on Microarchitecture, pages 480–491, Orlando, USA, 2006. [22] A. Smith, J. Burrill, J. Gibson, B. Maher, N. Nethercote, B. Yoder, D. Burger, and K. S. McKinley. Compiling for EDGE architectures. In International Symposium on Code Generation and Optimization, Manhattan, NY, Mar. 2006. [23] K. O. Stanley and R. Miikkulainen. Evolving neural networks through augmenting topologies. Evolutionary Computation, 10(2):99–127, 2002. [24] M. Stephenson and S. Amarasinghe. Predicting unroll factors using supervised classification. In International Symposium on Code Generation and Optimization, pages 123–134, San Jose, California, 2005. [25] M. Stephenson, S. Amarasinghe, M. Martin, and U.-M. O’Reilly. Meta optimization: Improving compiler heuristics with machine learning. In ACM Conference on Programming Language Design and Implementation, pages 77–90, San Diego, California, USA, 2003. [26] M. Taylor, S. Whiteson, and P. Stone. Comparing evolutionary and temporal difference methods in a reinforcement learning domain. In Proceedings of the Genetic and Evolutionary Computation Conference, pages 1321–28, July 2006. [27] R. Tibshirani. Regression shrinkage and selection via the lasso. Journal of the Royal Statistical Society. Series B (Methodological), 58(1):267–288, 1996. [28] T. Waterman. Adaptive compilation and inlining. PhD thesis, Rice University, 2006. [29] S. Whiteson, P. Stone, K. O. Stanley, R. Miikkulainen, and N. Kohl. Automatic feature selection in neuroevolution. In Genetic and Evolutionary Computation Conference, pages 1225–1232, June 2005. [30] I. H. Witten and E. Frank. Data mining: Practical machine learning tools and techniques, 2nd edition. June 2005. [31] X. Yao. Evolving artificial neural networks. Proceedings of the IEEE, 87(9):1423–1447, 1999.