Feature Usage Diagram for Feature Reduction Sarunas Marciuska, Cigdem Gencel, Xiaofeng Wang, and Pekka Abrahamsson Free University of Bolzano-Bozen,
[email protected],
[email protected],
[email protected],
[email protected]
Abstract. Feature creep, if not managed well, cause software bloat. This in turn makes software applications become slower. Currently, software industry urgently requires mechanisms and approaches to reduce unnecessary or low value features. In this paper, we introduce a modelling notation, so called Feature Usage Diagram, and an approach to identify and visualize the required information for decision makers when reducing features. We conducted a case study using a real web application to validate and evaluate the Feature Usage Diagram elements and notation. The results showed that the Feature Usage Diagram is easy to learn and understand. Moreover, by visualising useful information, it has potential to support developers when making decisions for feature reduction. Key words: feature creep, feature reduction, feature usage, feature location, concern graphs, latent lattice.
1 Introduction The family of agile and lean methods have been increasingly adopted by many companies in the past decade. The main focus of these methods is to build systems in such a way that allows the software products to reach market in a shorter time and respond to changes more quickly [1]. However, feature creep [2, 3] to existing systems is a significant problem that agile and lean methods have not suggested adequate practices and techniques to tackle. In fact, recent studies [13] indicate that 30 to 50 percent of features contained in many software products have no or marginal value. Usually, such features, after being added during the life cycle, loose value in time. Unmanaged feature creep can cause software bloat [4], which in turn makes a computer application become slower and therefore, requires higher hardware capacity. Software bloat also increases cost for maintenance. One of the most recent example of software bloat is Nokia Symbian 60 smartphone platform. The feature set of the system grew so much that it was too expensive to maintain it, and therefore, it was abandoned [14]. Currently, lean start-up [5, 6] software business development methodology tackles the feature creep problem by finding a minimum viable product that contains only essential and the most valuable features. Feature driven development [30] tries to address the feature creep problem by focusing on features that
2
Sarunas Marciuska et al.
have the highest value for customers. However, not all companies start development from scratch and use feature driven development methodology. And even if they do, it is not easy to determine the value of a feature to make a decision. Therefore, there is an urgent need [14] to define mechanisms and approaches for feature reduction. To the best of our knowledge, there is no approach that deals with the feature reduction problem completely. Most of the methods and techniques in the literature could be applied to address only some parts of the problem (such as feature identification and location). Furthermore, as they were not specifically developed for feature reduction purposes, they require improvements to be useful in this context (see Section 2 for a review of these approaches). In this paper, our focus is on presenting the required information about features for informed decision making in feature reduction. We introduce an approach and a modelling notation, so-called Feature Usage Diagram, to visualise the features, their relations, and attributes (such as information about the usage of each feature by the users to indicate one dimension of value that is stated as significant [31] for feature reduction). We also present a case study which we conducted to evaluate the usefulness of the Feature Usage Diagram for feature reduction purposes in practice. This paper is structured as follows: Section 2 discusses the related work. Section 3 presents the Feature Usage Diagram. Section 4 provides details of the case study and the results. Section 6 concludes the work and gives future work directions.
2 Related Work Feature reduction involves identifying features, locating them, determining the value of each, and then systematically removing the ones with less value from the software (see Fig. 1). In this section we present the related work, which in some way deals with different parts of the feature reduction problem, even though not particularly developed for these purposes, but could be helpful for the aims of this study. We identified related studies in three areas: feature identification and location, feature usage monitoring and feature visualization. 2.1 Feature Identification and Location For feature reduction, decision makers require to know the features, their locations and relations in between. As locating features depends on identifying the features as an initial step, we present related work for feature identification and location together under this subsection. A recent systematic literature review on feature location [11] categorizes the existing techniques as below: 1. Dynamic [15, 16, 17]. These techniques use dynamic analysis to locate the features during runtime. Developers provide a scenario, and then links between different elements of the scenario are generated during runtime. As a
Feature Usage Diagram
3
Fig. 1. A Generic Feature Reduction Process
result, a graph is generated that shows which classes and methods are called for each part of the scenario. The main advantage of these techniques is that it shows exactly which parts of the code are called during the execution time. 2. Static [18, 19, 20]. These techniques use static analysis to locate features from the source code. The code is statically analysed and then the dependencies between features are explored. Finally, developers validate the nodes and connections in the graph. The main advantage of these approaches is that they do not require executing the system in order to create a dependency graph. In addition, the results present detailed information such as relations between variables and methods. 3. Textual [21, 22, 23, 24, 25]. Textual analysis examine the textual parts of the code to locate features. Developers provide query with feature descriptions and the method using information retrieval and language processing techniques checks the variables, classes, method names, and comments to locate them. The main advantage of these techniques is that they map real features to code. 4. Historical [26, 27]. Historical techniques use information from software repositories to locate features. The idea is to query features from comments, and then associate them to the lines that were changed in that commit. The
4
Sarunas Marciuska et al.
main advantage of these techniques is that they can map features to a very low granularity of the source code, that is to exact lines. Even though most of the existing techniques are promising for our purposes, none of them or their combinations provide a solution for automatic and complete feature set identification as they were not designed for this purpose from the beginning. Dynamic feature location techniques rely on user predefined scenarios, so they cannot generate a complete features set if the given scenario is not complete. Static analysis generate a set of features dependent on the source code, so they involve a lot of noise (i.e. variable names that do not represent features). Textual and historical approaches depend on the developer queries and the textual attributes of the source code. Due to these limitations of the current techniques, we decided to manually identify features and their relations for the case study presented in Section 4. 2.2 Feature Usage Monitoring Another significant information for feature reduction is the value of each feature. In this work, we focus on only one dimension of value: usage of features by users (i.e. which feature was used by whom and when). Other dimensions will be tackled in the future work. There are two commonly applied methods to monitor how users use the features of a system: 1) extend the software with code that is responsible for monitoring, or 2) design an application that intercepts all events triggered by the observed system when it is used. The main issue using the former method is that the added piece of software increases the complexity of the overall software. In addition, depending on the country where the software is used, the hidden data collection about users activities might violate the privacy laws. Existing tools that use the second approach (such as OpenSpan Desktop Analytics [9] and Google Analytics [10]) overcome afore mentioned limitations, because they do not modify the software that is being monitored. However, such tools are able to show only which applications are running on an operating system or web browser. They do not provide any details related to the feature usage. Another set of tools such as Microsoft Spy++ [8], or the method presented by Atterer et al. [7] provide detailed information on how users use a system by monitoring activities of users, such as mouse clicks and key strokes. However these tools collect too much noise, because they were not created with the aim to identify the usage of the features. For example, such tools catch the events raised by random mouse clicks which do not change the behaviour of the system. Then it becomes difficult to automatically filter out the noise and determine which unique features were executed. Having all of those limitations in mind we decided to create custom tool that identifies the feature usage in the case study presented in Section 4.
Feature Usage Diagram
5
2.3 Feature Visualization The decision makers require not only that the important information is captured, but also visualised in a proper way for practical reasons. Therefore, we reviewed related work for features visualisation. Most of this work come from software product line engineering and feature location fields. The software product line approaches visualize features by Feature Diagram [28, 29] that expresses commonality and variability within the domain (see Fig. 2). Feature Diagram shows hierarchical relations between features and displays information related to the whole product line, but not for each product. Therefore, this diagram is not useful for our purposes in this paper.
Fig. 2. Feature Diagram
Existing feature location techniques visualize the output of their result using a concern graph [19], or concept lattice [25]. The concern graph displays the classes, methods and variables of the system and their relation (see Fig. 3). However, such visualization does not represent the features that system users are using. For example, class or method might cover several features, while a variable might represent only a part of a feature. Therefore, this graph is also not useful for our purposes.
Fig. 3. Concern Graph
The concept lattice (see Fig. 4) represents not only code related parts of the system, but also concepts that can be related to the front end features. This diagrams contains two layers: feature representation layer and code representation layer. The feature layer represents the scenarios or user queries. The code layer represent the code dependencies associated to those features identified by feature location techniques.
6
Sarunas Marciuska et al.
Fig. 4. Concept Lattice
In the ideal case, the concept lattice could represent the complete features list and their relationships. However, to have only such diagram for visualizing the usage of features is not enough, because it does not include usage related attributes in the feature layer. In addition links between features are not directed (that is, users can access feature B from feature A, but not vice versa). In this study, we extended the feature layer of concept lattice in order to overcome these limitations and developed the Feature Usage Diagram.
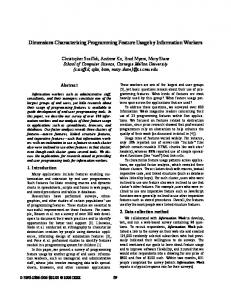
3 Feature Usage Diagram To provide the required information as an input to decision making for feature reduction in an understandable and practical way, we developed a diagram and associated notation, called the Feature Usage Diagram (see Fig. 5). Having such information visualized (i.e. relations between features, their usage and usage patterns), a decision maker can take a better decision which features to remove.
Fig. 5. Feature Usage Diagram
Feature Usage Diagram
7
The main model elements of the Feature Usage Diagram are: Feature, Feature Group, Directed Link among Features and Directed Link to Feature Group. We present each of the model elements and their attributes in the following paragraphs. 3.1 Feature Feature is one of the key elements in feature reduction. In this work we adopt the definition of feature presented by Eisenbarth et al. [12] – ”a feature is an observable unit of behaviour of a system triggered by the user”. For example, a case where a user has to enter his email, password and press login button in order to login is different from the case where system remembers his credentials and he has just to press a login button in order to login. In the first scenario we can observe that user used three features, while in the second only one, even though the final state was the same (that is, the user logged into the system). In the example provided in Fig. 5 the Feature Usage Diagram presents six features in total. Attributes of Feature Element: Each Feature has two attributes: Feature name and Feature usage. Feature Name shows the name of a Feature. Feature Usage shows how many times a Feature was used. This attribute provides one of the key information for feature reduction decision. Features that have small relative feature usage values indicate that software might need to go for feature reduction. For example, if a feature is used one hundred times while others are used millions of times, then the first feature should be considered for removal, because it has a relatively small usage in comparison to the other system features. Fig 5 shows that feature A was used 45 times, because it is indicated in its usage attribute. 3.2 Directed Link between Features Directed Link between Features represents an access path between two Features. It can be uni-directed, or bi-directed. If there is a way to access feature B from feature A and there is no way to access Feature A from Feature B it means that the link between those features is uni-directed A − > B. On the contrary, if there is a possibility to reach Feature B from Feature A and vice versa, then the link A < − > B is bi-directed. The example presented in Fig. 5 contains three bi-directed links between Feature A and Feature C, Feature D and Feature E, and Feature D and Feature F. The remaining directed links have single direction. Attributes of Directed Link between Features: Link Cardinality attribute on each Directed Link shows how many times a Feature, which the link is pointing to, was accessed from another Features. For feature reduction it provides an important information about the ways how users are using the features. It might reveal unexpected links that are not used, or are not necessary. Therefore, expert might decide to remove those links from the system. In the example provided in Fig. 5, the Link Cardinality value on the link between feature B and feature C shows that Feature B was accessed from a Feature C 17 times.
8
Sarunas Marciuska et al.
3.3 Feature Group Feature Group element is created to group Features that have the same access to the Features that are outside the group. In this way, the Feature Usage Diagram could be represented at a higher level of abstraction, and thus more understandable. The idea is based on the fact that if a system has n Features and those Features are not grouped, then in the worst case there could be n ∗ (n − 1) UniDirected Links among those Features. Therefore, each k groups of the size m reduces the worst case complexity to (n − k ∗ (m − 1)) ∗ (n − 1 − k ∗ (m − 1)) + k ∗ m∗(m−1). For example, if we have 100 Features, then in the worst case we need to consider 100 ∗ 99 = 9900 Directed Links. However, if it is possible to group those Features to 10 Feature Groups in such a way that each group contains 10 similar Features, then we need to consider only 90 + 900 = 990 Directed Links. In this case, the complexity would decrease 10 times. In the example provided in Fig. 5 there is one Feature Group named ”Feature Group A”. It contains 3 Features: Feature D, Feature E, and Feature F. Attributes of Feature Group: Group Name attribute is used to name a Feature Group. 3.4 Directed Link to Feature Group Directed Link to feature Group shows how a Feature Group is connected to other Feature Groups, or Features. These links do not have any attributes, but if the grouping would be removed then all the features of the group would inherit this link. For example, in Fig. 5 grouping container has a uni-directed link to Feature A. This means that Feature D, Feature E and Feature F have uni-directed link to Feature A as well. Obviously, by removing the Feature Group, the Feature Usage Diagram would be extended with inherited links and cardinality attributes on these links, and thus the complexity of the diagram would increase. During the case study (see in Section 4) we discovered that in some situations it is useful to draw a Cyclic bi-directed Link on the corner of a Feature Group and leave all the Features within it disconnected. It means that all Features within that group have Bi-directed Links among each other (see Fig 6 Menu Items group).
4 Case Study Conduct We conducted a case study to evaluate the Feature Usage Diagram. We selected the case application as the nextrailer.net web based movie recommender system that has 20 daily users. During the time of the case study, the system contained approximately 30 Features and 200 Directed Links between them. Our research questions were as follows: 1. RQ1: – Is the Feature Usage Diagram easy to learn and understandable to use?
Feature Usage Diagram
9
2. RQ2 – Is the Feature Usage Diagram notation complete to represent features and their dependencies (nothing is redundant or missing)? 3. RQ3: – Is the visualised information on the Feature Usage Diagram useful for decision making in feature reduction? RQ1 and RQ2 were answered in Phase 1 and RQ3 in Phase 2. We used a purposive sampling when choosing the case study participants. 12 Computer Science students (MSc and PhD students in the Free University of Bolzano) participated in the first phase of the case study. The participants were heterogenous with respect to their programming and modelling experience in industry (experience levels varied from a few years to more than ten years). Furthermore, they were from 6 different nationalities with different backgrounds. In the second phase, 3 developers of the case application were the participants of the case study. 4.1 Phase 1 In the first phase of the case study, we gave a brief introduction of the Feature Usage Diagram notation to the participants, and provided them detailed material about the notation in a printed form (see Section 3). We asked them to draw a Feature Usage Diagram for the nextrailer.net website, leaving usage and cardinality attributes empty. The participants used the Google Drawing graphical editor. During the session, we observed how the participants were modelling the given system and took notes. For each participant, we measured the time to complete the Feature Usage Diagrams. At the end of the case study we collected the diagrams. Before the case study, the first author of this paper draw the Feature Usage Diagram for the case application in order to be able to compare the relative learning time of the participants (RQ1). To investigate whether the participants understood and correctly used the notation to model the Features, Feature Group elements and Directed Links (RQ1), we introduced 3 developers of the nextrailer.net website the notation and asked them to come up with a complete and correct version of the diagram. We then compared the diagrams drawn by the participants to this version. At the end, we made an unstructured interview with each participant to answer our RQ2. 4.2 Phase 2 In the second phase, we designed a JavaScript library and inserted it in nextrailer.net website in order to fill the final complete and correct version of the Feature Usage Diagram with the usage information. The library was designed to intercept all ”on click” events raised by DOM elements that have title attribute. In the next step, the developers of the system were asked to insert unique title attributes on each element that correspond to the features. The following
10
Sarunas Marciuska et al.
information was sent to our server when the users use the system: The IP address of the user that triggers the event, the timestamp of the event, and the title attribute of the event. Having this information, we could determine which relation of the Feature Usage Diagram was executed to determine the cardinality information. For example, if Feature B is triggered after Feature A, then we draw a uni-directed link from Feature A to Feature B and increased the cardinality value for the link. We collected usage data for 30 days. Then we wrote a script that parsed the database and computed the usage information for each feature (links between features and cardinality of the links). Later, we inserted these information to the correct version of Feature Usage Diagram and interviewed the developers to answer RQ3.
5 Results and Analysis Phase 1: Our first observation was that the participants did not use the additional material about the notation provided before the case study saying that the short introduction given at the beginning of the session was sufficient. On average, it took 25-30 minutes to complete the Feature Usage Diagrams of the nextrailer.net website. There was not high variation among the completion time per participant and the participants used only 5-10 minutes more than the first author of this paper who completed the same task in about 20 minutes. These indicated that the Feature Usage Diagram notation was easy to learn (RQ1). After reviewing the collected Feature Usage Diagrams from the participants, we observed that all the participants could identify the Features and Feature Groups. However, most of the diagrams were missing a number of Directed Links between Features (20-30 percent). In addition, some of the models contained few non exiting links. When we interviewed the participants to investigate the reasons, they reported that these were analysis mistakes and therefore not related to any misunderstanding about the introduced notation. Thus, we concluded that the Feature Usage Diagram notation is understandable to use (RQ1). Then we interviewed the participants by asking whether the elements of the Feature Usage Diagram were complete for representing the Features and their relations (RQ2). A few participants suggested using the same notation for the Directed Links to Features and the Directed Links to Feature Groups as they thought these links were redundant. We explained that the attributes on the Directed Links will be populated during the second phase based on which links are abstracted and will be inherited, and which represent the lowest granularity. Then the participants agreed with using different notation for these elements. Some of the participants reported that most of the Features in the Feature Groups were connected with each other with Bi-directed Links and a special notation for such situations would be more practical. During the case study one participant added Cyclic Bi-directed Link on a Feature Group, meaning that all Features inherit this link (see Fig 6 Menu Items group). We decided
Feature Usage Diagram
11
to incorporate this suggestion in the Feature Usage Diagram notation (see in Section 3.4). The biggest challenge reported by the participants was to model Features that change state (that is, in some case Features and their Links are visible at the website, while in other cases they are hidden). In this situation, we suggested to model Features as if they are always visible, because the state of a Feature can be detected by analysing the usability scenarios. For example, if such a Feature is used it means that all scenarios when this Feature is hidden should be excluded. In addition, several participants mentioned that a modelling tool support would be much more practical. They indicated that such a tool could verify whether the Feature Usage Diagram contains duplicates as well. Moreover, they stated that a tool could allow to collapse the elements to show the relationship between Features and Feature Groups at a higher granularity level or expand them to see at a lower granularity. And by means of a tool, they said that it would also be possible to partially automatically generate the Feature Usage Diagram from the website, which then would require validation by the developers. Phase 2: The fragment of the final version of the Feature Usage Diagram agreed upon by the developers at the beginning of Phase 2 is presented in Fig. 6. The fragment of this diagram populated with the usage information attributes is presented in Fig. 7.
Fig. 6. Fragment of nextrailer.net Feature Usage Diagram chosen by developers
During the interviews, all developers mentioned that the Feature Usage Diagram would be very useful for making a decision for feature reduction (RQ3). However, they also added that there were other aspects of value which should
12
Sarunas Marciuska et al.
Fig. 7. Fragment of nextrailer.net Feature Usage Diagram with usage attributes
be taken into account as well. For example, the features Login and Report are valuable for the company as these collect important information for the company, but these features are not used by many users. In addition, the developers pointed out that a Feature could appear to be rarely used if it is hidden and is not easy to notice. Nevertheless, the developers said that having such information is very useful for value maximisation reasons by relocating those features to other places. Finally, the developers added that cardinality information is important to understand usage patters and having such information would help in making decisions for how to modify a system, generating more value and understanding the impact of such modifications. 5.1 Threats to Validity We discuss the validity threats of this study according to the categorization suggested by Runeson and Host for case studies [32]: 1) Construct validity, 2) Internal validity, 3) External validity, and 4) Reliability. Construct Validity. Construct validity refers to what extent the operational measures represent what is investigated according to the research questions. To answer the RQ1, we measured the time spent by each participant to learn the notation and draw the Feature Usage Diagram for the case application. One possible threat could have been previous knowledge of some participants which could affect the learning time. Therefore, none of the participants were introduced to the Feature Usage Diagram before the case study conduct. In order to measure how easy to learn the notation, we compared the amount of time spent by each participant to that of the first author of this paper to get a relative figure. Another potential threat was due to how we evaluated the model elements in the Feature Usage Diagrams drawn by the participants. We compared the results
Feature Usage Diagram
13
to a correct and complete version agreed upon by the developers of the case application. Here, one validity threat could have been if the agreed upon version would have had errors. To mitigate this threat we used subject triangulation, that is we asked 3 developers to separately draw the Feature Usage Diagrams, and then by cross-checking to come up with a final agreed version. Another validity threat could have been that the participants interpreted the interview questions not in the same was as the researchers really meant. To mitigate this, we had a discussion with each participant about what we meant by each term we used in our questions (e.g ’usefulness’ in RQ3). Internal Validity. Internal validity concerns the causality relation between the treatment and the outcome, and whether the results do follow from the data. In our case, one threat could have been related to background of participants of the study. We chose the participants by making a background check to ensure that that they have minimum skills in Computer Science to be able to understand the concepts. We could not totally control the domain knowledge of the participants that could have an effect on the time spent for task completion. However, as there was not a high variation among the participants, we believe that this did not affect the results of this study significantly. External Validity. External validity refers to what extent it is possible to generalise the findings to different or similar contexts. One validity threat could have been the small number of participants in the sample. As the participants selected were heterogeneous with respect to their programming and modelling experience in industry, we believe that the results of this study can be generalized to some extent. On the other hand, as we conducted only one case study using a web application, we do not know how much the results are generalisable to other type of applications. Further case studies are required. Reliability. Reliability reflects to what extent the data and the analysis depend on the specific researchers. Two of the operational measures used in this study are objective. Therefore, we do not see a validity threat for the interpretation and analysis of these measures. However, a validity threat might have been due to interpretation of the answers of the participants. To mitigate this threat, we validated with each participant how we interpreted their answers.
6 Conclusions In this paper, we introduce a new diagram to visualise the Features, their relationships and their usage information. The results of the case study indicates that the Feature Usage Diagram elements and notation is easy to learn by novice users. The features and and their dependencies could be captured completely following the notation. Furthermore, the case study showed that the Feature Usage Diagram has potential to aid developers in decision making for feature reduction purposes as
14
Sarunas Marciuska et al.
information on usage of the features is stated to be one of the important value aspects of features. As future work, we plan to investigate other aspects of feature value and extend the Feature Usage Diagram to incorporate these aspects as well. We will explore how usage can be maximized by relocating features in different places of a system. We will analyse the challenges faced to apply feature Usage Diagram to big systems with a high number of features. In addition, we aim to develop a tool to support developers when drawing Feature Usage Diagrams. In addition, we will explore the ways how to automatically generate a part of the diagram.
References 1. Highsmith, J. A.: Agile software development ecosystems. Addison-Wesley Professional (2002) 2. Davis, F.D., Venkatesh, V.: Toward preprototype user acceptance testing of new information systems: implications for software project management. In: IEEE Transactions on Engineering Management (2004) 3. Senyard, A., Michlmayr, M.: How to have a successful free software project. In: Proceedings of the 11th Asia-Pacific Software Engineering Conference, pp. 84-91 (2004) 4. Xu, G., Mitchell, N., Arnold, M., Rountev, A., Sevitsky, G.: Software bloat analysis: Finding, removing, and preventing performance problems in modern large-scale object-oriented applications. In: Proceedings of the FSE/SDP workshop on Future of software engineering research (2010) 5. Ries, E.: The Lean Startup: How Today’s Entrepreneurs Use Continuous Innovation to Create Radically Successful Businesses. In: Journal of Product Innovation Management (2011) 6. Taipale, M.: Huitale A Story of a Finnish Lean Startup. In: Lecture Notes in Business Information Processing, pp. 111-114 (2010) 7. Atterer, R., Wnuk, M., Schmidt, A.: Knowing the user’s every move: user activity tracking for website usability evaluation and implicit interaction. In: Proceedings of the International Conference on World WideWeb (2006) 8. Microsoft Spy++, http://msdn.microsoft.com/en-us/library/aa264396(v=vs. 60).aspx. Last visited on the 27th of November 2012. 9. OpenSpan Desktop Analytics, http://www.openspan.com/products/desktop_ analytics. Last visited on the 27th of November 2012. 10. Google Analytics, http://www.google.com/analytics. Last visited on the 27th of November 2012. 11. Dit, B., Revelle, M., Gethers, M., Poshyvanyk, D.: Feature Location in Source Code: A Taxonomy and Survey. In: Journal of Software Maintenance and Evolution: Research and Practice (2011) 12. Eisenbarth, T., Koschke, R., Simon, D.: Locating Features in Source Code. In: IEEE Computer (2003) 13. Ebert, C., Dumke, R.: Software Measurement. Springer (2007) 14. Ebert, C., Abrahamsson, P., Oza, N.: Lean Software Development. In: IEEE Software, pp. 22-25 (2012)
Feature Usage Diagram
15
15. Eisenberg, A. D., De Volder, K.: Dynamic Feature Traces: Finding Features in Unfamiliar Code. In: Proceedings of 21st IEEE International Conference on Software Maintenance, Budapest, Hungary, pp. 337-346 (2005) 16. Bohnet, J., Voigt, S., Dollner, J.: Locating and Understanding Features of Complex Software Systems by Synchronizing Time, Collaboration and Code-Focused Views on Execution Traces. In: Proceedings of 16th IEEE International Conference on Program Comprehension, pp. 268-271 (2008) 17. Edwards, D., Wilde, N., Simmons, S., Golden, E.: Instrumenting Time-Sensitive Software for Feature Location. In: Proceedings of International Conference on Program Comprehension, pp. 130-137 (2009) 18. Chen, K., Rajlich, V.: Case Study of Feature Location Using Dependence Graph. In: Proceedings of 8th IEEE International Workshop on Program Comprehension, pp. 241-249 (2000) 19. Robillard, M. P., Murphy, G. C.: Concern Graphs: Finding and describing concerns using structural program dependencies. In: Proceedings of International conference on software engineering, pp. 406-416 (2002) 20. Trifu, M.: Using Dataflow Information for Concern Identification in ObjectOriented Software Systems. In: Proceedings of European Conference on Software Maintenance and Reengineering, pp. 193-202 (2008) 21. Petrenko, M., Rajlich, V., Vanciu, R.: Partial Domain Comprehension in Software Evolution and Maintenance. In: International Conference on Program Comprehension (2008) 22. Marcus, A., Sergeyev, A., Rajlich, V., Maletic, J.: An Information Retrieval Approach to Concept Location in Source Code. In: Proceedings of 11th IEEE Working Conference on Reverse Engineering, pp. 214-223 (2004) 23. Grant, S., Cordy, J. R., Skillicorn, D. B.: Automated Concept Location Using Independent Component Analysis. In: Proceedings of 15th Working Conference on Reverse Engineering, pp. 138-142 (2008) 24. Hill, E., Pollock, L., Vijay-Shanker, K.: Automatically Capturing Source Code Context of NL-Queries for Software Maintenance and Reuse. In: Proceedings of 31st IEEE/ACM International Conference on Software Engineering (2009) 25. Poshyvanyk, D., Marcus, A.: Combining formal concept analysis with information retrieval for concept location in source code. In: Program Comprehension, pp. 37-48 (2007) 26. Chen, A., Chou, E., Wong, J., Yao, A. Y., Zhang, Q., Zhang, S., Michail, A.: CVSSearch: searching through source code using CVS comments. In: Proceedings of IEEE International Conference on Software Maintenance, pp. 364-373 (2001) 27. Ratanotayanon, S., Choi, H. J., and Sim, S. E.: Using Transitive changesets to Support Feature Location. In: Proceedings of 25th IEEE/ACM International Conference on Automated Software Engineering, pp. 341-344 (2010) 28. Benavides, D., Trinidad, P., and Ruiz-Cortes, A.: Automated reasoning on feature models. In: Advanced Information Systems Engineering, pp. 381-390 (2005) 29. Czarnecki, K., Helsen, S., and Eisenecker, U.: Staged configuration using feature models. In: Proceedings of the Third International Conference on Software Product Lines, 162-164 (2004) 30. Palmer, S. R., and Felsing, M.: A practical guide to feature-driven development. Pearson Education (2001) 31. Smith, J. B., and Colgate, M.: Customer value creation: a practical framework. In: The Journal of Marketing Theory and Practice, pp. 7-23 (2007) 32. Runeson, P., and Host, M.: Guidelines for conducting and reporting case study research in software engineering. In: Empirical Software Engineering, 131-164 (2009)