systems Article
Feedback-Based Eco-Design for Integrating the Recency, Frequency, and Monetary Value of Eco-Efficiency into Sustainability Management Rui Yang Chen Department of Business Administration, No.32, Zhenli Street, Danshui District, Aletheia University, New Taipei City 25103 , Taiwan;
[email protected]; Tel.: +886-2-2621-2121 Academic Editor: Paul G. Ranky Received: 30 June 2016; Accepted: 5 August 2016; Published: 14 September 2016
Abstract: Customer feedback is used to understand customer requirements. Early design phases require the consideration of items including manufacturing, the environment, and sustainability management. Therefore, it is crucial that eco-efficiency is taken into account in the early design phases. Traditionally, eco-efficiency is considered only in terms of eco-design issues, not customer requirements based on business values such as Recency, Frequency, and Monetary (RFM) value. In the meantime, integrating innovation from eco-design is one important aspect. Here, I propose that customer feedback-based eco-efficiency and TRIZ-based innovation can be considered in early eco-design based on the RFM value for sustainability management. The analytic hierarchy process (AHP) and fuzzy-based AHP were integrated to explore the relative weights of RFM variables for business value evaluation. The innovative method of the paper is using a TRIZ contradiction matrix associated with engineering parameters for eco-design. The experimental study has been carried out, and it meets the forecasting business value for green product usage. The business value was used as the decision-making factor in order to evaluate both environmental and marketing performance. Keywords: sustainability; eco-efficiency; TRIZ; QFD; eco-design
1. Introduction In recent years, with the rapid development of technology, new electronic products have been promoted to lead to a high level of consumer convenience and entertainment. However, the serious damage to the environment and resource waste during the process of production should never be neglected. The waste caused by profligate energy and resource consumption seriously damages the environment and results in problems such as the greenhouse effect [1,2], etc. Since past studies tended to focus on product design and manufacturing’s effects in relation to environmental laws, instead of the influence of green products on the 3Rs (Reduce, Reuse, and Recycle) [3,4] and customer feedback, it is difficult to know the reasons for products’ negative effects and improve them. Customer feedback is used to understand customer requirements. Early design phases require the consideration of items including manufacturing, the environment, and sustainability management [5]. The environmental aspects of a product have to be considered in order to explore eco-products with other business values. Therefore, it is crucial that eco-efficiency is taken into account along with business value in the early design phases. Some studies apply a number of assessment methods in order to evaluate environmental impact. Although many aspects of environmental impact used in production [6] have already been investigated, the indicator of environmental impact is still rare. Bovea and Belies [7] discussed eco-design tools to evaluate environmental impact in the product design process. A systematic method was used to explore a quantitative analysis of life cycle assessment (LCA) [8]. In accordance with eco-efficiency principles,
Systems 2016, 4, 30; doi:10.3390/systems4030030
www.mdpi.com/journal/systems
Systems 2016, 4, 30
2 of 15
engineering solutions have implemented both waste management and green product development through LCA [9]. The previous studies proposed a business process reengineering method that could enhance the use of the LCA approach in early design phases [10]. Using an LCA and cost analysis, they aimed to determine the lowest environmental impact [11]. Previous research has shown that multi-criteria decision analysis is an effective method of waste management decision-making [12]. In our analysis of the literature on green product development, we distinguish three issues: (i) customer feedback problems; (ii) product innovations; and (iii) eco-efficiency. According to customer feedback, environmental impact is a major problem that must be taken into account by R&D [13]. Roome [14] built environmental consideration into an R&D strategy. Customer feedback is used to understand customer requirements. The research on reverse logistics and a closed-loop supply chain taking into account customer feedback is growing rapidly. Product innovators are people who bring something new to product design. Typical new product development generally involves stages such as planning, concept design, detail development, prototype, production, market launch, and product review. The innovation and environmental impact of a new product are emphasized. This accelerates eco-innovation by integrating case-based reasoning and the TRIZ method [15]. In general, eco-innovations focus on reducing the environmental impact due to production and consumption process. The definition of eco-innovation is identified by European Commission [16]. A design engineer trying to solve a customer complaint usually faces conflict and systematic incompatibility. Traditionally, the design engineer compromises to address customer complaints. Park and Kim [17], Trappey et al. [18] and Kim et al. [19] have proposed analyzing both customer requirements and product design. The eco-design engineers avoid recurring problems and research new strategies for eco-efficiency in related fields. Some of the literature reviews discussing environmental strategy selection are by Krikke et al. [20], Linton [21], and Wu [22]. Sousa and Wallace [23] developed an automated classification system to guide a systematic identification of life cycle assessment, based upon environmental categories for different groups of products. Few literature reviews mention that green products must meet 3R value. The 3R value of green product innovation is very crucial because of the eco-design. Past studies develop mathematical models to maximize profit, and the market segmentation strategy is very important [24]. Waste management decision-making is explored with a weighted sum model to evaluate the trade-offs [25]. This previous study attempted to explore a quantitative evaluating model of construction waste management using a system dynamics method [26]. The objective of this paper is to recover as much business value as possible, and to reduce the overall quantities of waste produced using eco-efficiency measures such as the 3Rs. This proposed approach was used to evaluate the Recency, Frequency, and Monetary (RFM) value of sustainability management in early eco-design. In the abovementioned situation, there is a need to develop innovative green product procedures based on 3R value. TRIZ was identified in the former Soviet Union by Alltshuller [27]. The problem-solving process is based on the TRIZ contradiction matrix. Silverira [28] used the design trade-offs in the conflicting performance conditions for manufacturing fields. Fresner et al. [29] used TRIZ in cleaner production to minimize industrial waste. However, customers may experience observation uncertainty and fuzzy uncertainty. Fuzzy sets were introduced by Zadeh [30]. Fuzzy uncertainty is the main focus of this paper. Electronic waste (e-waste) is an emerging pollution problem [31–33]. A previous paper proposed several tools in e-waste management [34]. These tools represent a systematic approach to improving the environmental performance of products [35,36]. In this article, a case study was used to discuss the proposed method. It concerns an electronic product such as a notebook computer. 2. Material and Methods 2.1. RFM Hughes [37] used an RFM scoring method to cluster five customer groups. Stone [38] presented the relative weights method using RFM variables. The RFM was defined by Bult and Wansbeek
Systems 2016, 4, 30
3 of 15
in marketing research [39]. Based on the RFM value, marketing performance can be clustered into different groups. Chang and Tsai [40] proposed a new framework called GRFM (group RFM) to evaluate the calculation of the RFM value’s significance. Variants of RFM-based predictive models are constructed in the context of customer segmentation for customer response models [41]. Cheng and Sun [42] proposed a strategy framework to provide different usage analysis using the RFM model. Some previous studies have extended the original RFM model by considering response techniques [43]. Some previous studies used the sequential pattern mining procedure including the RFM analysis [44]. 2.2. Fuzzy Membership Function In fuzzy set theory, a fuzzy subset of the universe of discourse U is described by a membership function U A (u): U: [0, 1], which represents the degree to which A ∈ U belongs to the set A in Figure 1. A fuzzy term such as U is a linguistic value.
Figure 1. Fuzzy membership functions.
2.3. Eco-Efficiency Eco-efficiency has been proposed as an approach to attaining sustainable development [45]. It is more like a management method than an indicator of environmental impact efficiency. One of the definitions is given by Equation (1): Eco − efficiency = product or service value/environmental impact.
(1)
Eco-efficiency can be used as an evaluated indicator in eco-design [46]. Eco-design includes green design, design for X (where X might be low environmental impact), and green product design. The WBCSD (World Business Council for Sustainable Development) has classified seven major eco-efficiency elements: A–G. Liu and Chen [47] proposed the relationship between 39 engineering parameters and eco-efficiency. A B C D E F G
Material reduction (Reduce the material intensity of goods and service, units of material per unit of economic value). Energy reduction (Reduce the energy intensity of goods and services, units of energy per unit of economic value). Toxicity reduction (Reduce toxic dispersion, units of toxicity per unit of goods). Material recyclables (Enhance material recyclability, units of re-usage per unit of material). Resource sustainable (Maximize sustainable use of renewable resources, units of re-usage per unit of renewable material). Product durability (Extend product durability, usage lifetime per unit of product and services). Product service (Increase the service intensity of goods and services, units of service function per unit of product and services).
Systems 2016, 4, 30
4 of 15
Systems 2016, 4, x Systems 2016, 4, x
4 of 14 4 of 14
2.4. TRIZ The Orloff [48] and Moehrle [49] proposed TRIZ method into the process industry with the The Orloff [48] and Moehrle [49] proposed[50,51]. TRIZ method into the process industry with the contradictions and Moehrle 40 inventive The contradictions matrix industry is partly shown in The Orloffmatrix [48] and [49]principles proposed TRIZ method into the process with the contradictions matrix and 40 inventive principles [50,51]. The contradictions matrix is partly shown in Figure 2 [52]. matrix and 40 inventive principles [50,51]. The contradictions matrix is partly shown in contradictions Figure 2 [52]. Figure 2 [52].
Figure 2. TRIZ matrixes [52]. Figure 2. TRIZ matrixes [52]. Figure 2. TRIZ matrixes [52].
2.5. AHP 2.5. AHP 2.5. AHP The analytic hierarchy process (AHP) method is a hierarchy decision-making method to solve The hierarchy process method is aa hierarchy decision-making method to The analytic analytic hierarchy process (AHP) (AHP) method hierarchy decision-making method to solve solve complex problems with alternative evaluation byis Saaty [53]. The AHP explore the pair-wise complex problems with alternative evaluation by Saaty [53]. The AHP AHP explore explore the pair-wise complex problems with alternative evaluation by Saaty [53]. The the pair-wise comparison matrix [54]. However, the weights for performance indices are not judged the same by comparison matrix [54]. [54]. However, However,the theweights weightsfor forperformance performance indices judged the same comparison matrix areare notnot same by different experts. Thus, the fuzzy number is suggested for AHPindices analysis, and isjudged called the fuzzy AHP by different experts. Thus, the fuzzy number is suggested for AHP analysis, and is called fuzzy different experts. Thus, the fuzzy number is suggested for AHP analysis, and is called fuzzy AHP [55,56]. Based on Saaty’s experience, AHP can be used in the problem types as follows: Setting AHP [55,56]. Based on Saaty’s experience, AHP used in the problem as follows: [55,56]. Based Saaty’s experience, AHP Determining can be can usedbein the problem types astypes follows: Setting Priorities, , theonBest Policy Alternatives, Requirements, Predicting Results—Risk Setting Priorities, , the Best Policy Alternatives, Determining Requirements, Predicting Results—Risk Priorities, , and the Conflict Best Policy Alternatives, Determining Requirements, Predicting Results—Risk Assessment, Resolution. Assessment, Assessment, and and Conflict Conflict Resolution. Resolution. 2.6. MIR 2.6. MIR 2.6. MIR The MaturityIndex Indexonon Reliability (MIR) is explored to discover the response of a business The Maturity Reliability (MIR) is explored to discover the response of a business process The Maturity Index on Reliability (MIR) is explored to discover the response of a business process to take action if the right information on process output is available [57]. The Maturity Index to take action ifaction the right information on process output is available [57]. [57]. The The Maturity Index on process to takeconsists ifofthe right information on process output is available Maturity Index on Reliability five levels and is shown in Figure 3. Reliability consists of five levels and is shown in Figure 3. on Reliability consists of five levels and is shown in Figure 3.
Figure 3. The MIR MIR process. process. Figure 3. The Figure 3. The MIR process.
3. Eco-Innovation Design Procedure 3. Eco-Innovation Design Procedure
Systems 2016, 4, 30
5 of 15
Systems 2016, 4, x
5 of 14 5 of 14
3. Eco-Innovation Design Procedure Systems 2016, 4, x
The proposed proposed eco-innovation eco-innovation design approach is shown in Figure Figure 4, 4, which which consists consists of of three three The Thecustomer proposedfeedback eco-innovation designproblem approach is shown inTRIZ-based Figure 4, which consists function of three phases: problem & purchasing, purchasing, TRIZ-based QFD (quality (quality function phases: with product & QFD phases: customer witheco-efficiency product problem & purchasing, TRIZ-based QFD (quality function development), andfeedback RFM-based eco-efficiency phases. development), and RFM-based phases. development), and RFM-based eco-efficiency phases.
Figure 4. 4. The proposed eco-innovation eco-innovation design design procedure. procedure. Figure 4. The proposed eco-innovation design procedure.
3.1. Phase I 3.1. 3.1. Phase I The customer customer feedback feedback product problem & purchasing purchasing phase phase is is to to understand understand green green product product The The customer feedback product problem &on purchasing phase isfeedback to understand green product problems so-called maturity index reliability model was explored in problems for user. The The so-called maturity index on reliability(MIR) (MIR)feedback model was explored problems for user. The so-called maturity index on reliability (MIR) feedback model was explored in order to see whether the the right information reaches thethe right activity at the right moment in time. The in order to see whether right information meets right activity at the right moment in time. order to see whether thelevels right information reaches the right activity at the right moment in time. The MIRMIR scale uses fourfour levels to assess thethe quality ofof information ininidentified loops. We the MIR MIR The scale uses to assess quality information identified loops. We use use MIR scale uses four levels to assess the quality ofenvironmental information inimpact. identified We use scale the MIR model in this this eco-efficiency and business value for for environmental impact. Onloops. this four-level four-level scale the model in eco-efficiency and business value On this the model in this eco-efficiency and business value for environmental impact. On this four-level scale the MIR level level is is described described as as follows: follows: MIR MIR level is described as follows: MIR level level 1: 1: How How well well has has eco-efficiency eco-efficiency been been integrated integrated into into the the business business plan? plan? MIR MIR well haseco-efficiency, eco-efficiencywith beenthe integrated the business plan? MIR level level 1: 2: How The relevant ability tointo infer the business value, can be identified. MIR level 2: The relevant eco-efficiency, with the ability to infer the business value, can be identified. MIR withbusiness the ability to infer business value, caneco-efficiency. be identified. MIR level level 2: 3: The The relevant inferenceeco-efficiency, root effect of the values can the be determined by the MIR level 3: The inference root effect of the business values can be determined by the eco-efficiency. MIR level 3: The inference root effect of the business values can be determined by the eco-efficiency. MIR level 4: Adequate measures to analyze the business value can be identified. MIR MIR level level 4: 4: Adequate Adequate measures measures to to analyze analyze the the business business value value can can be be identified. identified. The feedback-based model on MIR is given in Figure 5. Eco-efficiency can be used to quantify The feedback-based feedback-based modelon onMIR MIRisisgiven giveninin Figure Eco-efficiency be used to quantify model Figure 5. 5. Eco-efficiency cancan be used to quantify the the business value. the business value. business value.
Figure 5. The feedback-based model of MIR. Figure 5. The feedback-based model of MIR.
The problem elements from customer feedback are described as follows. A problem is described The problem elements from customer feedback are described as follows. A problem isindescribed as a collection of symptoms as tocustomer the cause feedback of the problem. The value of symptoms showsis the high The problem elements from are described as follows. A problem described as a collection of symptoms as to the cause of the problem. The value of symptoms shows in the high (H), medium (M), or low (L). as a collection of symptoms as to the cause of the problem. The value of symptoms shows in the high (H), medium (M),phase or low (L). to explore the influences of customer purchasing on the 3Rs (Reduce, Further, (M), this (H), medium or lowintends (L). Further, this phase intends customer to explore the influences of customer on the 3Rs (Reduce, Reuse, and Recycle). Through a MIR (Maturitypurchasing Index on Reliability) is Further, this phase intends to explorefeedback, the influences of customer purchasing on the 3Rs model (Reduce, Reuse, and Recycle). Through customer feedback, a MIR (Maturity Index on Reliability) model is constructed to generalize the factors influencing purchases. The analyzes Reuse, and Recycle). Through customer feedback,customers’ a MIR (Maturity Index onresearch Reliability) modelthe is constructed to generalize the factors influencing customers’ The research analyzes the influences of customer purchasing on the 3Rs (Reduce, purchases. Reuse, Recycle) through an AHP influences of customer purchasing on the 3Rs (Reduce, Reuse, Recycle) through an AHP questionnaire. questionnaire. 3.2. Phase II 3.2. Phase II
Systems 2016, 4, 30
6 of 15
constructed to generalize the factors influencing customers’ purchases. The research analyzes the influences of customer purchasing on the 3Rs (Reduce, Reuse, Recycle) through an AHP questionnaire. Systems 2016, 4, x
6 of 14
3.2. Phase II
TheTRIZ-based TRIZ-basedQFD QFD(quality (qualityfunction functiondevelopment) development)phase phaseisisto to establish establish an an eco-innovation eco-innovation The design, which is utilized for converting customers’ eco-efficiency into an eco-innovative product design, which is utilized for converting customers’ eco-efficiency into an eco-innovative product function.Here, Here, a conflict the (Voice VOE of (Voice of Engineering) item appropriate requires appropriate function. a conflict with with the VOE Engineering) item requires problemproblem-solving find an innovative The innovative comes thematrix TRIZ matrix solving to find antoinnovative solution.solution. The innovative solutionsolution comes from thefrom TRIZ using using conflict cross-parameters. The relationship of cross-parameters expressedusing usingfuzzy fuzzy conflict cross-parameters. The relationship of cross-parameters is tois to be be expressed representation.This Thisphase phaseconsists consistsof ofthe thefollowing followingsub-steps. sub-steps. representation. Step 1:1: An Aneco-design eco-designengineer engineerconstructs constructs aa QFD QFD matrix matrix from from customer customer feedback feedback with with Step environmentalperspectives perspectivesand andthe theeco-design eco-designspecifications specificationsof ofaa green green product. product. In Inthis thisstep, step,the the environmental VOEitems itemsare areutilized utilizedto todescribe describethe theenvironmental environmentalaspects. aspects.In Inthis thisway, way,QFD QFDisisan aneffective effectivetool toolfor for VOE product specification to customer requirements in the early product design phase. The QFD consists product specification to customer requirements in the early product design phase. The QFD consists ofcustomer customercharacteristics characteristicsitems itemssuch suchas asVOC VOC(Voice (Voiceof ofCustomer) Customer)items itemsand andquality qualitycharacteristics characteristics of itemssuch suchas asVOE VOEitems, items,and andthe the top top matrix matrix with with the the relationships relationships between between VOE VOE items. items. The TheVOC VOC items itemsare aredivided dividedinto intothree threecategories categoriesaccording accordingto tothe the3Rs 3Rsin inFigure Figure6.6.At Atthis thistime, time,the thedegrees degreesof of items importanceof ofthe therelationships relationshipsbetween betweenVOC VOCand andVOE VOEare aredetermined determinedon onthe thegreen greenproduct productneeds needs importance andenvironmental environmentalimpact. impact. and
Figure Figure6.6.QFD QFDmatrix. matrix.
Step Step2:2:Analyze Analyzethe theVOE VOEitems itemsfor for conflicting conflictingfeatures featuresamong amongthem themusing usingaa TRIZ TRIZ contradiction contradiction matrix. It determines what features are necessary to reduce the environmental impact. Consequently, it matrix. It determines what features are necessary to reduce the environmental impact. Consequently, determines what features enhance eco-efficiency. The TRIZ matrix is named the prioritized fuzzy it determines what features enhance eco-efficiency. The TRIZ matrix is named the prioritized fuzzy relative relativematrix, matrix,expressed expressedasasa afuzzy fuzzyset setvalue. value. The The matrix matrix isis used used to to determine determine the the “improving “improving engineering engineering parameters,” parameters”, the the “worsening “worsening engineering parameters,” and the “inventive principles” in Figure 2. When a new is engineering parameters”, and the “inventive principles” in Figure 2. When a new product isproduct developed, developed, themay designers may face conflicts related to the function of the product. At that the designers face conflicts related to the function of the product. At that moment, the moment, designers the designers can verify which function conflict they are faced with and identify the critical point of can verify which function conflict they are faced with and identify the critical point of the problem. the problem. Following the 39 items of TRIZ engineering parameters, the designers can determine the Following the 39 items of TRIZ engineering parameters, the designers can determine the parameters parameters want to improve the relative parameters that will worsen. Afterlooking lookingup up the the TRIZ they want they to improve and theand relative parameters that will worsen. After TRIZ contradictory matrix, designers can obtain possible inventive principles. With further analysis, the designers can then quickly identify the root cause of the problem and the best solution. Step 3: Integrating eco-efficiency elements into QFD with a TRIZ matrix. From the environmental impact, this performance can be divided into three improvements such as recycling, reuse, and reduction. Recycling includes eco-efficiency element D. Reuse includes eco-efficiency elements E, F, and G. Reduction includes eco-efficiency elements A, B, and C. Therefore, all elements
Systems 2016, 4, 30
7 of 15
contradictory matrix, designers can obtain possible inventive principles. With further analysis, the designers can then quickly identify the root cause of the problem and the best solution. Step 3: Integrating eco-efficiency elements into QFD with a TRIZ matrix. From the environmental impact, this performance can be divided into three improvements such as recycling, reuse, and reduction. Recycling includes eco-efficiency element D. Reuse includes eco-efficiency elements E, F, and G. Reduction includes eco-efficiency elements A, B, and C. Therefore, all elements of improving eco-efficiency are integrated with the variables of the 3Rs. One of the objectives of this study is to determine the correlation between TRIZ 10 engineering parameters and eco-efficiency elements in Table 1. However, it did not identify the priority of each parameter. In this paper, the priority is identified by the method of fuzzy membership function. It means that different priorities—H (High), M (Middle), and L (Low)—will be applied into the mentioned correlation. Table 1. Correlation of eco-efficiency elements and engineering parameters.
TRIZ Engineering Parameters
Eco-Efficiency Elements A
B
C
D
E
F
G
#1–39
3.3. Phase III The RFM-based QFD 10phase is to establish eco-efficiency based on RFM value in order to quantify the so-called business value. Their RFM values are defined as follows: R measures how long they have been using the green product; F measures how frequently they use the green product; M measures how much money they spent. The RFM values were normalized as follows: R0 = ( R − RS )/( R L − RS )
(2)
where R0 and R represent the 1normalized and original recency values; R L represents the largest value of all numbers; and RS represents the smallest value of all numbers. The RFM values of each cluster were normalized, and denoted as R0 , F 0 , and M0 . Let WI , inferred by the implications, be the integration of the cluster. They are computed as the weighted sum of R0 , F 0 , and M0 as follows: WI = WR R0 + WF F 0 + WM M0 (3) where WR , WF , and WM are the relative importance of the RFM variables. We use an AHP or fuzzy AHP in the relative importance of the RFM variables. The AHP method was used to determine the relative importance of the RFM variables, R0 , F 0 and M0 . Data were gathered by interviewing the evaluators from customer feedback for VOC items of the 3R categories using a questionnaire with a scale of importance such as 1 (Equally), 3 (Weak), 5 (Strong), and 7 (Extreme). When using AHP analysis for evaluation, it is easy to find the weight of each performance index subjectively. However, the weights for performance indices are not the same from different experts. Thus, the fuzzy number is suggested for AHP analysis, and is called fuzzy AHP. Data were gathered by interviewing the evaluators from customer feedback for VOC items of the 3R categories using a questionnaire with triangular fuzzy number scale importance such as (0.5, 1, 2.5) (Equally), (1.5, 3, 4.5) (Weak), (3.5, 5, 6.5) (Strong), and (5.5, 7, 8.5) (Extreme). These data are expressed in the form of a pair-wise comparison matrix such as R:F = 2.3, R:M = 3.9, and F:M = 1.7 according to best fit for consistency. According to the evaluation, the relative weights of the RFM variables are 0.591, 0.257, and 0.151, respectively.
Systems 2016, 4, 30
8 of 15
4. Case Study A case study was used to discuss the proposed approach. It concerns a notebook computer retailing company. 4.1. Phase I: Customer Feedback Product Problem & Purchasing phase This phase consists of the following two sub-steps: Step 1: Customer feedback The proposed eco-innovation design procedure will be presented with a customer complaint for the notebook computer case. Eco-innovation considers both the R&D thinking and the environmental impact. In the notebook computer case, this is a problem. The notebook computer suddenly stopped working, according to a customer’s vague description. The customer does not understand why this has happened or how to handle it. For the maintenance engineer, he must continuously rule out errors to find the cause of the problem in order to solve it. The R&D designer needs to develop a new product that responds to this problem and avoids recurring problems. In this case, four problem elements are chosen: “power light extinguished”, “shut down”, “M” (Middle), and “power empty”. Step 2: Customer feedback product purchasing Systems 2016, 4, Based onx
of 14 the MIR model, literature review, and expert interviews, this study constructs an 8AHP model and uses a notebook computer as an example to probe the influences of notebook computer The proposed eco-innovation design procedure will be presented with a customer complaint for purchase on the 3Rs from customers’ perspective. An AHP framework of customers’ perspective is the notebook computer case. Eco-innovation considers both the R&D thinking and the environmental shown as Figure 7 from the MIR model. impact. In the notebook computer case, this is a problem. The notebook computer suddenly stopped working, to atarget customer’s vague description. Theimpact customer does3Rs notwith understand this has • Layeraccording 1: The main is to identify how customers on the respect towhy purchasing happened or howcomputer. to handle it. For the maintenance engineer, he must continuously rule out errors to find a notebook the cause of the problem in that ordercustomers to solve it. The R&D designer needs to develop a new product that • Layer 2: Group factors would consider in determining which notebook computer responds to this avoids recurring this“purchasing case, four problem elements are chosen: to buy fall problem into twoand categories, “productproblems. features”Inand behavior”. Notably, other “power light extinguished,” “shut down,” “M” (Middle), and “power empty.” considerations are those not related to the specifications of a notebook computer.
• Layer 3: Evaluate “product features” and “purchasing behavior”. “Product features” include Step 2: Customer feedback product purchasing items such as the “storage/capacity”, “size”, ” weight”, “multi-functionality”, “battery life”, and “durability” notebook Meanwhile, “price”, “brand”,this “packaging”, “sales service”, Based on theof MIR model,computers. literature review, and expert interviews, study constructs an AHP “recycling channel”, and “green image” are elements to be assessed under the category of model and uses a notebook computer as an example to probe the influences of notebook computer otheron considerations. purchase the 3Rs from customers’ perspective. An AHP framework of customers’ perspective is shown as Figure 7 fromthe therelevance MIR model. • Layer 4: Examine of factors identified in Layer 3 against the 3Rs.
Figure 7. 7. AHP AHP framework framework of of customers’ customers’ perspective. perspective. Figure
• •
Layer 1: The main target is to identify how customers impact on the 3Rs with respect to purchasing a notebook computer. Layer 2: Group factors that customers would consider in determining which notebook computer to buy fall into two categories, “product features” and “purchasing behavior.” Notably, other
Systems 2016, 4, 30
9 of 15
This study aims to analyze notebook computer purchasing preferences in the market by conducting a multi-layer questionnaire. How customers weigh the product features and purchasing behavior before making a decision is examined in Layer 2, where product features and purchasing behavior are compared. The significance of each element can be isolated and a reasonable inference of purchasing preference obtained. Also, how heavily the purchasing preferences could impact on the environment is shown in Layer 4. Both customers’ purchasing preferences and the 3Rs are taken into account. The questionnaire includes two sections. The first section covers the influence of customers’ preference for a notebook computer and its use on the 3Rs. The study conducted a pair comparison between the attributes according to customers’ instinctive reactions. The second section collects basic information on the subjects, including sex, age, educational level, occupation, and monthly income. The study distributed a total of 100 copies of the questionnaire, of which 96 copies were valid. As shown from the usable returned copies, the number of female customers (67.6%) is higher than that of their male counterparts (32.4%); their ages are mostly in the range 21–25 (70.8%) or 26–30 (15.1%). Also, 78.4% of the respondents were college graduates, while ‘student’ made up the vast majority (63.3%) in terms of occupation. In addition, 74.1% of the respondents’ monthly income was below $20,000. The AHP procedure used Expert Choice computer software 2010 package (http://www. expertchoice.com). This study is conducted by the means of AHP. That is, analyzing how end users’ consideration can affect the 3Rs with regard to purchasing a notebook computer. After Expert Choice running, we obtain Reduce, Reuse, and Recycle priority values of 0.416, 0.384, and 0.200, respectively. Taking end users’ consideration into account in the case of buying a notebook computer, the result shows that “Reducing” would be the best solution, followed by “Reusing”. “Recycling” is least favorable to end users. A notebook computer is an entertainment product. According to the analytical results of AHP, we find that customers treat the product suitability (such as endurance, saving capacity, battery endurance, and functions) as the priority. The difference of the specifications significantly influences customers’ decisions and reduces the effect of green appeals on consumption. With regard to customers’ preferences, customers’ consideration factors have the most bearing on Reduce (0.416) and Reuse (0.384). In other words, when firms can design products according to customers’ preferences and consider the materials and endurance in manufacturing, the products could reveal the best reduce and reuse effects. In addition, according to the research findings, the score on Recycle (0.2) is the lowest. This means that when customers select a notebook computer, they do not consider the issue of recycling. However, if companies or the government can set up a complete recycling system, the recycling of notebook computers would be effectively increased. In addition, the government should promote the importance of green consumption to reinforce people’s environmental consciousness. 4.2. Phase II: TRIZ-Based QFD Phase This phase consists of the following sub-steps. Step 1: An eco-design engineer constructs a QFD matrix from the abovementioned problem elements within the 3Rs. These VOC items divided by 3R and VOE items are shown in Figure 8, and the top matrix shows the negative relationship denoted by “X”. Step 2: Analyze the VOE items based on the abovementioned negative relationship among them using a TRIZ contradiction matrix. These VOE items should not only comply with environmental impact standards—reducing materials, and making the battery body lightweight and recyclable; they also need to consider the necessity of the spray paint. Extra painting improves the whole notebook computer body’s look to attract customer attention; on the other hand, it also generates problems such as extra weight and increased energy consumption due to weight overload. This is an example of the contradictions between product innovation and environmental protection.
4.2. Phase II: TRIZ-Based QFD Phase This phase consists of the following sub-steps. Step 1: An eco-design engineer constructs a QFD matrix from the abovementioned problem elements within the 3Rs. These VOC items divided by 3R and VOE items are shown in Figure 8, and Systems 4, 30shows the negative relationship denoted by “X.” 10 of 15 the top 2016, matrix
Figure 8. The QFD matrixes for 3R. Figure 8. The QFD matrixes for 3R.
Further, the VOE itemsitems are related TRIZ engineering parameters *1, *3, among *22, and *25. Step 2: Analyze the VOE based onwith the abovementioned negative relationship them That means need to reduce battery energy waste andshould decrease weight of the notebook computer using a TRIZwe contradiction matrix. These VOE items notthe only comply with environmental through classifying problemsmaterials, and developing efficiency elements. The desired function may be related impact standards—reducing and making the battery body lightweight and recyclable; they to the parameters “waste of energy” and “waste of time” (rows 22 and 25 of the contradiction matrix), which should be reduced. The harmful factors may be transformed via “weight of moving object” and “length of moving object” (columns 1 and 3 of the contradiction matrix), which should be decreased. Step 3: Integrating eco-efficiency elements into QFD with a TRIZ contradiction matrix. Applying the correlation of engineering parameters and eco-efficiency elements, the relationship between TRIZ engineering parameters and eco-efficiency elements can be determined. In this case study, the most important TRIZ engineering parameter is the relationship between “A—Reduce the material intensity of its goods and services” and “B—Reduce the energy intensity of its goods and services” of eco-efficiency elements. Both items have high (H) priority, as shown in Table 2. Table 2. TRIZ engineering parameter vs. eco-efficiency elements.
TRIZ Parameters #1 weight of moving object
Eco-Efficiency Elements A
B
C
D
E
F
G
H
H
-
-
-
-
-
From Table 2, we should select engineering parameters *1 and *22. Further, these two parameters are classified and matched to the corresponding inventive principles. In the problem, inventive principles 15, 6, 19, and 28 are proposed by the contradiction matrix. Some design considerations: (i) Replacement of the body substance with an aluminum–magnesium (Al–Mg) alloy; (ii) Replacement of the electrical system with an energy-saving system. 4.3. Phase III: RFM-Based QFD Phase This phase is to establish six clusters based on RFM value in order to quantify so-called business value. The 110 consumer transactions records were collected within one year. RFM values of 100 green products were extracted from the records. The market values were linked to evaluate their respective purchased green products for eco-efficiency criteria. Table 3 presents the six clusters, each with the corresponding number of green product usage for R, F, and M values from customer feedback. The last row also shows the overall average for all numbers.
Systems 2016, 4, 30
11 of 15
Table 3. Data for eco-efficiency clusters. Systems 2016, 4, x
Cluster
No of Green Product Usage
Recency (Days)
Frequency (Times)
Monetary (Hundred US)
11 of 14
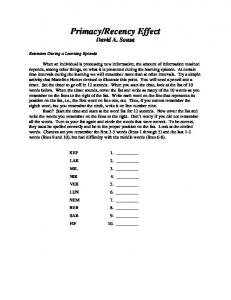
closer to 0%, are relatively important. The AHP and fuzzy-based AHP method were used to determine 1 20 29 7 148 ' the relative importance of the RFM variables Table 4. R ' , F ' , and 2 21 33 M . These 8 are shown in347 3 9 38 11 487 4 16 518 Table 4. The normalized RFM ( WI39 WR R' WF13 F ' WM M ' ). 5 15 40 15 519 ' ' ' 19 Reduction 6 43 19 529 W Cluster Recycling Reuse W M R F Fuzzy AHP AHP Overall Average 37 12 425 1 0.32 0.22 0.06 66 15 10 0.27 0.26 2 0.40 0.28 0.55 75 21 11 0.37 0.39 3 expressed 0.49 0.44 0.89 55 23 100 as 15 0.51 0.54 The 3Rs are as a percentage between 0 and a fuzzy set of symptoms in Table 4. 4 a score 0.51of less 0.56 than 0.97100%, is 50relatively 25 0.56 and0.59 Reduction, with important.17Recycling Reuse, with scores 0.53 important. 0.67 0.97 The AHP 47 and fuzzy-based 27 18 method 0.61 were 0.63 closer to 0%, are5 relatively AHP used to determine 6 0.58 0.89 1.00 43 29 21 0.71 0.72 4. 0 0 0 the relative importance of the RFM variables R , F , and M . These are shown in Table 0 0 using eco-efficiency. Multiple linear regressions (MLR) were RFM explored the0 3R values Table 4. The normalized (WI =toWpredict R R + WF F + WM M ). However, the parameters of the classical regression model with AHP and fuzzy-based weighted 0 AHP are estimated as follows.Recycling The adjusted R-squared of the WFuzzy−AHP Cluster R0 by MLR F0 andMshown Reduction Reuse WAHPand p-values regression1 model 0.32 for the AHP The 0.27 adjusted R-squared and 0.22 method 0.06 are 0.993 66 and 0.004, 15 respectively. 10 0.26 p-values of model 0.55 for the fuzzy-based AHP and 0.01, respectively. 2 the regression 0.40 0.28 75 21 method11are 0.9820.37 0.39 3 that 0.49 0.44 0.89 55 23 15level in0.51 0.54 usage. They mean the forecasting model reaches the significance green product 4 0.51 0.56 0.97 50 25 17 0.56 Substituting the 3Rs from the (R, F, M) values such as (80, 15, 10), (75, 20, 15), (70, 25, 20),0.59 (65, 30, 25), 5 0.53 0.67 0.97 47 27 18 0.61 0.63 (60, 35, 30), (55, 40, 35) into the regression will yield the business value shown in Figure 9 for comparison. 6 0.58 0.89 1.00 43 29 21 0.71 0.72 This article has considered two competitive RFM weighted methods for forecasting models: AHP and fuzzy-based AHP. Owing to the short product life cycle of notebook computers, rapidly Multipletechnology, linear regressions (MLR) were explored to predict the 3Rmethods values using eco-efficiency. progressing and environmental impact, the forecasting are used to evaluate However, the parameters of the classical regression model with AHP and fuzzy-based weighted business value. Thus this article uses the proposed eco-innovation procedure, which does not need a AHP are estimated by MLR and shown as follows. The adjusted R-squared and p-values the large amount of data to construct the forecasting model. According to the MLR method, usingofdata regression model for the AHP method are 0.993 and 0.004, respectively. The adjusted R-squared and from Table 4, when we are given reduction = 65, recycling = 27, and reuse = 19, the equations are as p-values of the regression model for the fuzzy-based AHP method are 0.982 and 0.01, respectively. follows: They mean that the forecasting model reaches the significance level in green product usage. values −0.092 Reduction 0.014as * Recycling + 0.02 * Reuse = 0.601 (4) Substituting3R the 3Rs =from the− 0.001 (R, F,* M) values +such (80, 15, 10), (75, 20, 15), (70, 25, 20), (65, 30, 25), (60, 35, 30), (55, 40, 35) into the regression will yield the business value shown in Figure 9 3R values = 0.067 − 0.003 * Reduction + 0.025 * Recycling + 0.003 * Reuse = 0.604 (5) for comparison.
1.2
eco-design value
1 0.8
AHP weighted
0.6
fuzzy-based AHP weighted
0.4 0.2
(5 5,4 0,3 5)
(6 0,3 5,3 0)
(6 5,3 0,2 5)
(7 0,2 5,2 0)
(7 5,2 0,1 5)
(8 0,1 5,1 0)
0
(Reduction,Recycling,Reuse) Figure 9. The trend of business value. Figure 9. The trend of business value.
It is clear that AHP and fuzzy-based AHP give fairly consistent results. However, fuzzy-based AHP is fairly intuitive, and provides a good forecast of business value. A good eco-innovation forecasting method should be able to consider uncertainties and thus predict the entire trend well. 5. Conclusions
Systems 2016, 4, 30
12 of 15
This article has considered two competitive RFM weighted methods for forecasting models: AHP and fuzzy-based AHP. Owing to the short product life cycle of notebook computers, rapidly progressing technology, and environmental impact, the forecasting methods are used to evaluate business value. Thus this article uses the proposed eco-innovation procedure, which does not need a large amount of data to construct the forecasting model. According to the MLR method, using data from Table 4, when we are given reduction = 65, recycling = 27, and reuse = 19, the equations are as follows: 3R values = −0.092 − 0.001 ∗ Reduction + 0.014 ∗ Recycling + 0.02 ∗ Reuse = 0.601
(4)
3R values = 0.067 − 0.003 ∗ Reduction + 0.025 ∗ Recycling + 0.003 ∗ Reuse = 0.604
(5)
It is clear that AHP and fuzzy-based AHP give fairly consistent results. However, fuzzy-based AHP is fairly intuitive, and provides a good forecast of business value. A good eco-innovation forecasting method should be able to consider uncertainties and thus predict the entire trend well. 5. Conclusions In this paper, I presented an approach to study innovative product development for eco-efficiency based on RFM value. Feedback-based eco-efficiency and TRIZ-based innovation together represent a useful approach for green product development. However, the proposed method has to deal with three issues: (i) customer feedback; (ii) product innovation; and (iii) eco-efficiency. First, a customer feedback model tried to capture the impact on the product design process based on product problems and customers’ purchasing. Second, eco-design engineers must not only avoid recurring problems, but also must continue researching eco-efficiency in related fields. Third, few literature reviews discuss new green product developments based on business value. The business value of green product innovation is very important due to environmental impacts. In the abovementioned situation, there is a need to develop an innovative green product procedure based on RFM value for the product design. The proposed eco-innovation design procedure consists of three phases: Customer feedback, TRIZ-based QFD, and RFM-based eco-efficiency. A customer feedback-based phase using MIR can identify eco-efficiency by using the RFM value for quantifying eco-design. This phase constructs a MIR model of green products using feedback about product problems and customers’ purchasing to explore the influences of the said factors on sustainability management indicators such as the 3Rs through AHP analysis. Designers can thus recognize how to find a balance between consumer satisfaction and the reduction of waste. The TRIZ-based QFD phase is to establish an eco-innovation design. Here, a conflict of VOE items necessitates appropriate problem-solving to come up with an innovative solution. The RFM-based QFD phase is to establish identifying eco-efficiency affection based on RFM in order to explore business value. With business value becoming an increasingly important competence issue, business performance should explore environmental benefits in new green product development decision-making. A case study concerns a notebook computer retailing company. Multiple linear regression (MLR) was used to predict the business value using eco-efficiency. This case study also shows experimental results in order to highlight the importance of environmental impact for eco-innovation design using RFM and 3R data. The experiment shows the correlation between 3R and RFM variables in Equations (4) and (5). It evaluates business value at 0.601 and 0.604 using AHP and fuzzy-based AHP weighted RFM. Acknowledgments: The author would like to thank the editor and anonymous reviewers for their comments. Conflicts of Interest: The author declares no conflict of interest. The founding sponsors had no role in the design of the study; in the collection, analyses, or interpretation of data; in the writing of the manuscript, and in the decision to publish the results.
Systems 2016, 4, 30
13 of 15
References 1. 2.
3. 4. 5. 6. 7. 8. 9. 10.
11. 12. 13. 14. 15. 16. 17. 18. 19. 20. 21. 22. 23. 24.
Galvez-Martosa, J.L.; Harald, S. An analysis of the use of life cycle assessment for waste co-incineration in cement kilns. Resour. Conserv. Recycl. 2014, 86, 118–131. [CrossRef] Tagliaferri, C.; Evangelisti, S.; Clift, R.; Lettieri, P.; Chapman, C.; Taylor, R. Life cycle assessment of conventional and advanced two-stage energy-from-waste technologies for methane production. J. Clean. Prod. 2016, 129, 144–158. [CrossRef] Huang, C.C.; Liang, W.Y.; Chuang, H.F.; Chang, Z.Y. A novel approach to product modularity and product disassembly with the consideration of 3R-abilities. Comput. Ind. Eng. 2012, 62, 96–107. [CrossRef] Castagna, A.; Casagrande, M.; Zeni, A.; Girelli, E.; Rada, E.C.; Ragazzi, M.; Apostol, T. 3R’ from citizen point of view and their proposal: A case-study. UPB Sci. Bull. 2013, 75, 253–264. Tseng, M.L.; Louie, D.; Rochelle, D. Evaluating firm’s sustainable production indicators in uncertainty. Comput. Ind. Eng. 2009, 57, 1393–1403. [CrossRef] Alessandro, S.; Luciano, M.; Fabrizio, P.; Ivano, V.; Salvatore, D.C.; Francesco, B. End-of-Life Vehicles management: Italian material and energy recovery efficiency. Waste Manag. 2011, 31, 489–494. Bovea, M.D.; Belis, V.P. A taxonomy of ecodesign tools for integrating environmental requirements into the product design process. J. Clean. Prod. 2012, 20, 61–71. [CrossRef] Julie, C.; Dominique, G.; Thomas, H.C. Quantifying uncertainty in LCA-modelling of waste management systems. Waste Manag. 2012, 32, 2482–2495. Gian, A.B.; Mirko, B.; Moris, F.; Debora, F. Eco-efficient waste glass recycling: Integrated waste management and green product development through LCA. Waste Manag. 2012, 32, 1000–1008. Victor, P.; Chayer, J.A.; Manuele, M.; Robert, P.; Réjean, S. A process-based approach to operationalize life cycle assessment through the development of an eco-design decision-support system. J. Clean. Prod. 2012, 33, 192–201. Sebastiao, R.S.; Alexandra, R.F.; Vamilson, P.S.; Rodrigo, A.F. Applications of life cycle assessment and cost analysis in health care waste management. Waste Manag. 2013, 33, 175–183. Deirdre, H.; Stephen, B.; David, C. A multi-criteria decision analysis assessment of waste paper management options. Waste Manag. 2013, 33, 566–573. Winn, S.F.; Roome, N. R&D management responses to the environment: Current theory and implications to practice and research. R&D Manag. 1993, 23, 147–161. Roome, N. Business strategy, R&D management and environmental impetration. R&D Manag. 1994, 24, 65–82. Yang, C.J.; Chen, J.L. Accelerating preliminary eco-innovation design for products that integrates case-based reasoning and TRIZ method. J. Clean. Prod. 2011, 19, 998–1006. [CrossRef] Competitiveness and Innovation Framework Programme. Available online: http://ec.europa.eu/cip/ (accessed on 12 September 2016). Kim, K.J.; Park, T. Determination of an optimal set design requirements using house of quality. J. Oper. Manag. 1998, 16, 569–581. Trappey, C.V.; Trappey, A.J.C.; Hwang, S.J. A computerized quality function deployment approach for retail services. Comput. Ind. Eng. 1996, 30, 611–622. [CrossRef] Kim, K.J.; Moskowitz, H.; Dhingra, A.; Evans, G. Fuzzy multicriteria models for quality function deployment. Eur. J. Oper. Res. 2000, 121, 504–518. [CrossRef] Krikke, H.R.; Harten, A.V.; Schuur, P.C. Business case rotes: Recovery strategies for monitors. Comput. Ind. Eng. 1999, 36, 739–757. [CrossRef] Linton, J. Electronic products at their end-of-life: Options and obstacles. J. Electron. Manuf. 1999, 9, 29–40. [CrossRef] Wu, J.N. EOL Product Strategy Analysis and DFE via Neural Networks. Master’s Thesis, Department of Mechanical Engineering, Cheng Kung University, Tainan City, Taiwan, June 2002. Sousa, I.; Wallace, D. Product classification to support approximate life-cycle assessment of design concepts. Technol. Forecast. Soc. Chang. 2006, 73, 228–249. [CrossRef] Jack, C.P.; Sua, L.W.; Johnny, C.H. The impacts of technology evolution on market structure for green products. Math. Comput. Model. 2012, 55, 1381–1400.
Systems 2016, 4, 30
25. 26. 27. 28. 29. 30. 31. 32. 33. 34. 35.
36. 37. 38. 39. 40. 41. 42. 43. 44. 45. 46.
47. 48. 49. 50. 51. 52. 53.
14 of 15
Xue, W.; Gabrielle, G. Prioritizing material recovery for end-of-life printed circuit boards. Waste Manag. 2012, 32, 1903–1913. Hongping, Y. A model for evaluating the social performance of construction waste management. Waste Manag. 2012, 32, 1218–1228. Alltshuller, G. Suddenly the Inventor Appeared: TRIZ, the Theory of Inventive Problem Solving; Technical Innovation Center: Worcester, MA, USA, 1996. Silveira, G.D.; Slack, N. Exploring the trade-off concept. Int. J. Oper. Prod. Manag. 2001, 21, 949–964. [CrossRef] Fresner, J.; Jantschgi, J.; Birkel, S.; Bärnthaler, J.; Krenn, C. The theory of inventive problem solving (TRIZ) as option generation tool within cleaner production projects. J. Clean. Prod. 2010, 18, 128–136. [CrossRef] Zadeh, L.A. Fuzzy sets. Inf. Control 1965, 8, 338–356. [CrossRef] Gomathi, N.; Rupesh, P.L.; Sridevi, L. Study of E-waste-hazards & recycling techniques—A review. Int. J. ChemTech. Res. 2015, 8, 300–307. Torretta, V.; Rada, E.C.; Ragazzi, M.; Trulli, E.; Istrate, I.A.; Cioca, L.J. Treatment and disposal of tyres: Two EU Scenarios. Waste Manag. 2015, 45, 152–160. [CrossRef] [PubMed] Xu, X.; Zeng, X.; Boezen, H.M.; Huo, X. E-waste environmental contamination and harm to public health in China. Front. Med. 2015, 9, 220–228. [CrossRef] [PubMed] Peeranart, K.; Ravi, N.; Ming, H.W. Electronic waste management approaches: An overview. Waste Manag. 2013, 33, 1237–1250. Belboom, S.; Renzoni, R.; Deleu, X.; Digneffe, J.M.; Leonard, A. Electrical waste management effects on environment using life cycle assessment methodology: The fridge case study. In Proceedings of the SETAC EUROPE 17th LCA Case Study Symposium Sustainable Lifestyles, Budapest, Hungary, 28 February–1 March 2011; p. 2. Duan, H.; Eugster, M.; Hischier, R.; Streicher, P.M.; Li, J. Life cycle assessment study of a Chinese desktop personal computer. Sci. Total Environ. 2009, 407, 1755–1764. [CrossRef] [PubMed] Hughes, A.M. Strategic Database Marketing; Probus Publishing: Chicago, IL, USA, 1994. Stone, B. Successful Direct Marketing Methods; NTC Business Books: Lincolnwood, IL, USA, 1995. Bult, J.R.; Wansbeek, T.J. Optimal selection for direct mail. Mark. Sci. 1995, 14, 378–394. [CrossRef] Chang, H.C.; Tsai, H.P. Group RFM analysis as a novel framework to discover better customer consumption behavior. Expert Syst. Appl. 2011, 38, 14499–14513. [CrossRef] David, L.; Olson, B.C. Direct marketing decision support through predictive customer response modeling. Decis. Support Syst. 2012, 54, 443–451. Cheng, L.C.; Sun, L.M. Exploring consumer adoption of new services by analyzing the behavior of 3G subscribers: An empirical case study. Electron. Commer. Res. Appl. 2012, 11, 89–100. [CrossRef] Chiang, W. To mine association rules of customer values via a datamining procedure with improved model: An empirical case study. Expert Syst. Appl. 2011, 38, 1716–1722. [CrossRef] Hu, Y.H.; Huang, T.C.K.; Kao, Y.H. Knowledge discovery of weighted RFM sequential patterns from customer sequence databases. J. Syst. Softw. 2013, 86, 779–788. [CrossRef] World Business Council for Sustainable Development. Eco-Efficiencyv Creating More Value with Less Impact; World Business Council for Sustainable Development: Geneva, Switzerland, 2000. Tajima, T. Greening Supply Chain: Enhancing Competitiveness though Green Productivity; Report of the top forum on enhancing competitiveness through green productivity; Asian Productivity Organization: Taipei, Taiwan, 2001; pp. 66–78. Liu, C.C.; Chen, J.L. An eco-innovative design approach incorporating the TRIZ method without contradiction analysis. J. Sustain. Prod. Des. 2003, 1, 262–272. Orloff, M. Inventive Thinking through TRIZ; Springer: Berlin, Germany, 2003. Moehrle, M.G. How combinations of TRIZ tools are used in companies results of a cluster analysis. R&D Manage. 2005, 35, 285–296. Petrov, V. The laws of system evolution. TRIZ J. 2002, 3, 9–17. Kaplan, S. An Introduction to TRIZ; Ideation International Inc.: Southfield, MI, USA, 1996. Contradiction Matrix. Available online: https://triz-journal.com/contradiction-matrix/ (accessed on 12 September 2016). Saaty, T.L. The Analytic Hierarchy Process; McGraw-Hill: New York, NY, USA, 1980.
Systems 2016, 4, 30
54. 55. 56. 57.
15 of 15
Saaty, T.L. A Scaling Method for Priorities in Hierarchy Structures. J. Math. Psychol. 1979, 3, 243–281. Kahraman, C.; Cebeci, U.; Ruan, D. Multi-attribute comparison of catering service companies using fuzzy AHP: The case of Turkey. Int. J. Prod. Econ. 2004, 87, 171–184. [CrossRef] Cheng, A.C.; Chen, C.J.; Chen, C.Y. A fuzzy multiple criteria comparison of technology forecasting methods for predicting the new materials development. Technol. Forecast. Soc. Chang. 2008, 75, 131–141. [CrossRef] Sander, P.C.; Brombacher, A.C. MIR: The use of Reliability Information Flows as a maturity index for quality management. Qual. Reliab. Eng. Int. 1999, 15, 439–447. [CrossRef] © 2016 by the author; licensee MDPI, Basel, Switzerland. This article is an open access article distributed under the terms and conditions of the Creative Commons Attribution (CC-BY) license (http://creativecommons.org/licenses/by/4.0/).