Feeder Reconfiguration with Dispatchable Distributed Generators in Distribution System by Tabu Search N. Rugthaicharoencheep, and S. Sirisumrannukul Department of Electrical Engineering, Faculty of Engineering King Mongkut’s University of Technology North Bangkok, 1518, Pibulsongkram Rd., Bangsue, Bangkok 10800, Thailand
[email protected],
[email protected] Abstract-This paper presents a feeder reconfiguration problem to the distribution system with dispatchable distributed generators. The feeder configuration of the system and the dispatch of the distributed generators are two problems that need to be considered. A Tabu search algorithm is applied to search for the on/off patterns of the sectionalizing switches and tie switches to obtain the minimum total power loss, whereas the dispatch schedule of the distributed generators which gives the minimum total cost of generation is solved by an optimal power flow. The developed methodology is demonstrated by a 69-bus radial distribution system with distributed generators. The study results show that the optimal on/off patterns of the switches and the optimal dispatch schedule of the distributed generators can give the minimum total cost of generation while satisfying the system operational constraints and benefiting from savings in reduction of power loss and generation cost.
necessary if this generation is to be integrated in a costeffective manner. Such a transition enables the system operator to maximize the use of the existing circuits by taking full advantage of generator dispatch, control of transformer taps, voltage regulators, reactive power management and system reconfiguration in an integrated manner [6]. This paper emphasizes the implementation of feeder reconfiguration to the distribution system with dispatchable distributed generators by a Tabu search technique. The objective of the feeder reconfiguration is to minimize the total system power loss while keeping the generation cost of distributed generators at minimum. The purposed methodology is demonstrated by a 69-bus radial distribution system.
Index Terms--Feeder reconfiguration, Distributed Generator, Distribution system, Generation dispatch, Tabu search
II. TABU SEARCH
I. INTRODUCTION Distribution systems are normally configured radially for effective coordination of their protective devices [1]. Two types of switches are generally found in the system for both protection and configuration management. These are sectionalizing switches (normally closed switches) and tie switches (normally opened switches) [2]. By changing the statuses of the sectionalizing and tie switches, the configuration of distribution system is varied, and loads are transferred among the feeders while the radial configuration format of electrical supply is still maintained. This implementation is known as feeder reconfiguration. The advantages obtained from feeder reconfiguration are, for example, real power loss reduction, balancing system load, bus voltage profile improvement, increasing system security and reliability, and power quality improvement [3-4]. Over the last decade, distribution systems have seen a significant increase in small-scaled generators, which is known as distributed generation (DG). Distributed generators are grid-connected or stand-alone electric generation units located within the distribution system at or near the end user. Recent development in DG technologies such as wind, solar, fuel cells, hydrogen, and biomass has drawn an attention for utilities to accommodate DG units in their systems [5]. As the penetration of distributed generation is expected to increase significantly in the near future, a paradigm shift in control, operation and planning of distribution networks may be
Tabu search is a meta-heuristic that guides a local heuristic search strategy to explore the solution space beyond local optimality. Tabu search was developed by Glover [7] and has a great variety of real-world problems, such as resource planning, telecommunications, financial analysis, scheduling, space planning, and energy distribution [8]. Tabu search is a local search technique that uses an iterative search procedure to progressively improve the solution by a series of local moves to neighborhood solutions. Tabu search has the ability to escape from local minima by effectively utilizing a memory to provide an efficient search for optimality. The memory is called “Tabu list”, which stores attributes of solutions. In the search process, the solutions in the Tabu list cannot be a candidate of the next iteration. As a result, it helps inhibit choosing the same solution many times and avoid being trapped into cycling of the solutions [9-10]. The quality of a move in solution space is assessed by aspiration criteria that provide a mechanism (see Fig. 1) for overriding the Tabu list.
Fig. 1. Concept of Tabu search
III. FEEDER RECONFIGURATION
IV. PROBLEM FORMULATION
Feeder reconfiguration in a distribution system is an operation in configuration management that determines the switching operations for many purposes such as decreasing network loss, balancing system load, and improving bus voltages or system reliability. The configuration may be varied via switching operations to transfer loads among the feeders. Two types of switches are used: normally closed switches (sectionalizing switches) and normally open switches (tie switches) [3]. An application of the Tabu search algorithm is shown by a three-feeder distribution system in Fig. 2 [11]. The system consists of 16 buses, 13 load points, 13 normally closed switches, and 3 normally open switches. The initial configuration states that switches located on branch No. 14, No. 15 and No. 16 are open. With this configuration, the initial power loss is 511.44 kW. Fig. 3 shows moves from the current solution to two feasible solutions generated by the Tabu search: neighborhood solutions 1 and 2. The moves to solutions 1 and 2 give a power loss of 676.63 kW and 483.87 kW, respectively. The same process continues until 100 iterations. The optimal solution indicates that switch No. 16 remains open and the statuses of switches No. 7 and 8 are changed from ‘closed’ to ‘open’, giving a real power loss of 466.12 kW.
The optimization problem consists of two subproblems; namely, optimal feeder reconfiguration and optimal power flow. The objective of the optimal feeder reconfiguration problem is to minimize the total power loss as: Nl
Minimize L =
l
∑ ∑ Ik
t =1 k =1
where
L Nl l Ik
=
Rk
=
2
Rk
(1)
total power loss number of load levels number of feeders current flow in branch k resistance of branch k
= = =
The objective function in (1) is subject to the following constraints. - Power flow equations:
Pi =
Nb
∑ Y ijV iV j
j =1
cos( θij + δ j − δi )
(2)
Nb
Q i = − ∑ Y ijV iV j sin( θij + δ j − δi ) j =1
where P , Q i i
(3)
=
active and reactive power at bus i
Nb Y ij
= =
number of buses element (i, j ) in bus admittance matrix
Vi , V j
=
voltage of bus i and bus j
θij
=
angle of Y ij
δi , δ j
=
voltage angle of bus i and bus j
- Bus voltage limits: V min ≤ V i ≤ V max
(4)
- Feeder capability limits: Fig.2. Single-line diagram of 16-bus distribution system
I k ≤ I kmax
k ∈ {1, 2, 3,..., l }
(5)
- Maximum number of switching operations: max N sw ≤ N sw
(6)
- Radial configuration format: The system has to remain radially operated after reconfiguration. - No load-point interruption: All load points have to be served after reconfiguration. where V
Fig.3. Neighborhood search for tie and sectionalizing switches
min
, V max
=
minimum and maximum voltage
I kmax
=
maximum current capability of branch k
N sw
=
max N sw
=
number of switching operations maximum number of switching operations
After the optimal on/off patterns of the switches are identified, an optimal power flow is performed to minimize the total generation cost of the active power generated by the distributed generators and the grid supply point as: Ng
Minimize Z =
∑ fn (Pn )
n =1
(7)
The fuel cost functions of generation units can be presented as quadratic functions: fn (Pn ) = an Pn2 + bn Pn + cn
where
Z fn Pn
=
Ng a n , bn , cn
=
= = =
(10)
- Reactive power generation limits:
=
Q nmin , Qnmax
=
Calculate the aspiration level for each member of S neighbor , and choose the one that has the highest
Step 10: Check whether the attribute of the solution obtained in step 9 is in the Tabu list. If yes, go to step 11, or else Scurrent = Sneighbor_b est and go to step 12. Step 11: Accept Sneighbor_b est if it has a better aspiration level than fbest and set Scurrent = Sneighbor_b est , or
- Active power generation limits:
where P min , P max n n
penalty function Generate a set of solutions in the neighborhood of S current by changing the switch numbers that should be opened. This set of solutions is designated as S neighbor .
aspiration level, Sneighbor_b est .
(9)
Qnmin ≤ Qn ≤ Qnmax
Step 8:
Step 9:
The objective function in (7) is subject to the following constraints. - Bus voltage limits:
Pnmin ≤ Pn ≤ Pnmax
f (S best ) . The aspiration level is the sum of L and a
(8)
total fuel cost of generating units cost function of unit n active power generation of unit n number of generating units cost coefficients of unit n
V min ≤ V i ≤ V max
Step 6: Calculate the total power loss using (1) and check whether the current solution satisfies the constraints. A penalty factor is appropriately applied for constraint violation. Step 7: Calculate the aspiration level of S best : f best =
(11)
minimum and maximum active power of unit n minimum and maximum reactive power of unit n
V. SOLUTION METHODOLOGY The Tabu search algorithm is applied to solve the feeder configuration problem using the following steps. Step 1: Read the bus, load and branch data of a distribution system including all the operational constraints. Step 2: Randomly select a feasible solution from the search space: S 0 ∈ Ω. The solution is represented by the switch number that should be opened during network reconfiguration. Step 3: Set the size of a Tabu list, maximum iteration and iteration index m = 1. Step 4: Let the initial solution obtained in step 2 be the current solution and the best solution: S best = S 0 , and S current = S 0 . Step 5: Perform an optimal power flow by a MATPOWER software package [12] to determine power loss, bus voltages, branch currents and generation schedules of the distributed generators.
else select a next-best solution that is not in the Tabu list to become the current solution. Step 12: Update the Tabu list and set m = m + 1 . Step 13: Repeat steps 8 to 12 until a specified maximum iteration has been reached. Step 14: Repeat step 5 and report the optimal solution.
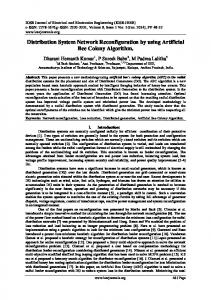
VI. CASE STUDY The developed methodology is demonstrated by a radial distribution system with 69 buses, 7 laterals and 5 tie-lines (looping branches), as shown in Fig. 4. The current carrying capacity of branch No.1-9 is 400 A, No. 46-49 and No. 52-64 are 300 A and the other remaining branches including the tie lines are 200 A. Four DG units are located at buses 21, 33, 46, and 62 with capacities of 300, 100, 200, and 400 kW, respectively. The total installed capacity of the four DGs is 1,000 kW, accounting for 26.3% of the total system demand. The base values for voltage and power are 12.66 kV and 100 MVA. Each branch in the system has a sectionalizing switch for reconfiguration. The load data are given in Table AI and cost functions of the generators in Table AII. Table AIII provides branch data [13]. The initial statuses of all the sectionalizing switches (switches No. 1-68) are closed while all the tie-switches (switch No. 69-73) open. The total loads for this test system are 3,801.89 kW and 2,694.10 kVAr. The minimum and maximum voltages are set at 0.95 and 1.05 p.u. The maximum iteration for the Tabu search algorithm is 100. Five cases are examined as follows:
Grid supply point 1
Case 1: The DGs provide only active power and the system is without feeder reconfiguration. Case 2: The same as case 1 except that the system is reconfigured. Case 3: The same as case 2 except that the DGs can also generate reactive power. Case 4: The same as case 3 with a constraint that the number of switching operations of sectionalizing and ties switches must not exceed 4. Case 5: The same as case 3 but the daily load pattern is divided into a 13-hour peak duration with a peak demand of 1.00 p.u. and a 11-hour off-peak duration with a peak demand of 0.70 p.u.
1 2 2 35 3
36 37
28 28 48
6 39
48
7 40
49 8
50
40
50
51
9
52
9 10 10
51 42
42 43
52 53
69
45 68
13 13
69
72
57 57 58
15
58 16
16
59
17 70
17
61
18 19
60 61 62
62
19
DG4 400 kW
63
20
20
59
60
18
DG1 300 kW
33 33 34 34 35
56 14 15
71
32
56
14
DG3 200 kW
31
55
67 55
12
68
54 54
66 12
67
44 46
66
11
DG2 100 kW
53
65
11
44
31 32
8
41
30 30
49
7
39
29
47 6
38
29
47
5 38
45
The numerical results for the 5 cases are summarized in Table I. It is seen that bus voltages for all cases are controlled to stay within the allowable range. When the feeders are reconfigured, the magnitudes of bus voltages in cases 2, 3 and 4 are improved compared with those of case 1. In addition, in these cases, the power loss and the total generation cost are decreased by changing switch statuses. Comparing case 2 with case 3, a power loss of 17 kW can be saved from the reactive power supplied from the DGs. As shown in case 4, a power loss is increased by 19 kW when the total number of switching operations is limited at 4. Like cases 2 and 3, case 5 in which the two load levels are taken into consideration requires 6 switching operations but with different sectionalizing switches to be open. Reconfiguration for case 5 is shown in Fig 5. With reference to the dispatch results in Table I, the cheapest unit, DG3 in case 1 supplies only 136.30 kW. The reason is that it is sufficient to cover the demands located between buses 36 and 46. After reconfiguration by closing switch No.71 for cases 2, 3, and 5 or switch No. 69 for case 4, the loading of DG3 is at maximum because it can provide its power to the path connected to these switches. Also in case 1, DG4, the most expensive unit, is loaded at its upper limit because it is located near the largest load of the system (1,244 kW) at bus 61.
46
5
37
43
27
4
4
36
41
3
63 21 21
64 64
22
65
22 23
Load
23
Tie switches Sectionalizing switches
24 25
Distributed generator
26
24 25 73 26 27
Fig. 4. Single-line diagram of 69-bus distribution system
After reconfiguration by opening switch No. 56 for cases 2, 4 and 5 or switch No. 58 for case 3, DG4 is dispatched at its lower limit since the grid supply point and DG3 are able to make up the 350 kW difference through the alternate path to bus 61.
TABLE I RESULTS OF CASES STUDY Case 1 Active power from grid supply point (kW) Active power of DG1 (kW) Active power of DG2 (kW) Active power of DG3 (kW) Active power of DG4 (kW) Reactive power from grid supply point (kVAr) Reactive power of DG1 (kVAr) Reactive power of DG2 (kVAr) Reactive power of DG3 (kVAr) Reactive power of DG4 (kVAr) Minimum voltage (p.u.) Maximum voltage (p.u.) Number of switching operations Sectionalizing switches to be open Tie switches to be closed Power loss (kW) Total cost of distributed generators ($/day)
3,042.06 300.00 59.79 136.30 400.00 2,757.61 0.981 (Bus 61) 1.050 (Bus 1) 136.00 8,453.43
Case 2 3,477.05 96.90 60.07 200.00 50.00 2,771.46 1.002 (Bus 61) 1.050 (Bus 1) 6 12, 56, 63 71, 72, 73 82.00 7,886.66
Case 3 3,474.56 87.81 54.74 200.00 50.00 1,971.55 250.00 10.00 175.00 350.00 1.008 (Bus 61) 1.050 (Bus 1) 6 12, 58, 62 71, 72, 73 65.00 7,870.87
Case 4
Case 5
Peak Off-peak 3,380.97 3,522.15 2,347.59 200.62 57.05 50.00 54.75 50.00 50.00 200.00 200.00 200.00 50.00 50.00 50.00 1,999.04 2,221.05 1,544.10 250.00 220.24 157.02 10.00 22.37 10.00 175.00 114.04 77.37 350.00 190.00 132.34 0.995 (Bus 65) 1.002 (Bus 61) 1.017 (Bus 61) 1.050 (Bus 1) 1.050 (Bus 1) 1.050 (Bus 33) 4 6 42, 56 14, 56, 61 69, 72 71, 72, 73 84.00 77.00 36.00 7,995.43 7,828.22
Grid supply point
REFERENCES
1 1
[1]
2 2 35 3
36 36
46
28 28
5
48
6 39 7
39 40
48 49
50
51
9
52
9 10 10
51 42
42 43
52 53
45
68
13 13
69
[6]
58 58
16 59
17 70
[7] [8]
59 60
60
18
61
18 19
62 20
[9]
61 62
19
DG1 57.05 kW
[5]
57
16 17
DG4 50 kW
63 63
21 21
22
65
23 23
Tie switches Sectionalizing switches
24 25
Distributed generator
26
[10]
64 64
22
Load
[4]
72
57
15
20
33 33 34 34 35
56
15
71
32
56 14
14
DG3 200 kW
[3]
31
55
67 55
12
68
46
54 54
66 12
67
44 45
66
11
69
DG2 50 kW
53
65
11
44
31 32
8
41
30 30
49
7 8
50
40
29
47 6
38 38
[2]
29
47
5
37
43
27
4
4 37
41
3
[11]
24
[12]
25 73 26 27
[13]
M. A. Kashem, V. Ganapathy and G. B. Jasmon, “Network reconfiguration for load balancing in distribution networks,” IEE Proc.Gener. Transm. Distrib., vol. 146, no. 6, pp. 563-567, November 1999. C. T. Su, and C. S. Lee, “Network reconfiguration of distribution systems using improved mixed-integer hybrid differential evolution,” IEEE Trans. Power Delivery, vol. 18, no. 3, pp. 1022-1027, July. 2003. M. E. Baran, and F. F. Wu, “Network reconfiguration in distribution systems for loss reduction and load balancing,” IEEE Trans. on Power Delivery, vol. 4, no 2, pp. 1401-1407, April 1989. A. Autonino Augugliaro, L. Dusonchet, M. Giuseppe, and E. Riva, “Minimum losses reconfiguration of MV distribution networks through local control of tie-switches,” IEEE Trans. on Power Delivery, vol. 18, no 3, pp. 762-771, July 2003. N. G. A. Hemdan, and M. Kurrat, “Distributed generation location and capacity effect on voltage stability of distribution networks,” Student paper annual IEEE Conf., pp.1-5, February 2008. T. Ackerman, “Wind Power in Power System,” John Wiley and Sons, 2005. F. Glover, “Tabu search-part I,” ORSA J. Computing, vol. 1, no.3, 1989. B. Dengiz, and C. Alabas, “Simulation optimization using tabu search,” in Proc. Winter Simulation Conf., pp. 805-810, 2000. H. Mori, and Y. Ogita, “Parallel tabu search for capacitor placement in radial distribution system,” in Proc. Power Engineering Society Winter Meeting Conf., pp 2334-2339. 2002. H. Mori, and Y. Iimura, “An improved tabu search approach to distribution network expansion planning under new environment,” in Proc. Power Technology. Conf., pp. 981-986, 2004. C. T. Su, , and C. S. Lee, , “Network reconfiguration of distribution systems using improved mixed-integer hybrid differential evolution,” IEEE Trans. on Power Delivery, vol. 18 no. 3, pp 1022-1027, 2003. R. D. Zimmerman, C. E. Murillo-Sánchez, and D. Gan, “A MATPOWERTM power system simulation package version 3.1b2”, Power Systems Engineering Research (PSERC), September, 2006. J. S. Savier, and D. Das, “Impact of network reconfiguration on loss allocation of radial distribution systems,” IEEE Trans. on Power Delivery, vol. 22, no. 4, pp. 2473-2480, October 2007.
Fig. 5. Reconfiguration of 69-bus distribution system for case 5
APPENDIX VII. CONCLUSION As the penetration of distributed generation is expected to increase significantly in the near future, the economic merit of feeder reconfiguration in the distribution system with distributed generators is evaluated in terms of reduction in power loss and generation cost. The topology of the feeders is reconfigured by opening sectionalizing switches and closing tie switches such that the power from the grid supply point and from distributed generators can be re-routed. The main tools employed in the investigation are Tabu search and optimal power flow. The results from the case study reveals that the statuses of tie and sectionalizing switches can be appropriately adjusted in conjunction with the dispatch schedule of the distributed generators so that savings from power loss and generation cost can be achieved while satisfying all the constraints imposed by the system and by the individual distributed generating units.
ACKNOWLEDGEMENTS The first author would like to express his gratitude to Graduate College, King Mongkut’s University of Technology North Bangkok, and Rajamangala University of Technology Phra Nakhon, Thailand for financial support.
TABLE AI LOAD DATA OF 69-BUS DISTRIBUTION SYSTEM Bus Number 6 7 8 9 10 11 12 13 14 16 17 18 20 21 22 24 26 27 28 29 33 34 35 36
PL (kW) 2.60 40.40 75.00 30.00 28.00 145.00 145.00 8.00 8.00 45.50 60.00 60.00 1.00 114.00 5.00 28.00 14.00 14.00 26.00 26.00 14.00 19.50 6.00 26.00
QL (kVAr) 2.20 30.00 54.00 22.00 19.00 104.00 104.00 5.00 5.50 30.00 35.00 35.00 0.60 81.00 3.50 20.00 10.00 10.00 18.60 18.60 10.00 14.00 4.00 18.55
Bus Number 37 39 40 41 43 45 46 48 49 50 51 52 53 54 55 59 61 62 64 65 66 67 68 69
PL (kW) 26.00 24.00 24.00 1.20 6.00 39.22 39.22 79.00 384.70 384.70 40.50 3.60 4.35 26.40 24.00 100.00 1,244.00 32.00 227.00 59.00 18.00 18.00 28.00 28.00
QL (kVAr) 18.55 17.00 17.00 1.00 4.30 26.30 26.30 56.40 274.50 274.50 28.30 2.70 3.50 19.00 17.20 72.00 888.00 23.00 162.00 42.00 13.00 13.00 20.00 20.00
TABLE AIII (Continued)
TABLE AII COST FUNCTIONS OF DISTRIBUTED GENERATORS cost function coefficients DG1 DG2 DG3 DG4
ai
bi
ci
0.015 0.008 0.004 0.005
46 45 45 49
77 78 78 77
Pi
min
(kW) 50 50 50 50
Pi
max
(kW) 300 100 200 400
min
Qi
max
Qi
(kVAr) (kVAr) 10 250 75 10 175 10 350 10
TABLE AIII BRANCH DATA OF 69-BUS DISTRIBUTION SYSTEM Branch Number 1 2 3 4 5 6 7 8 9 10 11 12 13 14 15 16 17 18 19 20 21 22 23 24 25 26 27 28 29 30 31 32 33 34 35 36 37 38 39 40 41
Sending end bus 1 2 3 4 5 6 7 8 9 10 11 12 13 14 15 16 17 18 19 20 21 22 23 24 25 26 3 28 29 30 31 32 33 34 3 36 37 38 39 40 41
Receiving end bus 2 3 4 5 6 7 8 9 10 11 12 13 14 15 16 17 18 19 20 21 22 23 24 25 26 27 28 29 30 31 32 33 34 35 36 37 38 39 40 41 42
R (Ω) 0.0005 0.0005 0.0015 0.0251 0.3660 0.3811 0.0922 0.0493 0.8190 0.1872 0.7114 1.0300 1.0440 1.0580 0.1966 0.3744 0.0047 0.3276 0.2106 0.3416 0.0140 0.1591 0.3463 0.7488 0.3089 0.1732 0.0044 0.0640 0.3978 0.0702 0.3510 0.8390 1.7080 1.4740 0.0044 0.0640 0.1053 0.0304 0.0018 0.7283 0.3100
X (Ω) 0.0012 0.0012 0.0036 0.0294 0.1864 0.1941 0.0470 0.0251 0.2707 0.0619 0.2351 0.3400 0.3450 0.3496 0.0650 0.1238 0.0016 0.1083 0.0690 0.1129 0.0046 0.0526 0.1145 0.2475 0.1021 0.0572 0.0108 0.1565 0.1315 0.0232 0.1160 0.2816 0.5646 0.4873 0.0108 0.1565 0.1230 0.0355 0.0021 0.8509 0.3623
Branch Number 42 43 44 45 46 47 48 49 50 51 52 53 54 55 56 57 58 59 60 61 62 63 64 65 66 67 68 69 70 71 72 73
Sending end bus 42 43 44 45 4 47 48 49 8 51 9 53 54 55 56 57 58 59 60 61 62 63 64 11 66 12 68 11 13 15 50 27
Receiving end bus 43 44 45 46 47 48 49 50 51 52 53 54 55 56 57 58 59 60 61 62 63 64 65 66 67 68 69 Tie line 43 21 46 59 65
R (Ω) 0.0410 0.0092 0.1089 0.0009 0.0034 0.0851 0.2898 0.0822 0.0928 0.3319 0.1740 0.2030 0.2842 0.2813 1.5900 0.7837 0.3042 0.3861 0.5075 0.0974 0.1450 0.7105 1.0410 0.2012 0.0047 0.7394 0.0047
X (Ω) 0.0478 0.0116 0.1373 0.0012 0.0084 0.2083 0.7091 0.2011 0.0473 0.1114 0.0886 0.1034 0.1447 0.1433 0.5337 0.2630 0.1006 0.1172 0.2585 0.0496 0.0738 0.3619 0.5302 0.0611 0.0014 0.2444 0.0016
0.5000 0.5000 1.0000 2.0000 1.0000
0.5000 0.5000 0.5000 1.0000 0.5000
Nattachote Rugthaicharoencheep received a B.S. Tech. Ed. in Electrical Engineering from Rajamamkala Institute of Technology Thewes Campus, Bangkok, Thailand in 2001, and an M.Eng. in Electrical Engineering from Thammasat University, Pathumthani, Thailand in 2005. He is currently working toward his Ph.D. in Electrical Engineering at King Mongkut’s University of Technology North Bangkok (KMUTNB), Thailand. His research interests are power system operation, optimization and planning. Somporn Sirisumrannukul is an assistant professor at the Department of Electrical Engineering, Faculty of Engineering, King Mongkut’s University of Technology North Bangkok (KMUTNB), Bangkok, Thailand. His main research interests are power system operation and optimization, reliability and renewable energy.