... minima are typical of fault bends (Ellis and Dunlap, 1988; Peacock, 1991). ..... David Sanderson and Tom Patton are thanked for their help. Reviews by Simon.
TEcTomHlPHYsIcs ELSEWIER
Tectonophysics 234 (1993) 147-167
Field examples and numerical modelling of oversteps and bends along normal faults in cross-section D.C.P. Peacock *, Xing Zhang Geomechanks Research Group, Department of Geology, University of Southampton, Southa~to~,
SOP SNH, UK
(Received July 13,1993; revised version accepted February 21,1994)
Abstract Oversteps and bends along cross-sections through smail-scale ( < 2 m displacement) normal faults are described. L~thologi~l variations, particularly the relative pro~rtions of brittle to less brittle layers, have impo~ant effects on fault initiation, geometry and displacement. Faults usually initiate as extension fractures in more brittle layers, with shear fractures developing at lower angles in less brittle layers as displacement increases. When there is a greater thickness of brittle layers than less brittle layers, shear fractures occur in the brittle layers. Bends with overall contraction develop in less brittle layers, where faults have gentler dips. Pull-aparts (extensional bends) typically develop in brittle layers when there is a high proportion of less brittle layers in the rock sequence. Minor structures
which can occur at oversteps and bends include pull-aparts, minor faults, brecciation, folds, compaction and pressure solution; these typically cause displacement minima at contractional bends. Nume~cal modelling (distinct element analysis) has been carried out to simulate the patterns of defo~ation at oversteps and bends. Area increase, pull-apart development and Iocalised stress concentration occur at extensional oversteps and bends. Stress concentration and a tendency for compaction are typical of contractional oversteps and bends. Such results are compatible with the structures observed in the field. A sensitivity analysis of the modelling has been carried out to investigate the effects of variations in mechanical parameters on defo~ation. Although models with weaker properties are more deformable, the overall geometry of deformation varies little with variations in mechanical parameters.
1. Introduction
Normal fault zones are not simple planar discontinuities, but are composed of overstepping and linked segments, and often have sizeable bends. Oversteps and bends occur both in map
* Present address:Department of GeologicalSciences, University of Plymouth, Plymouth, PL4 8AA, UK
view (e.g., Crone and Hailer, 1991; Peacock and Sanderson, 1991) and in cross-section (e.g., Wiliiams and Vann, 1987). Studies of active faults (Aki, 1979; Zhang et al., 1991) show that oversteps and bends cause slip events to have compiex spatial and temporal arrangements, producing fauit zones which have complex finite displacements (Peacock and Sanderson, 1991). Knowledge of the structures and displacements at oversteps and bends is therefore important in understanding fault development.
0040-1951/94/$07.00 0 1994 Elsevier Science B.V. All rights reserved SD1 0040-1951(94)00059-I
148
D.C.P. Peacock. X. Zhang/
(a) In-plane oversteps
(b) Anti-plane oversteps
7 1
,~
,PA
v
Fig. 1. A classification of fault oversteps based upon the displacement direction (cf. fig. 1.1 of Atkinson, 1987). A similar classification can also be applied to bends. (a) Oversteps and bends which are visible in sections parallel to the fault displacement direction can be termed in-plane (mode II). These include oversteps and bends along normal faults in cross-section (as discussed in this paper) and along strike-slip faults in map view. (b) Oversteps and bends that are visible in sections which are perpendicular to the fault displacement direction can be termed anti-plane (mode III). These include oversteps and bends along normal faults in map view and lateral ramps along thrusts (Bayer and Elliott, 1982; Butler, 1982). Oblique oversteps and bends have both in- and antiplane behaviour. In-plane and oblique structures can be further divided into those that are extensional or contractional. This classification can be applied to normal, reverse, strike-slip and oblique-slip faults.
Fault oversteps and bends are of interest because they have important effects on various geological processes. For example, oversteps (Sibson, 1989) and bends (King and Nabelek, 1985) are important sites for earthquake initiation and termination, and for aftershock activity. The structures which develop at oversteps and bends can make them important locations for hydrocarbon migration and entrapment (Larsen, 1988; Morley et al., 1990; Peacock and Sanderson, 1994b1, and for mineralisation (e.g., Dunham, 1988). Erosion and sedimentation can also be controlled by structures at oversteps and bends along normal faults (e.g., Gawthorpe and Hurst, 1993).
Tectonophysics 234 (1994) 147-167
The term overstepping faults is used to describe sub-parallel but non-coplanar faults when the distance between the tips is smaller than the fault lengths (Biddle and Christie-Blick, 1985). A bend is here defined as an irregularity in an otherwise approximately planar fault surface. Fault oversteps and bends can be described and classified by their relationship to the overall displacement direction, using a modification of the terminology of fracture propagation modes (Fig. I). In this paper, we describe the geometries of normal faults with displacements of less than about 2 m, at Flamborough Head (Humberside, U.K.) and at Kilve (Somerset, U.K.) (Peacock and Sanderson, 1992), the locations of which arc shown in Fig. 2. Data collected for each overstep and bend include: (1) fault dips and the amount
Fig. 2. Map of the British Isles showing the locations of field areas at K.ilve and Flamborough Head. The Kilve field area includes structures in Lower Jurassic limestones and mudrocks, between Watchet (grid reference STO80433) and Lilstock (ST196462). 6 km of Cretaceous Chalk coastal cliffs have been studied along the south coast of Flamborough Head, between Sewerby (TA201686) and High Stacks (TA257704).
l3.C.P. Peacock, X. Zhang/ Tectonophysics 234 (19941 147-167
of refraction; (2) bed thicknesses and thickness variations; (3) distances between overstepping segments; (4) displacements; and (5) observations on the minor structures which occur. Detailed mapping of such small, well-exposed fault zones is easier than mapping larger faults, which are usually imperfectly exposed. To augment the field examination of faults, numerical modelling using UDEC (Universal Distinct Element Method, version ICG 1.6, 1990) has been undertaken. Various authors have demonstrated applications of the Distinct Element (DE) method. Cundall et al. (1978) compare DE predictions with a rock slope first analysed by Goodman and Bray (1976) and show that, for a given slope, the DE method gives a limiting force that is only 1% lower than the value calculated from analytical solutions. Savilahti et al. (1990) use shear box testing and DE modelling to study joint bridges, with their simulated results being similar to experimental results. Saltzer and Pollard (1992) use the DE method to model structures formed in cover sediments by the reactivation of basement-controlled normal faults. A possible problem with the UDEC method is that mechanical parameters have to be selected, and different values may give markedly different results. If this is the case, then the models would say little about the behaviour of the field examples, the mechanical parameters of which are poorly constrained. To test this, we have undertaken a sensitivity analysis. The aim of this modelling is not to specifically quantify the defo~ation of the field examples, but to identify the patterns of deformation produced by different fault geometries.
2. Field examples of oversteps and bends Well-exposed normal faults occur in coastal cliff sections at Flamborough Head (Humberside) and Kilve (Somerset) (Peacock and Sanderson, 1992). 1340 normal and extensional oblique-slip faults occur along the south coast of Flamborough Head, in the 6 km between Sewerby (TA20166866) and High Stacks (TA25787041) (Peacock and Sanderson, 1994a), which is in the
149
middle of the Cretaceous chalk sequence. The area examined at Kilve extends from Blue Ben (ST123439) to Lilstock (ST168455). It comprises Lower Jurassic mudrocks and limestones which are affected by E-W-striking normal faults (Peacock and Sanderson, 1991, 1992), some of which show late Cretaceous or early Tertiary contractional reactivation. 2.1. Extensional ouersteps and bends at Flamborough Head
Extensional oversteps and bends are common at Flamborough Head and in chalk elsewhere (figs. 8 and 9 of Koestler and Ehrmarm, 1991; fig. 3f of Bevan and Hancock, 1986). Extensional oversteps are accommodated by thickening or folding of layers, by antithetic faults, or by rhomb-shaped pull-aparts which appear to be filled by calcite and finely brecciated chalk (Fig. 3). The chalk beds in which the oversteps are located appear to have the same characteristics as the rest of the sequence, and there does not appear to be a preferential development of extensional oversteps in particular layers. This implies that they are not controlled by lithology, but that they formed when two initially isolated faults propagated towards each other and interacted. 2.2. Extensional bends at Kiive At Kilve, faults usually change dip through different beds. Pull-aparts occur in limestone beds (Fig. 4), where the faults have steeper dips than in the mudrocks (Peacock and Sanderson, 1991, 1992). The 50 pull-aparts which were analysed show a mean refraction of 33” (range of 13” to 73”), a mean displacement of 77.5 mm (range of 7 mm to 400 mm) and a mean width of 44 mm (range of 4 mm to 320 mm). They are mostly filled by calcite (fig. 8a of Peacock and Sanderson, 1992), but a few are filled by mudrock material which flowed in from adjacent beds (Fig. 4a). Pull-aparts may also be filled by brecciation (Fig. 3b) or by wall-rock folding (Fig. 3a and Waltham, 1990).
150
(a)
D.C.P. Peacock. X. Zhang / Tectonophysics 234 (1994) 147-167
,. 1OOmm
Fig. 3. Line drawings of extensional oversteps at Flamborough Head. (a) A pull-apart occurs at an overstep, which is filled by folding of beds and by some brecciation. (c) Overstep in which the folding and extension of beds is accommodated by antithetic faults. The black areas at the overstep are voids. (b) Pull-apart between two overstepping faults, at which the thickening of the bed appears to be accommodated by fine brecciation.
D.C.P. Peacock, X. Zhang/
2.3. Contractional oversteps and bends at Flamborough Head
Contractional oversteps and bends at Flamborough Head are preferentially developed in finely
08
/
Tectonophysics 234 (1994) 147-167
151
bedded chalk/marl units, which occur between thicker chalk beds (Fig. 5). Thus, unlike the extensional oversteps, they are usually strongly controlled by lithology. Displacement is transferred between segments and around bends by thinning
0-
x
0
‘y x
10
2OO’ 30
40 SO
60
QQ?/:-/
1 I
m 807 90 0
I 4
I 8
I 10
15
-WncY
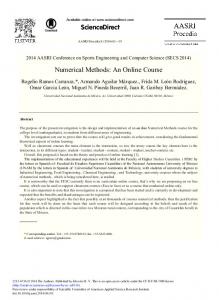
~=P0I0t0fauttktsbat0 x - Pole t0 fault in timestone Fig. 4. (a) Line drawing of a mudrock-filled pull-apart (extensional bend) at Kilve (grid reference ST13144400), caused by the fault being refracted at a higher angle through a limestone bed than in the mudrocks. (b) Stereogram of poles to faults at Kilve. The faults strike dominantly E-W, with steeper dips occurring in the limestones than in the mudrocks. (c) Bar graph of the amount of refraction of faults through beds to form pull-aparts. Refraction is the change in dip of a fault through different beds.
and drag-folding of marl units, or by synthetic and/or antithetic faults. Beds are thinned by up to nearly 100% at bends or oversteps (Fig. 6~1,
nag
x&thinning ,....
showing that a large amount of compaction can occur. Fractures which are radial in cross-section occur in the foot- or hanging walIs of some con-
,’
Fig. 5. Line drawings of contractional oversteps and bends at Flamborough Head. (a) Thinning of beds, a network of small-scale synthetic and antithetic faults, and possibly a low-angle connecting fault occur at the overstep. (b) Contractional bend where the fault is strongly refracted through a marl unit, with normal drag, small-scaie faults and thinning ( = 6O%c)of the marl occurring.
D.C.P. Peacock, X. Zhang/
Tectonophysics 234 (1994) 147-167
153
Fig. 5 (c) Contractional bend at which radial fracturing occurs in the hanging wall (cf. fig. 10 of Koestler and Ehrmann, 1991). Cd) Contractional bend with - 0.5 m displacement, at which drag-folding occurs in the hanging wall. (e) Contractional bend with a small displacement in relation to the size of the bend, so only a small amount of thinning of beds occurs. The bend has a displacement minimum and a ramp/ flat geometry.
154
D. C. P. Peacock. X. Zhang / Tectonop~ysic.~ 234 (19941 f47- 167
Fig. 5 (continued).
tractional bends (Fig. 5~1, and detachment faults appear to link some overstepping segments (Fig. 5e). Data have been collected for 60 contractional oversteps and 42 contractional bends. The wide variety of overstep and bend geometries that occur is illustrated in Fig. 6. Four possible models for the development of fault bends at Flamborough Head are illustrated in Fig. 7. The faults have the following characteristics: (1) Bedding-parallel stylolites are displaced by the faults and are often brecciated in fault zones, showing that they post-date the faults. (21 Smaller-scale faults (Fig. Sa), radial fracturing (Fig. 5~) and drag of wall-rocks (Fig. 5d1 occur at contractional oversteps and bends. (3) Segmentation is clearly identifiable along many faults, with some fault zones showing both extensional and contractional oversteps. Extensional oversteps are unlikely to result from the pressure solution of an originally planar fault. (4) Many of the oversteps show a wide separation (e.g., Fig. Se), which wouId need hundreds of millimetres of compaction or solution. (5) The larger (> 0.5 ml displacement faults
often show bends which appear to represent original oversteps which have been broken as fault displacement increased (Fig. Sd).These features all suggest that the third model (Fig. 7~) is not applicable. The fourth model (Fig. 7d) is also improbable because there is no evidence for a common sense of overstep. This means that the bends probably result from refraction of single faults through marl layers (Fig. 7a) and from the linkage of initially overstepping segments (Fig. 7b). The similar sizes of the oversteps and bends (Fig. 6) suggests that they may have formed in similar ways. Also, the mean displacement of faults at oversteps is 55.4 mm, whilst the mean displacement at bends is 88 mm, suggesting that bends may have originated as oversteps (Fig. 7b). Displacement-distance (d-x) analysis of the faults at Flamborough Head is difficult because only small lengths of the faults are visible and because the homogeneous nature of the chalk makes it difficult to match many beds across faults. Figure 5(e) does, however, show a distinct displacement minimum at a contractionat bend. Such displacement minima are typical of fault bends (Ellis and Dunlap, 1988; Peacock, 1991).
D.C.P. Peacock, X. Zhang/
Tectonophysics 234 (1994) 147-167
2.4. Importance of the ratio of brittle to less brittle layers
The normal faults at Flamborough Head are similar to those at Kilve because they tend to cut
(a) 400 .
1
.
0
600
Overstep(mm)
(w
155
less brittle layers at a lower angle than the brittle layers. There are differences in the fault geometries in the two areas, however, because of the different ratios of brittle to less brittle layers (Fig. 8). Rawson and Wright (1992, fig. 35) show a 164 m-thick chalk sequence at Flamborough Head containing about 810 mm of the less brittle marl, in 31 beds each up to 60 mm thick, giving a chalk to marl ratio of 201. Shear fractures occur in the chalk and contractional oversteps and bends commonly occur in the less brittle marls. At Kilve, a much lower proportion of the sequence is composed of brittle layers (limestones) than at Flamborough Head. The mean thickness of limestone beds is about 196 mm (range of 12 mm to 490 mm, n = 50) and the mean thickness of the mudrocks is about 508 mm (range of 35 mm to 2150 mm, it = 981, giving a limestone to mudrock ratio of approximately 0.39. Extensional bends (pullaparts) are common in the limestones at Kilve, where faults initiate as extension fractures (Peacock and Sanderson, 1992).
400
.
3. Numerical modelling of oversteps and bends
T 5
The distinct element (DE) method was pioneered by Cundall, largely through his development of UDEC (Cundall, 19711, which is an implementation of the DE method. UDEC enables the deformation of faulted rock masses to be modelled, with the deformation consisting of
% 0
tuio
0
Overstep (mm) @I loo-
-1
ii0
0
0-W
(mm)
Fig. 6. Data for 102 contractional oversteps and bends at Flamborough Head, illustrating the wide variety of geometries that occur. The faults have a mean dip of 61” outside the oversteps and bends (range of 42” to 88”), with the bends having a mean refraction of 35” (range of 16” to 63”). (a) Scatter graph of overstep against displacement. They show a mean displacement of 69 mm (range of 10 mm to 350 mm). (b) Scatter graph of overstep against overlap. The mean separation between overstepping segments (measured perpendicular to the segments) is 130 mm, whilst the mean distance between the portions of a fault away from a bend is 126 mm. This suggests that there is no scale difference between the contractional oversteps and bends. Cc) Scatter graph of overstep against percent compaction, calculated by dividing the bed thickness outside the overstep or bend by the bed thickness inside the overstep or bend.
156
D.C.P. Peacock, X Zhang/
Tectonophysics 234 (1994) 147-167
Fig. 7. Models for the development of contractional bends at Flamborough Head. Three stages of development (I, II and III) are shown for each model, with the final stage (III) being geometrically similar for each model. There is a tendency for area reduction at the overstep. (a) A propagating fault is refracted at a lower angle through a less brittle marl unit. Refraction of faults through different layers appears to be a common process (e.g., Dunham, 1988; Peacock and Sanderson, 1992). (b) Two initially overstepping faults link across a marl unit, which may have hindered fault propagation (see Peacock, 1991). Cc) An originally planar fault is affected by later compaction or pressure solution (Davison, 1987; J. Walsh, pers. commun., 1992). Cd) An initially planar fault is affected by shear along a marl unit.
D.C.P. Peacock, X. Zhang / Tectoeophysics
elastic/plastic deformation of blocks of intact rock, and of displacement and/or opening along interfaces between the blocks (fractures). Each block of intact rock is divided into finite difference triangles (Cundall et al., 1978; Cundall and Hart, 1985; Lemos, 1987; Last and Harper, 1990). The amount of displacements relative to the fractures can be determined directly from the geometries, translations and rotations of blocks. The force-displacement law relates incremental normal and shear forces (>F,, MI,) to the amount of
157
234 (1994) 147-167
incremental thus:
relative
displacement
(Su,,
Su,),
6F,,= K,6u,
(1)
6F, = K,iSu,
PI
where K, and K, are the contact normal and shear stiffnesses respectively. Stress increments can be expressed in terms of the fracture stiffness. There are two essential features of an appropriate UDEC model for simulating deformation.
Fig. 8. Affect on fault geometry of variations in the ratio of brittle to less brittle layers. (a) Pull-aparts develop in brittle layers when there is a lower proportion of brittle material than less brittle material, as at Kilve. (b) Contractional oversteps and bends develop in less brittle layers when there is a higher proportion of brittle material than less brittle material, as at Flamborough Head.
D.C.P. Peacock. X. Zhang/
158
First, faults are modelled as discrete structures rather than considering them as zones of weakened material. Second, representative constituTable 1 Material parameters used in the UDEC modelling, which were selected on the basis of similarity with Flamborough Head and Kilve. For simplicity, the densities of all four rock types are modelled as 2500 kg/m” and the water density is selected as 1000 kg/m3. “Interfaces” include faults and bed boundaries. The values for the chalk and marl have been used in the sensitivity analysis Rock type
Properties
Chalk
Chalk cohesion Chalk tensile strength Chalk shear modulus Chalk bulk modulus Chalk friction angle Interface cohesion Interface tensile strength Interface shear modulus Interface bulk modulus Interface friction angle
I 2.4 5 35 0 0 2.4 5 30
MPa MPa GPa GPa Degrees MPa MPa GPa/m GPa/m Degrees
Marl
Marl cohesion Marl tensile strength Marl shear modulus Marl bulk modulus Marl friction angle Interface cohesion Interface tensile strength Interface shear modulus Interface bulk modulus Interface friction
0.75 0.25 0.96 2 35 0 0 0.96 2 30
MPa MPa GPa GPa Degrees MPa MPa GPa/m GPa/m Degrees
Limestone
Limestone cohesion Limestone tensile strength Limestone shear modulus Limestone bulk modulus Limestone friction angle Interface cohesion Interface tensile strength Interface shear modulus Interface bulk modulus Interface friction angle
6 2 4.8 IO 35 0 0 4.8 IO 30
MPa MPa GPa GPa Degrees MPa MPa GPa/m GPa/m Degrees
Mudrock Mudrock Mudrock Mudrock Mudrock Interface Interface Interface Interface Interface
1.5 0.5 1.92 4 35 0 0
MPa MPa GPa GPa Degrees MPa MPa GPa/m GPa/m Degrees
Mudrock
Values
cohesion tensile strength shear modulus bulk modulus friction angle cohesion tensile strength shear modulus bulk modulus friction angle
3
1.92 4 30
Units
Tectonophysics 234 (19941 147-167
tive behaviour of the faults and rock blocks can be selected (e.g., yield, sliding, dilation and antidilation). In UDEC, deformation occurs both along the fractures and within the blocks. A potential problem with UDEC is that it can involve the overlap of adjacent blocks; such interpenetration is reduced by the careful selection of mechanical parameters (Table 1). Another potential problem with UDEC is that the locations of the fractures are pre-determined, so care has to be (a) Model 1
(b) Model 2
(c) Model 3A
(d) Model 38
Fig. 9. Initial geometries of the oversteps and bends simulated in the UDEC modelling (see Table 1 for parameters). All of the models have a 3 m x 3 m cross-sectional area. The middle layers of each mode1 are sub-divided into blocks so that the deformation and displacements can be observed in detail, and so the middle layers are more deformable. Figs. 9(a) to 9(e) are for the chalk/marl sequence at Flamborough Head. (a) Extensional overstep (Model 1). (b) Contractional overstep (Mode1 2). (c) Contractional bend with a refraction angle of 25” (Model 3A). (d) Contractional bend with a refraction angle of 35” (Model 3B). (e) Contractional bend with a refraction angle of 50” (Model 30. (f) Extensional bend in the limestone/mudstorie sequence at Kilve (Model 4).
D.C.P. Peacock, X. Zhang/
taken about the possible further development fractures.
of
3.1. Geometries, boundary conditions and material parameters used Numerical modelling using UDEC has been carried out to simulate the deformation at oversteps and bends at Flamborough Head and Kilve. The models represent a 3 m X 3 m cross-sectional area and have geometries typical of the field examples (Fig. 9). The initial geometries (Fig. 9) and material parameters (Table 1) of the numerical models were selected to be similar to the field examples. The mechanical conditions are illustrated in Fig. 10. For the chalk/marl sequence at Flamborough Head, extensional and contractional oversteps have been simulated (Figs. 9a and 9b), as have contractional bends with three different refraction angles (Figs. 9c to 9e). An extensional bend was simulated for the lime-
Free surf&roe
159
Tectotwphysics 234 (1994) 147-167
stone/mudrock sequence at Kilve (Fig. 9f). The middle layers of all the models are sub-divided into blocks so that the deformation and displacements can be observed in detail. Displacement can occur along the boundaries of these subblocks, which tends to make the middle layers more deformable. The material parameters used in the modelling are shown in Table 1. The chalk stiffness was selected to represent a strong chalk (Clayton, 1989), whilst the stiffness of the marl was selected to be 40% that of the chalk. For the model of the rocks at Kilve, the stiffness of the mudrock was selected as 40% that of the limestone. These parameters have been altered in a sensitivity analysis (see below). In the initial models (Fig. 9), the interfaces have been given the same shear and bulk moduli as the host materials in which they occur (Table 1) because there is no evidence that they are different. The shear and bulk moduli have been changed in the sensitivity analysis. The interfaces
0,=5MPa
Gravity
-3m02 - 0.40, 0; - 0 0, -
5.075 MPa
Fig. 10. Mechanical conditions applied to the simulated oversteps and bends, which have a 3 m x 3 m area. The models are “loaded”, where load equals force multiplied by time. The maximum principal stress (or) is approximately vertical and is caused by gravity. or = 5 MPa at the top boundary of the simulated rock mass, (corresponding with a depth of approximately 200 m beneath the surface), whilst (rr = 5.075 MPa at the bottom boundary, with the increase being caused by gravity. The minimum principal stress (a,) is horizontal and has a magnitude of 2 MPa to 2.03 MPa, with the variation being caused by gravity. The effect of gravity is taken into account because boundary conditions of force balance are necessary to obtain correct geometries. The models are in force equilibrium. With 2 MPa fluid pressure (water density = 1000 kg/m3), the maximum effective stress to;) is reduced to 3 MPa and the minimum effective stress (ai) is zero. A tensile effective stress in the horizontal direction is indicated in the field examples by sub-vertical veins (Peacock and Sanderson, 1992). For each model, the applied stress conditions are the same, but the loading times vary to produce similar displacements.
160
D.C.P. Peacock, X. Zhang/
Tectonophysics 234 (1994) 147-167
I = 13.8 MPa
Fig. 11. (a) Deformation at an extensional overstep (Model 1) after loading. The maximum displacement is 0.235 m, with block rotation and void formation occurring in the pull-apart. (b) Stress distribution after deformation (the lengths of lines are proportional to the magnitudes of the stresses). There is a stress increase in the vertical direction and a stress decrease in the horizontal direction at the overstep. Stress concentration causes the maximum effective compressive stress ((T;) at the overstep to be 13.81 MPa, i.e., higher than the 3 MPa applied at the boundaries.
between the different rock types were given the same mechanical parameters as the weaker material (marl or mudrock). The top and bottom boundaries of the host material are often quite irregular after deformation, reflecting the internal discretisation of the material. The discretisation size of the top and bottom layers was selected as 0.05 m by 0.05 m, and that of the middle layer at 0.02 m by 0.02 m. Generally, the model is more precise for smaller discretisation sizes. More precise modelling is impractical because the random memory and CPU time are quadrupled for a 50% in the discretisation size. The Mohr-Coulomb constitutive relationship, which is used in the modelling, states that:
lower cohesion and friction angles than the intact rock. A problem with UDEC is that the locations of interfaces (fractures) is set before deformation. Locally, stress can reach yield for the intact rock (given by Eq. 31, with deformation of intact rock above the yield stress being modelled as plastic. The maximum differential stress that can occur is the yield stress, and the differential stress is kept at or below the yield stress by the deformation.
7 = S + a, tan f#~
Model
(3)
where T = shear stress, S = cohesion of the rock or interface, a,, = normal stress, and 4 = friction angle of the’ rock or interface. Elastic deformation occurs below the conditions when Eq. (3) is satisfied, but the yield stress is exceeded and deformation occurs when Eq. (3) is satisfied. Most deformation occurs on the interfaces, which have
Table 2 Maximum displacements and principle stresses for the different models (Fig. 9). Positive stresses are compressive.
Model Model Model Model Model Model
1 2 3A 3B 3C 4
Maximum displacement (m)
Maximum principle stress @iPa)
Minimum principle stress (MPa)
0.235 0.134 0.074 0.067 0.053 0.231
13.81 23.44 16.79 18.75 21.64 18.52
-
0.95 0.87 0.97 0.97 0.95 1.96
161
D.C.P. Peacock, X. Zhang / Tectonophysics 234 (1994) 147-167
I
I
\
I
(1
I
,.
I
I’
I
\
\\
\
\ ’ \ \
,
I
I = 23.4 MPa
Fig. 12. (a) Deformation at a contractional overstep (Model 2) after loading. The maximum displacement of the fault is 0.134 m and the marl has been thinned in the vertical direction by 20% at the overstep. Some horizontal extension occurs on the faults. (b) Stress distribution after loading. In contrast to the extensional overstep, there is an overall stress increase at the overstep. The maximum U; value is 23.44 MPa.
3.2. Model 1: extensional overstep
than the marl (Table 1). Figure 11(a) shows the deformation at the overstep after loading has produced the maximum displacement of 0.235 m. Extension has occurred in both the vertical and horizontal directions to produce a pull-apart,
Model 1 (Fig. 9a) is a simulation of an extensional overstep in the chalk/marl sequence at Flamborough Head, in which the chalk is stiffer
(a)
(W
I = 16.79 MPa Fig. 13. (a) Deformation at a contractional bend with a refraction angle of 25” (Model 3A) after loading. The marl has been thinned by 12% in the vertical direction at the bend, with large displacements occurring along the fault in the chalk. (b) Stress distribution after deformation. The maximum compressive stress is 16.79 MPa, with an overall stress increase occurring at the bend.
which has been accommodated by block rotation and void formation. A stress decrease in the horizontal direction and a stress increase in the vertical direction occur at the overstep (Fig. lib). The maximum magnitude of compressive stress within the simulated region is 13.81 MPa (Table 2), which is much higher than the 3 MPa applied at the top boundary. This is because the non-uniformity of the deformation causes stress concentrations to develop at the overstep. 3.3. Model 2: contractional overstep Model 2 (Fig. 9b) is a simulation of a contractional overstep in the chalk/marl sequence at Flamborough Head. The overstep occurs in a marl layer, which is less brittle than the chalk layers above and below. After loading has produced a displacement of 0.134 m (Fig. 12a), the marl at the overstep has been thinned vertically by about 20%, although drag produces localised vertical extension at the chalk/ marl interfaces outside the overstep. Some horizontal extension occurs along the faults to accommodate deforma-
(a)
tion at the overstep. There is also a tendency for the faults to develop extensional openings behveen different units at bends, probably because the different stiffnesses of the layers result in discontinuity of deformation (Fig. 12b). In contrast to the extensional overstep (Model I), there is a stress increase in the horizontal direction at the contractional overstep (Fig. 12b). a; has a maximum magnitude of 23.44 MPa (Table 2). with higher stress concentrations being more likely to occur at contractional oversteps than at extensional oversteps. 3.4. Model 3: co~tr~ctio~~~ bends Model 3 (Figs. 9c to 9e> comprises simulations of contractional bends with different fault refraction angles (ZY, 35” and 50” respectiveIy) through marls in the chalk sequence at Flamborough Head. For the 25” bend, loading has caused a maximum displacement of 0.074 m and a vertical thinning of 12% of the marl at the bend (Fig. 13a). For a given loading, fault displacement and thinning both decrease, and stress concentrations
(4
I = 18.75 MPa
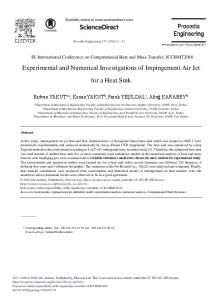
Fig. 14. (a) Deformation at a contractional bend with a refraction angle of 35” (Model 3B) afte- iaading. Vertical thinning of 10% has occurred in the marl at the bend, caused both by plastic deformation and by the geometric change caused by fault displacement. (b) Stress distribution after deformation. The m~mum compressive stress is 18.75 MPa, with an overah stress increase occurring at the bend. (cf Displacement distribution along the fault, with displacement being proportional to the thickness of the shaded area. The maximum displacement is 0.067 m and occurs in the chalk. There is a displacement minimum at the bend. in the marl (see Fig. 5e).
D.C.P. Peacock, X. Zhang / Tectonophysics 234 (1994) 147-167
163
(a)
I= 21.64 MPa
Fig. 15. (a) Deformation at a contractional bend with a refraction angle of 50” (Model 3C) after loading. Vertical thinning of 8% has occurred in the marl at the bend. (b) Stress distribution after deformation. The maximum compressive stress is 21.64 MPa, with an overall stress increase occurring at the bend.
increase, as the fault refraction angle increases (Figs. 13a-15a and Table 2). Large compressive stresses occur in radial patterns in the foot- and hanging walls of the contractional overstep and bends (Figs. 12b-15b). These radial compressive stresses may cause radial fractures, as are observed at Flamborough Head (Fig. 5~). Displace-
ments along the faults (Fig. 14~) are approximately constant in the more brittle chalk, but is much smaller in the marl. This is because the deformation in the marl consists of both fault displacement and plastic deformation. Such a displacement distribution is typical of fault bends (e.g., Fig. 5e).
(a)
r = 18.52 MPa Fig. 16. (a) Deformation at an extensional bend (Model 4) after loading has caused a displacement of 0.231 m to develop. Extension occurs in both the vertical and horizontal directions, producing a pull-apart. (b) Stress distribution after deformation. There is an overall stress decrease at the bend.
164
D.C.P. Peacock, X. Zhang/
Tectonophysics 234 (1994) 147-167
3.5. Model 4: extensional bend
3.6. Sensitivity analysis
Model 4 (Fig. 9f) is a simulation of an extensional bend in the limestone/mudrock sequence at Kilve, where the middle limestone layer is harder than the mudrocks. Figure 16(a) shows the deformation of the bend after loading has produced a maximum displacement of 0.231 m. Extension occurs in both the horizontal and vertical directions, producing a pull-apart. There is a stress increase at the bend (Fig. 16b), with a; having a maximum value of 18.52 MPa (Table 2). A large tensile stress has developed.
A sensitivity analysis has been carried out to examine the effects of variations in material properties on the deformation. Using the geometry and material properties of Model 3B, 12 different simulations have been run, changing one mechanical parameter in each simulation. The results are shown in Table 3, and the deformations in six of the simulations are illustrated in Fig. 17. For example, the friction angle of the interfaces, which include the faults, has a strong effect on displacement. The tensile strength of
Table 3 Results of the sensitivity analysis, showing the maximum displacements and magnitudes of the principle stresses of Model 3B, using different material properties. Model
Material property displacement (ml
Maximum displacement
Maximum principle stress (MPa)
Minimum principle stress (MPa)
Al
Interface cohesion = 0.5 MPa
0.044
17.48
- 0.98
A2
Interface cohesion = 0.2 MPa
0.031
15.08
- 0.97
Bl
Fault shear modulus of marl = 0.48 GPa/m Fault bulk modulus of marl = 1 GPa/m
0.033
16.86
- 0.99
B2
Fault shear modulus of marl = 1.92 GPa/m Fault bulk modulus of marl = 4 GPa/m
0.052
15.5
- 0.97
Cl
Interface friction angle = 15”
0.128
20.21
- 0.89
c2
Interface friction angle = 45
0.027
15.36
- 0.97
Dl
Chalk cohesion = 1 MPa Chalk tensile strength = 0.333 MPa Marl cohesion = 0.25 MPa Marl tensile strength = 0.0833 MPa
0.087
13.11
- 0.32
D2
Chalk cohesion = 5 MPa Chalk tensile strength = 1.667 MPa Marl cohesion = 1.25 MPa Marl tensile strength = 0.417 MPa
0.038
19.31
- 1.61
El
Chalk tensile strength = 0.6 MPa Marl tensile strength = 0.15 MPa
0.066
14.93
- 0.59
E2
Chalk tensile strength = 2 MPa Marl tensile strength = 0.5 MPa
0.059
19.3
- 1.87
Fl
Rock friction angle = 25”
0.088
11.71
- 0.97
F2
Rock friction angle = 45”
0.095
20.01
- 0.96
D.C.P. Peacock, X. Zhang / Tectonophysics234 (I994) 147-167
(a)
165
magnitudes of displacement and stress caused by variations in mechanical properties (TabIe 31, the overall geometries of deformation are very similar; the patterns of displacement and stress show little variation with different mechanical parameters (Fig. 17). This suggests that fault geometry can be a more important factor in controlling deformation than the mechanical properties of the rocks. The spacing and patterns of interfaces in the middle layers of the models (Fig. 9) were selected to clearly illustrate the deformation that occurs at oversteps and bends. Changes in the spacing or pattern has an affect on the magnitudes of displacements and stresses, but again has little effect on the pattern of deformation.
4. Discussion: comparison between field observations and numerical models, and large-scale examples
Fig. 17. Examples of the results of the sensitivity analysis, showing the deformation of a contractional bend with a refraction angle of 35” (Fig. 9d) with different material parameters being used. The material parameters selected, the maximum displacements and the magnitudes of the maximum principle stresses for each model are given in Table 3. (a) Deformation with an interface (fault) cohesion of 0.5 MPa (model Al). (b) Deformation with an interface (fault) cohesion of 0.2 MPa (model A2). (c) Deformation with an fault friction angle of 15” (model Cl). (d) Deformation with an fault friction angle of 45” (model C2). (e) Deformation with a chalk cohesion of 1 MPa and tensile strength of 0.333 MPa, and with a marl cohesion of 0.25 MPa and tensile strength of 0.0833 MPa (model Dl). (0 Deformation with a chalk cohesion of 5 MPa and tensile strength of 1.667 MPa, and with a marl cohesion of 1.25 MPa and tensile strength of 0.417 MPa (model D2).
the intact rock has only limited effect on displacement, but has a strong effect on values of tensile stresses. In spite of such variations in the
Many deformation features of the models are very similar to structures observed in the field, so well-constrained numerical models can give information about the development of oversteps and bends. The modelled extensional overstep (Fig. 11) shows block rotation towards the hanging wall and void fo~ation, which is very similar to that illustrated in Figs. 3(a) and 3(b). Thinning at the modelled contractional overstep and bends (Figs. 12-15) also occurs in the field examples (Fig. Sb), and the development of a radial stress system (Fig. 12b) is consistent with the development of radial fractures at oversteps and bends (Fig. 5~). The high stresses which develop at modelled contractional oversteps and bends are compatible with the thinning that occurs in field examples. Void formation in the brittle layer at the modelled extensional bend (Fig. 16) is similar to that in Fig. 4(a). Oversteps and bends along normal faults are often shown on seismic sections, The geometries of such large-scale structures are often very similar to the small-scale oversteps and bends at Flamborough Head and Kilve. For example, Dunham (1988) describes economically-exploited mineralised pull-aparts along normal faults in
I66
D.C.P.
Peucock. X Zhang/
northern England. Chapman and Meneilly (1991, fig. 6) show a contractional overstep along a normal fault in the southern North Sea, at which layering has been thinned. Beach and Trayner (1991, fig. 2) give good examples of contractional bends. Vendeville (1991) describes physical models and large-scale examples of bends along normal faults.
Tectonophysics 2.?4 Il994)
f47-16:
tional bends probably correspond with radial fractures observed in the field. (6) A sensitivity analysis of the numerical models shows that, even though variations in mechanical parameters cause variations in displacements and stresses, the general patterns of deformation are similar. This means that the deformation at fault oversteps and bends is strongly controlled by fault geometry.
5. CoucIus~ons Acknowledgements From this study of the geometry and development of oversteps and bends along normal faults in cross-section, we can make the following conclusions: (1) Oversteps and bends can be classified on the basis of their relationship to the displacement direction using a modification of the termino~o~ of fracture modes. Such a classification is applicable to normal, reverse, strike-slip and oblique-slip faults. (2) Pull-aparts, minor faults, brecciation and the folding of wall-rocks can occur at extensional oversteps. Compaction and pressure solution appear to be important processes at contractional oversteps and bends. (3) The contractional oversteps and bends at Flamborough Head probably result from the refraction of faults at a lower angle through less brittle marls, or from the interaction of two initially isolated faults. Lithological variations have important effects on fault geometries. Contractional bends occur in less brittle layers when there is a high proportion of brittle material in the sequence. Extensional bends occur in brittle layers when there is a high proportion of less brittle material in the sequence. (4) Thickening, block rotation, void formation and stress decreases occur at modelled extensional oversteps and bends, which is compatible with the extensional oversteps and bends observed in the field. (5) Compaction and stress increases at contractional oversteps and bends occur in the numerical models, which is compatible with the thinning of beds observed in the field. Radial compressive stresses at the modelled contrac-
Funding was provided by Amoco (Peacock) and by the Natural Environment Research Council (Zhang). David Sanderson and Tom Patton are thanked for their help. Reviews by Simon Cox, Ian Davison and Terry Engelder are greatly appreciated.
References Aki, K., 1979. Characterization of barriers on an earthquake fault. J. Geophys. Res., 84: 6140-6148. Atkinson, B.K., 1987. Introduction to fracture mechanics and its geophysical applications. In: B.K. Atkinson (Editor), Fracture Mechanics of Rock. Academic Press, London, pp. l-26. Beach, A. and Trayner, P., 1991. Thegeometry of normal faults in a sector of the offshore Nile Delta, Egypt. In: A.M. Roberts, G. Yielding and B. Freeman (Editors), The Geometry of Normal Faults. Geol. Sot. London, Spec. Publ., 56: 173-183. Bevan, T.G. and Hancock, P.L., 1986. A late Cenozoic regional mesofracture system in southern England and northern France. J. Geol. Sot. London, 143: 355-362. Biddle, K.T. and Christie-Blick, N., 1985. Glossary - strikeslip deformation, basin formation, and sedimentation. In: K.T. Biddle and N. Christie-Blick (Editors), Strike-Slip Deformation, Basin Fo~ation, and Sedimentation. Sot. Econ. Mineral., Spec. Pub]., 37: 375-386. Boyer, S.E. and Elliott, D., 1982. Thrust systems. Bull. Am. Assoc. Pet. Geol., 66: 1196-1230. Butler, R.W.H., 1982. The te~inolo~ of structures in thrust belts. 3. Struct. Geol., 4: 239-245. Chapman, T.J. and Meneilly, A.W., 1991. The displacement patterns associated with a reverse-reactivated normal growth fault. In: A.M. Roberts, G. Yielding and B. Freeman (Editors), The Geometry of Normal Faults. Geoi. Sot. London, Spec. Pub]., 56: 183-191. Clayton, C.R.I., 1989. The mechanical properties of the Chalk. In: J.B. Burland, R.N. Mortimore, L.D. Roberts, D.L.
D.C.P. Peacock, X. Zhang / Tectonophysics 234 (1994) 147-167
Jones and B.O. Corbett (Editors), Chalk. Thomas Telford, London, pp. 213-233. Crone, A.J. and Hatier, K.M., 1991. Segmentation and the coseismic behavior of Basin and Range normal faults: examples from east-central Idaho and southwestern Montana, U.S.A. J. Struct. Geol., 13: 151-164. Cundall, P.A., 1971. A computer model for simulating progressive, large scale movements in blocky rock systems. Proc. Symp. Int. Sot. Rock Mechanics, Nancy, Pap. B-2. Cundall, P.A. and Hart, R.D., 1985. Development of generalized 2-D and 3-D distinct element programs for modeliing jointed rock. Itasca Consulting Group, Misc. Paper SL-85 1, U.S. Army Corps of Engineers. Cundall, P.A., Marti, J., Beresford, P., Last, NC. and Asgian, M., 1978. Computer modelling of jointed rock masses. U.S. Army Eng., WEST Tech. Rep., N-74-8. Davison, I., 1987. Normal fault geometry related to sediment compaction and burial. J. Struct. Geol., 9: 393-402. Dunham, K.C., 1988. Pennine mineralisation in depth. Proc. York& Geol. Sot., 47: l-12. Ellis, MA. and Dunlap, W.J., 1988. Displacement variation along thrust faults: implications for the development of large faults. J. Struct. Geol., 10: 183-192. Gawthorpe, R.L. and Hurst, J.M., 1993. Transfer zones in extensional basins: their structural style and influence on drainage development and stratigraphy. J. Geol. Sot. London, 150: 1137-11.52. Goodman, R.E. and Bray, J.W., 1976. Toppling of rock slopes. In: Rock Engineering for Foundations and Slopes. Proc. ASCE, Spec. Conf., Boulder, CO, vol. 2, 141 pp. King, G.C.P. and NQbeIek, J., 1985. Role of fault bends in the initiation and termination of earthquake ruptures. Science, 288: 984-987. Koestler, A.G. and Ehrmann, W.U., 1991. Description of brittle extensional features in chalk on the crest of a salt ridge (NW Germany). In: A.M. Roberts, G. Yielding and B. Freeman (Editors), The Geometry of Normal Faults, Geol. Sot. London, Spec. Publ., 56: 113-123. Larsen, P.-H., 1988. Relay structures in a Lower Permian basement-involved extensional system, East Greenland. J. Struct. Geol., 10: 3-8. Last, N.C. and Harper, T.R., 1990. Response of fractured rock subject to fluid injection. Part I: Development of a numerical model. Tectonophysi~, 172: l-31. Lemos, J.V., 1987. A distinct element model for dynamic analysis of jointed rock with application to dam foundations and fault motion. Ph.D. Thesis, University of Minnesota.
167
Morley, C.K., Nelson, R.A., Patton, T.L. and Munn, S.G., 1990. Transfer zones in the East African rift system and their relevance to hydrocarbon exploration in rifts. Bull. Am. Assoc. Pet. Geol., 74: 1234-1253. Peacock, D.C.P., 1991. Displacements and segment linkage in strike-slip fault zones. J. Struct. Geol., 13: 1025-1035. Peacock, D.C.P. and Sanderson, D.J., 1991. Displacements, segment linkage and relay ramps in normal fault zones. J. Struct. Geol., 13: 721-733. Peacock, D.C.P. and Sanderson, D.J., 1992. Effects of layering and anisotropy on fault geometry. J. Geol. Sot. London, 149: 793-802. Peacock, D.C.P. and Sanderson, D.J., 1994. Strain and scaling of faults in the Chalk at Flamborough Head, U.K. J. Struct. Geol., 16: 97-107. Peacock, D.C.P. and Sanderson, D.J., 1994b. Geometry and development of relay ramps in normal fault systems. Bull. Am. Assoc. Pet. Geol., 78: 147-165. Rawson, P.F. and Wright, J.K., 1992. The Yorkshire Coast. Geol. Assoc. Guide No. 34, 117 pp. Saltzer, S.D. and Pollard, D.D., 1992. Distinct element modelling of structures formed in sedimentary overburden by extensional reactivation of basement normal faults. Tectonics, 11: 165-174. Savilahti, T., Nordhmd, E. and Stephansson, O., 1990. Shear box testing and modelhng of joint bridges. In: CA. Barton and 0. Stephansson (Editors), Rock Joints. Balkema, Rotterdam, pp. 295-308. Sibson, R.H., 1989. Earthquake faulting as a structural process. J. Struct. Geol., 11: 1;14. Vendeville, B., 1991. Mechanisms generating normal fault curvature: a review illustrated by physical models. In: A.M. Roberts, G. Yielding and B. Freeman (Editors), The Geometry of Normal Faults. Geol. Sot. London, Spec. Publ., 56: 241-249. Waltham, D., 1990. Finite difference modelling of sandbox analogues, compaction and detachment free deformation, J. Struct. Geol., 12: 375-381. Williams, G.D. and Vann, I., 1987. The geometry of hstric normal faults and deformation in their hangingwalls. J. Struct. Geol., 9: 789-795. Zhang, P., Slemmons, D.B. and Mao, F., 1991. Geometric pattern, rupture termination and fault segmentation of the Dixie Valley-Pleasant Valley active normal fault system, Nevada, U.S.A. J. Struct. Geol., 13: 165-176.