3Engineer, Rambøll Consultants, Jernbanevej 65, DK-5210. Odense NV. 4Associate Professor, Environment and Resources DTU, Technical. Univ. of Denmark.
Field Monitoring of a Permeable Reactive Barrier for Removal of Chlorinated Organics Keith C. K. Lai, M.ASCE1; Irene M. C. Lo, M.ASCE2; Vibeke Birkelund3; and Peter Kjeldsen4 Abstract: The application of zero-valent iron 共Fe0兲 in the funnel-and-gate permeable reactive barrier 共PRB兲 installed at the Vapokon site, Denmark, was conducted in 1999 to remediate the groundwater contaminated by chlorinated aliphatic hydrocarbons 共CAHs兲. Over the past 4 years, except in September 2002 and January 2003, about 92.4–97.5% CAH removal could be achieved with the PRB. Although there was a continuous decrease in total alkalinity 共90.3%兲, calcium 共81.7%兲, and sulfate 共69.2%兲 ions in the groundwater crossing the PRB, probably caused by mineral precipitation and resulting in 0.88% porosity loss per year, no noticeable deterioration of the barrier’s performance was observed between March 2000, and August 2003. Instead, climatic variation in the barrier’s performance on CAH dechlorination was examined. The dechlorination rates in the cold season 共January 2003 and March 2000兲 were generally smaller than those in the hot season 共August 2003, September 2000, and September 2001兲. Besides, 1,2-dichloroethane and dichloromethane, which were proven to be not treatable by Fe0, could also be removed with the PRB, thereby suggesting enhancement from Fe0 adsorption or microbial degradation. DOI: 10.1061/共ASCE兲0733-9372共2006兲132:2共199兲 CE Database subject headings: Ground-water pollution; TCE; PCE; Remedial action; Barriers; Cast iron; Ground-water chemistry; Denmark.
Introduction To date, the pump-and-treat system is a primary technology used in the remediation of chlorinated aliphatic hydrocarbon 共CAH兲 polluted groundwater. However, this conventional system has in the past decade been proven to be expensive and difficult to use in meeting environmental standards 共Travis and Doty 1990兲. As a consequence, the permeable reactive barrier 共PRB兲 technology has emerged recently because of its low operation and maintenance costs. Up until 2002, 31 full-scale PRBs were built 共USEPA 2002兲. In general, a PRB involves the placement of reactive materials in the subsurface environment to intercept a contaminant plume in which toxic contaminants are transformed into innocuous forms 共USEPA 1998兲. Among various reactive materials packed into PRBs, zero-valent iron 共Fe0兲 is most commonly used 共USEPA 2002兲 because of its low cost and high ability to dechlorinate CAHs over wide concentration ranges 共Hardy and Gillham 1996; Lai and Lo 2002兲. 1
Post-Doctoral Fellow, Dept. of Civil Engineering, The Hong Kong Univ. of Science and Technology, Clear Water Bay, Kowloon, Hong Kong. 2 Associate Professor, Dept. of Civil Engineering, The Hong Kong Univ. of Science and Technology, Clear Water Bay, Kowloon, Hong Kong. 3 Engineer, Rambøll Consultants, Jernbanevej 65, DK-5210 Odense NV. 4 Associate Professor, Environment and Resources DTU, Technical Univ. of Denmark. Note. Discussion open until July 1, 2006. Separate discussions must be submitted for individual papers. To extend the closing date by one month, a written request must be filed with the ASCE Managing Editor. The manuscript for this paper was submitted for review and possible publication on May 13, 2004; approved on June 27, 2005. This paper is part of the Journal of Environmental Engineering, Vol. 132, No. 2, February 1, 2006. ©ASCE, ISSN 0733-9372/2006/2-199–210/$25.00.
The mechanisms of dechlorinating CAHs by Fe0 involve a series of redox reactions. Under both aerobic and anaerobic conditions, the electrons released from the oxidation of Fe0 provide a thermodynamically favorable condition and electron source for the reduction of CAHs with concomitant release of hydroxide ions 共OH−兲 and hydrogen gas 共USEPA 1998兲. Besides, the ferrous iron 共Fe2+兲 and hydrogen gas released from the Fe0 oxidation can thermodynamically provide another electron source for the dechlorination reactions via the oxidation reaction of Fe2+ and catalytic hydrogenolysis by hydrogen gas, respectively 共Matheson and Tratnyek 1994兲. As described by Arnold and Roberts 共2000兲, hydrogenolysis and reductive--elimination are the main pathways involved in the dechlorination reactions by Fe0 共USEPA 1999兲. Apart from CAHs, the oxygen and hydrogen in groundwater can simultaneously be transformed into lower oxidation states under the chemically reducing condition exerted by Fe0. The presence of sulfate-reducing bacteria within Fe0 PRBs also leads biologically mediated reduction of sulfate 共SO2− 4 兲 into sulfide along reactive barriers, thereby highly encouraging formation of metal oxides, hydroxides, and sulfides on Fe0 surface. Further, the elevated pH in groundwater within iron barriers can decrease the solubility of a number of minerals, resulting in precipitation 共Yabusaki et al. 2001兲. Numerous laboratory and modeling studies of the hydraulic and geochemical performances of Fe0 PRBs have verified the potential impacts of mineral precipitation, which potentially can passivate Fe0 and reduce the porosity inside PRBs, thereby adversely influencing barrier’s long-term performance 共Odziemkowski et al. 1998; Mackenzie et al. 1999; Benner et al. 2001兲. In addition, climatic variation of groundwater characteristics, such as the high dissolved oxygen 共DO兲 content in groundwater during rainy season and the low groundwater temperature in winter, causes fluctuation in barrier’s performance. This is because oxygen in groundwater can compete with CAHs for the
JOURNAL OF ENVIRONMENTAL ENGINEERING © ASCE / FEBRUARY 2006 / 199
Downloaded 08 May 2009 to 128.227.146.124. Redistribution subject to ASCE license or copyright; see http://pubs.asce.org/copyright
released electron 共Helland et al. 1995兲 and also dechlorination reactions by Fe0 are controlled primarily by chemical reactionlimited kinetics 共Su and Puls 1999兲. Recently, beneficial contribution from CAH adsorption by Fe0 has been reported 共Burris et al. 1995兲 and positive influence of microorganisms on the efficiency of Fe0 PRBs for CAH dechlorination has also been proposed 共Gu et al. 2002兲. Since the groundwater chemistry 共e.g., pH, redox potential, alkalinity, major cations, and anions兲 is a critical factor determining the influence of mineral precipitation, microbial activity and Fe0 adsorption on barrier’s performance, variations in groundwater chemistry from site to site may consequently give rise to variations in the long-term performance of a standard implementation of a PRB. Therefore, understanding the impact of the local groundwater chemistry on the performance of PRBs not only provides an opportunity to assess the feasibility of this novel technology but it also allows us to adapt the engineering design to site-specific conditions. Comprehensive monitoring of the behavior of a funnel-andgate Fe0 PRB installed at the Vapokon site in Denmark was conducted on six occasions between March 2000 and August 2003. The objectives of this field study were to 共1兲 examine the variation of the performance of the Fe0 PRB in dechlorinating CAHs from the calcium-rich groundwater over the past 4 years; 共2兲 investigate the geochemical variations in the Vapokon groundwater along the Fe0 PRB; and 共3兲 identify the contribution of Fe0 adsorption and microbial degradation on CAH removal.
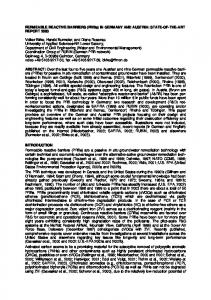
from the hotspot and a funnel-and-gate Fe0 PRB was then constructed to remediate the CAH contaminated groundwater. As illustrated in Fig. 1, the funnel-and-gate Fe0 PRB, which was installed at the Vapokon site in September 1999, was composed of two 110– 130 m long sheet pilings 共the funnel兲 and a reactive gate containing 270 tons of Fe0 共ETI-CC-1004, Connelly-GPM Inc.兲. The Fe0 packed in the PRB had a particle density of 6.43 g / mL and a specific surface area of 1.80 m2 / g. In addition, over 94% by weight of the Fe0 fell in the range of particle diameter 0.30– 1.18 mm. For the sake of spreading the contaminated groundwater uniformly across the reactive zone, gravel packs with 1 m in thickness were placed just upgradient and downgradient of the reactive barrier. The reactive gate, 14.5 m wide, 9.0 m deep, and 0.8 m thick, possessed an average hydraulic conductivity of 20.28 m / d 共Birkelund and Harrekilde 2003兲, a porosity of 0.60 as well as a Fe0 surface area to solution volume ratio 共SA兲 of 7.79 m2 / mL. There was also an upgradient groundwater drainage system surrounding the opening of the funnel-and-gate Fe0 PRB to prevent any uncontaminated groundwater from flowing into the capture zone of the funnel-and-gate system 共see Fig. 1兲, thereby consequently increasing the residence time inside the reactive zone. Results from the natural gradient tracer study of the PRB at the Vapokon site 共Lai et al. 2004兲 showed that the groundwater flow velocity was about 99.5 m / year within the barrier, which was equivalent to the hydraulic retention time or contact time of about 70.4 h in the iron part of the barrier.
Site Description and History
Methods and Materials
The Vapokon site is located in the northern part of Fuen Island in Denmark. Its geological features are a layer of loam and soil filings extending approximately 1.5 m below the ground surface, which is about 22.22 m above sea level 共masl兲. Just below the vadose zone, there is a water-saturated sandy aquifer approximately 9 m in depth underlain by a relatively impermeable clay layer with a minimum thickness of about 15 m 共Lo et al. 2003a,b兲. The groundwater flows in a southeastern direction at a seepage velocity of 400– 500 m / year toward a creek and rain water pond nearby 共Lai et al. 2004兲. Vapokon groundwater is classified as very hard groundwater since it contains high concentrations of calcium ion 共Ca2+兲. Besides, significant amounts of total alkalinity 共TAL兲 and sulfate ion 共SO2− 4 兲, certain concentrations of chloride 共Cl−兲 and magnesium ions 共Mg2+兲, as well as a trace amount of total dissolved iron 共FeT兲 can also be detected in samples 共Table 1兲. From 1976 to 1997, a solvent recycling factory was located at this site to treat used solvent and paint containing CAHs and aromatic hydrocarbons 共BTEX兲. Because of a spill from an underground concrete tank in which the used solvent was reloaded from drums, there has been heavy soil and groundwater contamination with CAHs and BTEX, resulting in a 80⫻ 200 m contaminant plume 共Lai et al. 2004兲. As shown in Table 2, tetrachloroethylene 共PCE兲, trichloroethylene 共TCE兲, 1,1,1trichloroethane 共1,1,1-TCA兲, cis-dichloroethylene 共cis-DCE兲 and dichloromethane 共DCM兲 were determined to be the major CAHs found in the contaminant plume. These contaminants were accompanied by trace amounts of vinyl chloride 共VC兲, 1,1-dichloroethylene 共1,1-DCE兲, trans-dichloroethylene 共trans-DCE兲, 1,1-dichloroethane 共1,1-DCA兲, 1,2-dichloroethane 共1,2-DCA兲, and chloroform 共TCM兲. To clean up this contaminated site, 4,600 tons of contaminated soils were first removed
Installation of Monitoring Network and Groundwater Sampling Two types of monitoring networks, which are shown in Fig. 1, were installed across the Fe0 PRB, resulting in six sampling fences located 0.0, 0.1, 0.4, 0.6, 0.7, and 1.1– 5.8 m from the upgradient edge of the PRB. The 15 monitoring wells constructed at the time of the PRB installation totally possessed 45 piezometers each ended by 1 m long screen. The 3 piezometers in each well generally screened at depths of 12.52–14.22, 15.62–16.47, and 18.02– 19.12 masl. In addition, 20 nylon and 6 copper multilevel samplers with 310 screens distributing at approximately 13.78– 20.28 masl were also installed in the central part of the PRB using the Geoprobe technique in September 2002 共Lai et al. 2004兲. Groundwater samplings were conducted in March 2000, September 2000, September 2001, September 2002, January 2003, and August 2003 in order to obtain long-term monitoring data. A 12 V DC pump 共In-Line 991, Whale兲 connected to a 10 m long nylon tube was used for sampling from the monitoring wells, whereas a sampling manifold with a vacuum pump was used for the simultaneous sampling of six sampling points of the multilevel sampling wells. Prior to storage in 10 mL glass volumetric flasks without headspace, 5 – 15 L and 50 mL of groundwater were first removed from both the monitoring wells and multilevel samplers, respectively, to remove stagnant water. Groundwater Sample Analyses For the measurements of the less volatile CAHs such as PCE, TCE, 1,1,1-TCA, TCM, 1,1-DCA, 1,2-DCA, and DCM, the method of liquid–liquid extraction using pentane 共Pestiscan, LAB-
200 / JOURNAL OF ENVIRONMENTAL ENGINEERING © ASCE / FEBRUARY 2006
Downloaded 08 May 2009 to 128.227.146.124. Redistribution subject to ASCE license or copyright; see http://pubs.asce.org/copyright
Table 1. Variations of the Inorganic and Physical Characteristics of the Vapokon Groundwater along the Permeable Reactive Barrier 共PRB兲 Parameters/date
March 2000
Inorganic parameters Calcium, Ca2+ 共as CaCO3兲 Magnesium, Mg2+ 共as CaCO3兲
Total alkalinity, TAL 共as CaCO3兲
Total dissolved iron, FeT
Sulfate, SO2− 4
Chloride, Cl−
Physical parameters pH
Specific conductance 共s / cm兲 Redox potential 共mV兲
September 2000
September 2001
September 2002
January 2003
na
338 共157兲
299 共152兲
136 共112兲 54 共36兲
96 共86兲 48 共39兲
na
na
na
na
na
248 共90兲
U
510 共145兲
646 共747兲
M D
160 共147兲 146 共161兲
133 共129兲 81 共44兲
U
64.9 共14.0兲
52.1 共7.3兲
M D
37.2 共36.8兲 21.4 共25.9兲
41.2 共18.5兲 27.7 共22.6兲
U
372 共93兲
323 共81兲
M D
78 共120兲 19 共12兲
99 共99兲 31 共12兲
U
13.2 共10.3兲
13.2 共10.4兲
M D
8.1 共15.3兲 0.4 共0.5兲
9.8 共16.3兲 0.6 共0.7兲
125 共101兲 35 共17兲 na
U
189 共125兲
145 共71兲
M D
73 共67兲 108 共145兲
48 共30兲 40 共43兲
U
50.3 共12.0兲
43.6 共11.1兲
M D
43.1 共14.6兲 42.0 共13.5兲
55.4 共21.8兲 47.8 共7.0兲
U
7.03 共0.23兲
7.38 共0.22兲
7.33 共0.23兲
M D
8.98 共1.11兲 9.50 共0.39兲
9.69 共1.24兲 10.56 共0.65兲
9.53 共1.17兲 10.62 共0.86兲
U
1153 共304兲
644 共155兲
679 共132兲
M D
463 共351兲 432 共316兲
330 共163兲 238 共54兲
378 共206兲 230 共25兲
U
na
na
na
na
0.18 共0.39兲
0.15 共0.27兲
0.25 共0.33兲 0.13 共0.13兲
0.13 共0.08兲 0.38 共0.36兲
27.2 共13.8兲
na
3.7 共3.6兲 2.2 共1.6兲 na
46.1 共23.9兲
43.9 共23.4兲
65.2 共37.3兲 38.0 共22.9兲
38.9 共15.0兲 33.9 共11.9兲
na
7.16 共0.18兲 9.44 共0.85兲 10.21 共0.96兲
na
309 共183兲 229 共102兲 na
U
na
na
na
M D Temperature 共°C兲
U
105 共25兲 −115 共90兲 −150 共88兲
M D Dissolved oxygen 共mg/L兲
646 共82兲
na
na
na
6.25 共1.59兲
0.53 共0.09兲
na na
0.84 共1.30兲 0.40 共0.13兲
13.08 共0.88兲
9.55 共0.06兲
M 13.75 共0.60兲 8.93 共0.47兲 D 14.30 共0.44兲 8.70 共0.26兲 Note: The units of the inorganic parameters are in milligrams per liter 共mg/L兲. na⫽not available. The values shown in the box from the top to bottom represent the average value of the parameters collected from the upgradient location 共U兲, middle 共M兲, and downgradient part 共D兲 of the Fe0 PRB, respectively. The bold values represent the original characteristics of the groundwater. The values shown in parentheses indicate the corresponding standard deviation of the data.
SCAN兲 as a solvent and trichlorofluoromethane 共LB05780, SUPELCO兲 as an internal standard was applied in which water to pentane ratio is 3 to 3 mL 共Clesceri et al. 1998兲. After rotating at 60 rpm for 30 min, a 1 L aliquot of equilibrated pentane was injected into the gas chromatograph 共Model HRGC 5300, Carlo Erba Instruments兲 equipped with a Ni63 electron capture detector 共ECD-400, Carlo Erba Instrument兲 and a capillary column 共DB-5, J & W Scientific兲 for measurement. For the more volatile compounds including cis-DCE, trans-DCE, 1,1-DCE, and VC, 2.5 mL water sample was added into 5 mL glass bottle. After rotating at 60 rpm for 30 min, 500 L gas sample was collected from the headspace of the glass bottle and then injected into gas chromatograph 共HP 5890 Series II, Hewlett Packard兲 equipped
with a HNU photoionization detector and capillary column 共Fused Silica, NSW-PLOT兲 for the analysis 共Clesceri et al. 1998; EnviroMetal Technologies Inc. 1998兲. Detection of Ca2+, Mg2+, and FeT was through atomic absorption spectrometry 共Perkin Elmer 5000, Perkin Elmer, Eden Prarie, Minn.兲 and detection of Cl− and SO2− 4 was through ion chromatography 共LC 20 Chromatography, Dionex兲. Additionally, a titration method using 0.02 N sulfuric acid 共UN 1830, General Chemical兲 as a titrant and 0.1% by weight Bromcresol green 共B-0443-100, Exaxol Chemical Corporation兲 as an indicator was used for TAL measurement 共Clesceri et al. 1998兲. The physical characteristics of the Vapokon groundwater collected along the
JOURNAL OF ENVIRONMENTAL ENGINEERING © ASCE / FEBRUARY 2006 / 201
Downloaded 08 May 2009 to 128.227.146.124. Redistribution subject to ASCE license or copyright; see http://pubs.asce.org/copyright
Table 2. Maximum Concentrations of Chlorinated Aliphatic Hydrocarbons 共CAHs兲 in the Contaminant Plume between March 2000 and August 2003 Parameters/date
March 2000
September 2000
Tetrachloroethylene, PCE 12.00 Trichloroethylene, TCE 5.00 cis-Dichloroethylene, cis-DCE 5.50 Vinyl chloride, VC 0.55 1,1-Dichloroethylene, 1,1-DCE 0.04 trans-Dichloroethylene, trans-DCE 0.10 1,1,1-Trichloroethane, 1,1,1-TCA 4.40 1,1-Dichloroethane, 1,1-DCA 0.15 1,2-Dichloroethane, 1,2-DCA 6.10 Chloroform, TCM 0.64 Dichloromethane, DCM 2.90 Note: The units of the CAH concentrations are in milligrams per
September 2001
September 2003
20.00 19.00 34.00 19.00 16.00 20.00 0.10 0.71 0.31 0.32 0.02 0.03 37.00 12.00 0.58 0.52 na 0.07 0.77 0.69 33.00 15.00 liter 共mg/L兲. na represents not available
PRB were measured immediately in the field. By using the 12 V DC pump, the groundwater collected from the monitoring wells was first transferred to a flow cell equipped with pH 共pH 330 SET-1, WTW兲, DO 共OXI 330-SET, WTW兲, conductivity 共LF330SET, WTW兲, and redox potential 共Ag/ AgCl Model 800-323-4340, Cole-Parmer兲 probes. Readings were taken when three successive readings were within 10% / min of variation 共USEPA 1999兲.
January 2003
4.81 4.86 23.66 17.47 29.54 18.13 na na na na nd nd 15.47 15.32 0.70 0.77 nd nd nd nd 1.69 0.94 and nd refers to not detectable.
August 2003 7.30 22.00 38.00 2.40 0.61 0.43 31.00 0.66 0.03 0.26 1.30
shaken at 420 rpm 共SF1, Stuart Scientific兲. With the application of 5 mL glass syringe and 18G stainless steel syringe needles, water samples were extracted from the glass bottles through one of the syringe needle with concomitant substitution of the volume of the extracted solution with ambient air via another syringe needle. Sampling from different glass bottles was conducted at different time intervals and 1,2-DCA and DCM concentrations were measured through the methods mentioned before.
Batch Test In order to substantiate the contribution of Fe0 adsorption to 1,2-DCA and DCM removal, time series batch experiments were conducted under 10° C with Millpore water containing 1,2-DCA and DCM, with concentrations ranging from 5.7 to 6.1 and from 26.6 to 30.5 mg/ L, respectively 共Lai and Lo 2002兲. Two types of Fe0 were used in these batch experiments. One was Fe0 共the same as the Fe0 used in the PRB兲 without any pretreatment 共i.e., fresh Fe0兲, whereas the other was Fe0 heavily coated by calcium and iron carbonates 共i.e., coated Fe0兲, resulting in two sets of glass bottles 共i.e., the control+ fresh Fe0 bottles and control+ coated Fe0 bottles兲. The empty 25 mL glass bottles 共control兲 were filled with the feed solution as were the 25 mL glass bottles containing fresh and coated Fe0. They were then crimp-sealed without headspace using rubber septa 共Burris et al. 1995兲 and then continuously
Data Analysis Gillham and O’Hannesin 共1994兲 determined that the dechlorination reaction is a pseudo first-order reaction with respect to contaminant concentration, with the dechlorination rate constant 共kobs兲 appearing to be directly proportional to SA. Because of sequential dechlorination of major chlorinated organics 共MCOs兲, such as PCE, TCE, 1,1,1-TCA, and TCM into corresponding chlorinated daughter products 共CDPs兲, including cis-DCE, 1,1-DCE, VC, 1,1-DCA, and DCM 共Vogel and McCarty 1987; Helland et al. 1995; Su and Puls 1999兲, three sequential dechlorination models 共Models 1, 2, and 3兲, which take account of concurrent production and dechlorination of CAHs, were used in the
Fig. 1. Plan views of the funnel-and-gate Fe0 PRB and drainage system as well as plan distributions of the monitoring wells, nylon and copper multilevel samplers 共not in scale兲 202 / JOURNAL OF ENVIRONMENTAL ENGINEERING © ASCE / FEBRUARY 2006
Downloaded 08 May 2009 to 128.227.146.124. Redistribution subject to ASCE license or copyright; see http://pubs.asce.org/copyright
computation of kobs. The highest concentration of CAHs measured in each sampling fence was considered to be the most reliable data indicating the change of CAH concentration of the center of the contaminant plume along the PRB and also the most representative of the concentration distribution through the wall 共O’Hannesin and Gillham 1998兲. Therefore, kobs of different CAHs can be determined by fitting the maximum concentration profile of CAHs along the reactive barrier into the analytical solution
C = exp C0
冉冢 冑 vy − vy
1+
4kobsDy v2y
冊
2Dy
Ly
冣
共1兲
of one-dimensional advection–dispersion equation with first-order decay 共van Genuchten 1981; Bedient et al. 1999兲 R
C 2C C = Dy 2 − vy − kobsC t y y
共2兲
However, in this study, an assumption of plug flow approximation within the reactive barrier was made and simple first-order equation was finally applied for kobs determination because of the absence of an equation considering both CAH transport or dispersion and sequential dechlorination of CAHs within the reactive barrier. The first-order equations for Models 1, 2, and 3 are given, respectively, in
d关TCM兴 = − kTCM关TCM兴 dt
They were applied to the maximum CAH concentrations measured in the first five sampling fences 共i.e., located 0.0, 0.1, 0.4, 0.6, and 0.7 m from the upgradient edge of the reactive barrier兲. Since sequential transformations of PCE and TCE into trans-DCE by Fe0 have not been proven 共Su and Puls 1999兲, a first-order equation solely considering dechlorination of trans-DCE was used to determine ktrans-DCE, i.e., d关trans-DCE兴 = − ktrans-DCE关trans-DCE兴 dt
d关PCE兴 = − kPCE关PCE兴 dt
共3兲
d关TCE兴 = f PCE 1kPCE关PCE兴 − kTCE关TCE兴 dt
共4兲
d关cis-DCE兴 = f PCE 2kPCE关PCE兴 + f TCE1kTCE关TCE兴 dt − kcis-DCE关cis-DCE兴
共5兲
d关VC兴 = f cis-DCEkcis-DCE关cis-DCE兴 − kVC关VC兴 dt
共6兲
d关1,1-DCE兴 = f TCE 2kTCE关TCE兴 − k1,1-DCE关1,1-DCE兴 dt
共7兲
共10兲
共11兲
Computation of the dechlorination rates of 1,2-DCA and DCM was not considered because these contaminants have been substantiated to be not treatable by Fe0 共USEPA 1998兲. With the application of the f PCE1共0.983兲, f PCE2共0.017兲, f TCE1共0.014兲, f TCE2共0.003兲, f cis-DCE共0.048兲, and f 1,1,1-TCA共0.441兲 previously determined by EnviroMetal Technologies Inc. 共1998兲, Eqs. 共3兲–共11兲 were used directly in SCIENTIST 共MicroMath 1995兲, which can perform integration and thereby calculate the kobs of different CAHs by fitting the integrated solutions to the relevant experimental data using the least squares fitting method. As mentioned, the kobs was found to be directly proportional to SA. Therefore, the dechlorination rate constant normalized to the ratio of the Fe0 surface area to the solution volume 共kSA兲, which can be obtained from the following equation, is usually reported in the literature for comparison: kSA =
kobs SA
共12兲
Results and Discussion f 1,1,1-TCAk1,1,1-TCA
Model 2
1,1,1-TCA
——→
1,1-DCA
d关1,1,1-TCA兴 = − k1,1,1-TCA关1,1,1-TCA兴 dt
Performance of the Funnel-and-Gate Fe0 PRB on CAH Remediation 共8兲
d关1,1-DCA兴 = f 1,1,1-TCAk1,1,1-TCA关1,1,1-TCA兴 dt − k1,1-DCA关1,1-DCA兴 f TCMkTCM
Model 3
TCM ——→ DCM
共9兲
Over the past 4 years, rapid dechlorination of MCOs and CDPs occurred across the reactive barrier and it was found that approximately 73–87% of the groundwater samples collected from the downgradient part of the Fe0 PRB met the regulatory standards for drinking water 共USEPA 1996; Masters 1998兲. Concerning the drinking water standards of TCE, 1,1-DCE, trans-DCE, 1,1,1-TCA, and TCM, over 90% of the collected groundwater samples met the regulatory requirements. As shown in Fig. 2共a兲, in January 2003, the sum of maximum concentration of MCOs in
JOURNAL OF ENVIRONMENTAL ENGINEERING © ASCE / FEBRUARY 2006 / 203
Downloaded 08 May 2009 to 128.227.146.124. Redistribution subject to ASCE license or copyright; see http://pubs.asce.org/copyright
Fig. 3. Maximum concentrations of 共a兲 PCE, TCE, and cis-DCE, 共b兲 trans-DCE, 1,1-DCE, and VC, 共c兲 1,1,1-TCA, 1,1-DCA, and 1,2-DCA, as well as 共d兲 TCM and DCM along the Fe0 PRB in March 2000. Moreover, the highest concentrations of 共e兲 PCE, TCE, and cis-DCE, 共f兲 trans-DCE, 1,1-DCE, and VC, 共g兲 1,1,1-TCA, 1,1-DCA, and 1,2-DCA, as well as 共h兲 TCM and DCM along the Fe0 PRB in August 2003. The lines represent the best fit of the sequential dechlorination model to the data.
the Vapokon groundwater was about 38 mg/ L in the immediate vicinity of the front edge of the Fe0 PRB. Along the reactive barrier, the MCO concentration dropped to less than 0.6 mg/ L just downgradient of the Fe0 PRB. However, because of the high background concentration and the significant spatial variation in the Cl− concentration in the groundwater, fluctuating between 6.32 and 113 mg/ L 共Table 1兲, a concurrent increase in the Cl− concentration could not be observed. For the sake of understanding the variation of the performance of the Fe0 PRB on CAH dechlorination, the kSA of different CAHs obtained between March 2000 and August 2003 were compared. Figs. 3共a–h兲 show the maximum concentration profiles of different CAHs along the reactive barrier measured in March 2000 and August 2003 as well
as the corresponding fitted curves generated by SCIENTIST 共MicroMath 1995兲. The CAH concentrations measured in the sampling fence located in the downgradient location of the PRB 共i.e., 1.1– 5.8 m downgradient from the front edge of the PRB兲 were omitted from the kSA computation because of the interference from the desorption of CAHs from the native soil, as illustrated in Figs. 2共a–b兲. Table 3 shows the kSA of different CAHs obtained between March 2000 and August 2003. As seen, over the past 4 years, no pronounced deterioration in the iron barrier’s performance on CAH dechlorination was observed even though there was continuous diminution in dissolved ions in the groundwater along the barrier, probably caused by mineral precipitation 共Table 1兲. In-
204 / JOURNAL OF ENVIRONMENTAL ENGINEERING © ASCE / FEBRUARY 2006
Downloaded 08 May 2009 to 128.227.146.124. Redistribution subject to ASCE license or copyright; see http://pubs.asce.org/copyright
Fig. 4. Climatic variation of the kSA of 共a兲 PCE, TCE, 1,1,1-TCA, and TCM and 共b兲 cis-DCE, VC, 1,1-DCE, trans-DCE, and 1,1-DCA
stead, fluctuation of the Fe0 reactivity in CAH dechlorination was examined, particularly for PCE, TCE, and 1,1,1-TCA because their kSA obtained in September 2000, September 2001, and August 2003 were approximately three- to four-fold higher than those obtained in March 2000, September 2002, and January 2003. The kSA of cis-DCE and trans-DCE, on the contrary, were fairly stable over the past 4 years with standard deviations of about 0.0005 and 0.0029 mL m−2 h−1, respectively. Despite the fact that low Fe0 reactivity on PCE, TCE, and 1,1,1-TCA dechlorination was recorded in March 2000, September 2002, and January 2003, the removal efficiency of MCOs across the reactive barrier did not exhibit severe deterioration at those times. On average, between March 2000 and August 2003, about 97.5% of MCOs in the groundwater were removed by the PRB although the removal efficiency was comparatively low in September 2002 共91.6%兲 and January 2003 共96.5%兲. The insignificance of the influence of the low Fe0 reactivity on MCO removal is most likely due to most of MCOs being dechlorinated into nondetectable levels in the first half of the reactive barrier 关Figs. 3共a, c, e, and g兲兴. Therefore, even though there was deterioration in the PCE, TCE, and 1,1,1-TCA dechlorination rates in March 2000, September 2002, and January 2003, the downgradient part of the reactive barrier still provided enough residence time for the effective removal of MCOs, thereby maintaining high efficiency in MCO removal throughout the whole study period. In March 2000, September 2000, September 2001, and August 2003, approximately 92.4% of CDPs in groundwater was dechlorinated into harmless products across the PRB. Because of the sequential dechlorination from the corresponding MCOs, there were intermediate increases in CDP concentrations in the upgradient part of the PRB prior to the significant drop in the concentrations in the downgradient part of the reactive barrier 共see Fig. 3兲. In September 2002 and January 2003, however, poor performance of the Fe0 PRB on CDP dechlorination was observed. As shown in Fig. 2共b兲, in January 2003, the peak concentration of the CDPs within the PRB was examined appearing at the end of the PRB rather than the upgradient part of the reactive barrier. Similar phenomenon could also be observed in September 2002. As you can see from Table 2, cis-DCE was the dominant CDP in the contaminant plume and its rate of dechlorination between March 2000 and August 2003 was quite stable without a noticeable decrease in kSA in September 2002 and January 2003 共Table 3兲. Therefore, the appearing of the peak concentration of CDPs or cis-DCE at the end of the PRB in September 2002 and January 2003 was not due to the low Fe0 reactivity in cis-DCE dechlorination. In fact, the low rate of dechlorination of PCE and TCE in September 2002 and January 2003 are believed to be one of the underlying reasons for the poor performance of the PRB on CDP removal since PCE and TCE could dechlorinate into cis-DCE
within the Fe0 PRB 共EnviroMetal Technologies Inc. 1998兲. The reduction of PCE and TCE kSA in September 2002 and January 2003 consequently shifted the peak concentration of cis-DCE from the upgradient part to the end of the reactive barrier, resulting in an increase in the cis-DCE concentration across the PRB. The low Fe0 reactivity of PCE and TCE dechlorination in March 2000 did not adversely influence the removal efficiency of CDPs at that time in which about 92.8% of CDPs were removed from the Vapokon groundwater across the barrier. The insignificance of the influence from the low kSA of PCE and TCE on the CDP removal is believed to pertain to the low CAH concentrations in the Vapokon groundwater in March 2000 共Table 2兲. As described, 4,600 tons of heavy contaminated soil were first excavated from the hotspot prior to the installation of the Fe0 PRB in September 1999. Most likely owing to the removal of the main source of contamination and the slow rate of desorption of CAHs from the remaining contaminated soil, the CAH concentration in the Vapokon groundwater was relatively low in March 2000 compared with those between September 2000 and August 2003. Low PCE and TCE concentrations in the groundwater consequently led to minor production of cis-DCE within the reactive barrier, thereby indicating an insignificant contribution from PCE and TCE dechlorination to the peak concentration of cis-DCE within the PRB. As a consequence, no significant detrimental effect on the CDP removal was exerted from the low dechlorination rate of PCE and TCE in March 2000. Climatic Variation of the Performance of the Fe0 PRB Careful examination of Table 3 indicates that, except for September 2002, the kSA of different CAHs obtained in the cold season 共i.e., January 2003 and March 2000兲 were usually smaller than those measured in the hot season 共i.e., August 2003, September 2000, and September 2001兲. As you can see from Figs. 4共a and b兲, excluding the kSA obtained in September 2002, the kSA generally increased in the following order: January, March, August, and September, thereby indicating climatic variation in the barrier’s performance on CAH dechlorination. According to Table 1, the groundwater temperature in cold season 共i.e., January 2003兲 was observed approximately 3.5– 5.6° C lower than that in hot season 共i.e., September 2002兲. Probably owing to the low temperature in the groundwater in the cold season, the Fe0 reactivity in CAH dechlorination was comparatively low in January 2003 and March 2000, since the dechlorination reactions of CAHs by Fe0 have been substantiated primarily to be reaction-limited kinetics 共Su
JOURNAL OF ENVIRONMENTAL ENGINEERING © ASCE / FEBRUARY 2006 / 205
Downloaded 08 May 2009 to 128.227.146.124. Redistribution subject to ASCE license or copyright; see http://pubs.asce.org/copyright
Table 3. Variations of the Normalized Dechlorination Rate Constant 共kSA ⫻ 10−2兲 of Different CAHs between March 2000 and August 2003 Parameters/date
March 2000
September 2000
September 2001
September 2002
January 2003
August 2003
3.90 7.59 10.00 1.34 1.39 5.04 kSA 1.000 0.987 0.989 0.955 0.993 1.000 R2 3.64 8.01 10.09 2.36 1.33 4.36 TCE kSA 0.999 0.984 0.940 0.992 0.998 1.000 R2 0.18 0.17 0.21 0.17 0.14 0.28 cis-DCE kSA 0.930 0.861 0.569 0.835 0.851 0.632 R2 0.95 0.60 0.34 na na 0.64 VC kSA 0.824 0.741 0.766 na na 0.933 R2 0.43 2.28 5.98 na na 1.66 1,1-DCE kSA 0.850 0.965 0.915 na na 0.975 R2 5.38 nc 5.11 nc nc 4.80 trans-DCE kSA 0.999 nc 0.760 nc nc 0.998 R2 1.67 6.89 6.30 2.14 1.12 7.43 1,1,1-TCA kSA 1.000 0.996 0.987 0.694 0.998 0.999 R2 0.85 2.62 nc nc 0.19 3.36 1,1-DCA kSA 0.975 0.951 nc nc 0.524 0.786 R2 0.91 2.55 4.67 nc nc 1.71 TCM kSA 0.993 0.944 0.645 nc nc 0.899 R2 Note: na represents not available and nc refers to not calculable. The unit of kSA is milliliter per square meter per hour 共mL m−2 h−1兲. R2 means coefficient of determination. The kSA for every CAH was calculated from their maximum concentration profiles along the Fe0 PRB. PCE
and Puls 1999兲. The low temperature in groundwater might consequently lower the rate of oxidation of Fe0 or the release of the electrons from Fe0 and thereby adversely affected the rate of dechlorination reactions in the cold season. The abnormally low rate of dechlorination of CAHs in September 2002, however, is most likely attributed to the high DO content in the groundwater at that time. During the day of groundwater sampling in September 2002, because of recharge from rainfall, the DO content in the groundwater, on average, was about 6.25 mg/ L 共4.50– 9.90 mg/ L兲, which was much higher than the usual DO content measured in the Vapokon groundwater 共i.e., about 0.40– 0.70 mg/ L兲. The DO in the groundwater did not just compete with CAHs for the electrons released from Fe0; it reduced the availability of the reactive site on the Fe0 surface for the dechlorination reaction and inhibited the binding rate between the Fe0 surface and CAHs, thereby slowing the dechlorination kinetics in September 2002 共Helland et al. 1995兲.
Geochemical Variation in the Vapokon Groundwater along the PRB The OH− and electrons emanating from the oxidation of Fe0 caused an increase of 2.5– 3.3 pH units and nearly 300 mV decrease in the redox potential across the reactive barrier. The pH between 9.50 and 10.62 as well as about −150 mV of redox potential within the PRB encouraged the transformation of oxygen and hydrogen in the groundwater into lower oxidation states, reduced the solubility of minerals and enhanced the surface complexation of cations on iron oxide 共Yabusaki et al. 2001兲. In addition, biologically mediated reduction of SO2− 4 into sulfide probably by sulfate-reducing bacteria led obvious drop in SO2− 4 concentration across the barrier 共Gu et al. 2002兲. As a consequence, across the reactive barrier, on average, there were approximately 81.7% decrease in Ca2+, 57.0% reduction in Mg2+, 90.3% diminution in TAL, as well as 69.2% drop in SO2− 4 , result-
ing in 64.1% decrease in specific conductance in the groundwater 共Table 1兲. There was also a small decrease in or insignificant change of the FeT concentration along the Fe0 PRB despite ferrous and ferric irons being released from the oxidation of Fe0. Because carbonate ion 共CO2− 3 兲 is predominant in the carbonate system at pH 9.50–10.62 共Freeze and Cherry 1979兲, these decreases in concentration along the barrier indicate a high likelihood of the formation of carbonate precipitates including calcite 共CaCO3兲, carbonate-containing green rust 3+ 2+ 2− 兵关Fe2+ 4 Fe2 共OH兲12兴 关CO3 · 2H2O兴 其, dolomite 关CaMg共CO3兲2兴, magnesite 共MgCO3兲 and siderite 共FeCO3兲 共Mackenzie et al. 1999; USEPA 1999; Bonin et al. 2000兲. The relatively low quantity of Mg2+ removed from the groundwater, which was in a range of 24.4– 43.5 mg/ L as CaCO3, across the reactive barrier compared with the quantities of Ca2+ 共366 mg/ L as CaCO3兲 and TAL 共286 mg/ L as CaCO3兲 removed indicates an insignificant precipitation of dolomite and magnesite on the Fe0 surface. Formation of oxyhydroxide or oxide precipitates such as goethite 共␣-FeOOH兲, and magnetite 共Fe3O4兲 were also expected with high pH and low redox potential conditions 共Bonin et al. 1998; Farrell et al. 2000兲. 2− As Ca2+, CO2− 3 , and SO4 were the major dissolved ions precipitated from the Fe0 PRB 共Table 1兲, it is believed that calcite and mackinawite 共FeS兲 were the precipitates most likely formed inside the PRB 共USEPA 2003兲. Except for carbonate-containing green rust and magnetite, all the mineral precipitates possibly formed on the surface of Fe0 have the ability to passivate Fe0, thereby preventing Fe0 corrosion as well as the generation of Fe2+ and hydrogen gas 共USEPA 1998; Ritter et al. 2002兲. Since dechlorination of CAHs through hydrogenolysis and reductive--elimination pathways involves a direct transfer of electrons from the Fe0 surface to the contaminants as well as an indirect electron transfer from Fe2+ or via catalytic hydrogenolysis by hydrogen gas, the formation of passive precipitates on the Fe0 surface can potentially prevent both direct and indirect transfers of electrons and thereby adversely affect the Fe0 reactivity on CAH dechlorination. However, the lack of deterio-
206 / JOURNAL OF ENVIRONMENTAL ENGINEERING © ASCE / FEBRUARY 2006
Downloaded 08 May 2009 to 128.227.146.124. Redistribution subject to ASCE license or copyright; see http://pubs.asce.org/copyright
Fig. 5. Adsorption of 1,2-DCA and DCM by 共a兲 fresh Fe0 共䊊兲 and 共b兲 coated Fe0 共䉭兲
ration in the rate of CAH dechlorination by the Fe0 over the past 4 years indicates the insignificance of the passivated effect from the mineral precipitation, probably due to the precipitation of minerals on the nonreactive site of Fe0 surface rather than the reactive site for the CAH dechlorination 共Deng et al. 2003兲. Instead, given the results from the natural gradient tracer experiment 共Lai et al. 2004兲, the potential influence of mineral precipitation on the hydraulic performance of the PRB 共e.g., the flow pattern of the groundwater, the hydraulic conductivity and the groundwater flow velocity兲 was rather more significant than that on CAH dechlorination. By assuming that calcite and mackinawite were the only precipitates formed inside the barrier as well as by selecting the Fe0 corrosion rate to be 0.4 mmol/ kg d 共Reardon 1995兲, it was figured that mineral precipitation caused 2.14 m3 loss of void volume throughout the whole reactive barrier between March 2000 and August 2003, which corresponded to 3.46% total loss of porosity or 0.88% loss per year. However, the practical rate of percentage loss of porosity in the Fe0 PRB should be higher than 0.88% per year, because most dissolved ions were precipitated out of the first half of the barrier. Based upon the information listed in Table 1, about 84.7% decrease in Ca2+, 54.2% drop of Mg2+, 72.6% diminution in TAL, and 93.2% reduction in SO2− 4 were observed in the first half of the PRB, thereby consequently causing 6.60% total porosity loss or 1.68% loss per year in the front part of the barrier.
Microbial Degradation and Fe0 Adsorption of Chlorinated Aliphatic Hydrocarbons Despite the fact that 1,2-DCA and DCM were proven to be not treatable by Fe0 共USEPA 1998兲, obvious removal of these contaminants from the Vapokon groundwater occurred during the past 4 years. As shown in Figs. 3共c and d兲, the concentration of
1,2-DCA dropped from 6.10 to 0.04 mg/ L across the PRB in March 2000 whereas the concentration of DCM dropped from 14.00 to 0.01 mg/ L within the reactive barrier. More obvious decrease in DCM concentration could also be observed in September 2000 and September 2001 in which across the Fe0 PRB, the concentration in groundwater reduced from 33.00 and 15.00 mg/ L to approximately 0.46 and 0.81 mg/ L, respectively. Microbial degradation or adsorption by Fe0, or both are believed to be the cause of the removal of 1,2-DCA and DCM 共Burris et al. 1995; Mägli et al. 1998; Deng et al. 2003兲. In fact, Bouwer and McCarty 共1983兲 reported the possibility of transformation of 1,2-DCA under methanogenic condition. Moreover, biodegradation of DCM has also been mentioned by Freedman and Gossett 共1991兲 and Kohler-Staub et al. 共1995兲. Unfortunately, the contribution of microbial degradation cannot be verified at the moment since further iron core sampling followed by phospholipid fatty acids and DNA analyses of the microorganisms growing on the core sample are required 共Gu et al. 2002兲. However, the adsorption of 1,2-DCA and DCM by Fe0 were directly substantiated through the time series batch experiments using fresh and coated Fe0. Figs. 5共a and b兲 illustrate the results of the batch experiments. There were significant drops in the concentrations of 1,2-DCA and DCM in both batch experiments containing fresh and coated Fe0. Since the concentrations in the corresponding control experiments were relatively steady, the significant decrease in 1,2-DCA and DCM concentrations conclusively indicate adsorption by Fe0. The equilibrium times for 1,2-DCA and DCM adsorption by fresh Fe0 were nearly 40 h, whereas it took about 25– 30 h for them to reach equilibrium with the coated Fe0. Although precipitation of calcium and iron carbonates on the Fe0 surface shortened the equilibrium time for the adsorption, it could adversely affect the amount of adsorbates to be sorbed by the Fe0. Each kilogram of fresh Fe0 adsorbed approximately 2.18 mg of 1,2-DCA and
JOURNAL OF ENVIRONMENTAL ENGINEERING © ASCE / FEBRUARY 2006 / 207
Downloaded 08 May 2009 to 128.227.146.124. Redistribution subject to ASCE license or copyright; see http://pubs.asce.org/copyright
3.49 mg of DCM, whereas only 1.69 mg of 1,2-DCA and 3.32 mg of DCM was adsorbed per kilogram of coated Fe0.
tween Technical University of Denmark and the Hong Kong University of Science and Technology as well as the Danish Environmental Protection Agency for their cooperation.
Conclusions Notation Results from the 4-year monitoring of the performance of the funnel-and-gate Fe0 PRB installed at the Vapokon site, Denmark indicated effective removal of CAHs from the groundwater. Over the past 4 years, approximately 97.5% of MCOs were removed from the groundwater across the PRB and approximately 92.4% of CDPs were removed except in September 2002 and January 2003. Moreover, on average, about 73–87% of groundwater samples collected from the downgradient part of the reactive barrier met the environmental standards for drinking water. Even though there was continuous diminution in dissolved ions in the groundwater along the barrier, probably caused by mineral precipitation, no evident deterioration of the iron barrier’s performance was observed, thereby indicating the insignificance of the passivated effects exerted from mineral precipitation. Instead, over the past 4 years, climatic variation in the performance of the PRB on CAH dechlorination was indicated. In general, most likely owing to the low groundwater temperature in the cold season, the kSA of CAHs in January 2003 and March 2000 were smaller than those in August 2003, September 2000, and September 2001 共i.e., the hot season兲 especially for PCE, TCE, and 1,1,1-TCA. The unusually low rate of dechlorination in September 2002 was probably due to the high DO content in the groundwater caused by recharge from rainfall since the oxygen competed with CAHs for the electrons released from Fe0. The high pH and low redox potential conditions within the reactive barrier as well as the possible presence of sulfatereducing bacteria consequently led to significant decreases in Ca2+, Mg2+, TAL, and SO2− 4 in the groundwater across the PRB. Among various mineral precipitates possibly formed on the Fe0 surface, calcite, and mackinawite are expected to be the precipitates most likely formed within the PRB since Ca2+, TAL, and were the major dissolved ions being precipitated out, SO2− 4 thereby theoretically resulting in 3.46% total loss of porosity or 0.88% loss per year. Based upon the monitoring results over the past 4 years, it is expected that there will be still no significant loss of the reactivity of the Fe0 PRB in CAH dechlorination in the next 5 – 10 years. However, the continuous loss of porosity due to the mineral precipitation will be problematic, which will significantly deteriorate the hydraulic performance of the reactive barrier and may consequently limit the barrier’s longevity to only about 10 years. 1,2-DCA and DCM, which are not treatable by Fe0, were found to be removed from the groundwater across the PRB, thereby indicating the enhancement of the barrier’s performance from microbial degradation or Fe0 adsorption. According to the results from the times series batch experiments, adsorption of 1,2-DCA and DCM by Fe0 was conclusively substantiated in which 2.18 mg of 1,2-DCA and 3.49 mg of DCM as well as 1.69 mg of 1,2-DCA and 3.32 mg of DCM could be adsorbed per kilogram of fresh and coated Fe0, respectively.
Acknowledgments The writers wish to thank Research Grants Council 共RGC兲 for granting a RGC Competitive Earmarked Research Grant 共Project No. HKUST 6086/00E兲 to support the research collaboration be-
The following symbols are used in this paper: C ⫽ CAH concentration at a longitudinal distance Ly 共mg L−1兲; C0 ⫽ initial CAH concentration 共mg L−1兲; 关cis-DCE兴 ⫽ cis-DCE concentration along the Fe0 PRB 共mg L−1兲; Dy ⫽ longitudinal dispersion coefficient 共m2 h−1兲; f cis-DCE ⫽ molar fraction of cis-DCE converting into VC; f PCE1 ⫽ molar fraction of PCE converting into TCE; f PCE2 ⫽ molar fraction of PCE converting into cis-DCE; f TCE1 ⫽ molar fraction of TCE converting into cis-DCE; f TCE2 ⫽ molar fraction of TCE converting into 1,1-DCE; f TCM ⫽ molar fraction of TCM converting into DCM; f 1,1,1-TCA ⫽ molar fraction of 1,1,1-TCA converting into 1,1-DCA; kcis-DCE ⫽ cis-DCE kobs 共h−1兲; kobs ⫽ observed first-order dechlorination rate constant 共h−1兲; kPCE ⫽ PCE kobs 共h−1兲; kSA ⫽ dechlorination rate constant normalized to the ratio of Fe0 surface; area to solution volume 共mL m−2 h−1兲; kTCE ⫽ TCE kobs 共h−1兲; kTCM ⫽ TCM kobs 共h−1兲; ktrans-DCE ⫽ trans-DCE kobs 共h−1兲; kVC ⫽ VC kobs 共h−1兲; k1,1-DCA ⫽ 1,1-DCA kobs 共h−1兲; k1,1-DCE ⫽ 1,1-DCE kobs 共h−1兲; k1,1,1-TCA ⫽ 1,1,1-TCA kobs 共h−1兲; Ly ⫽ longitudinal distance of transport along the Fe0 PRB 共m兲; 关PCE兴 ⫽ PCE concentration along the Fe0 PRB 共mg L−1兲; R ⫽ retardation factor; 关TCE兴 ⫽ TCE concentration along the Fe0 PRB 共mg L−1兲; 关TCM兴 ⫽ TCM concentration along the Fe0 PRB 共mg L−1兲; 关trans-DCE兴 ⫽ trans-DCE concentration along the Fe0 PRB 共mg L−1兲; t ⫽ time 共h兲; 关VC兴 ⫽ VC concentration along the Fe0 PRB 共mg L−1兲; vy ⫽ groundwater velocity in longitudinal direction 共m h−1兲; y ⫽ longitudinal distance 共m兲; 关1,1-DCA兴 ⫽ 1,1-DCA concentration along the Fe0 PRB 共mg L−1兲; 关1,1-DCE兴 ⫽ 1,1-DCE concentration along the Fe0 PRB 共mg L−1兲; 关1,1,1-TCA兴 ⫽ 1,1,1-TCA concentration along the Fe0 PRB 共mg L−1兲; and
208 / JOURNAL OF ENVIRONMENTAL ENGINEERING © ASCE / FEBRUARY 2006
Downloaded 08 May 2009 to 128.227.146.124. Redistribution subject to ASCE license or copyright; see http://pubs.asce.org/copyright
SA ⫽ ratio of Fe0 surface area to solution volume 共m2 mL−1兲.
References Arnold, W. A., and Roberts, A. L. 共2000兲. “Pathways and kinetics of chlorinated ethylene and chlorinated acetylene reaction with Fe共0兲 particles.” Environ. Sci. Technol., 34共9兲, 1794–1805. Bedient, P. B., Rifai, H. S., and Newell, C. J. 共1999兲. Ground water contamination transport and remediation, 2nd Ed., Prentice-Hall PTR, Upper Saddle River, N.J. Benner, S. G., Blowes, D. W., and Molson, J. W. H. 共2001兲. “Modeling preferential flow in reactive barriers: Implications for performance and design.” Ground Water, 39共3兲, 371–379. Birkelund, V. L., and Harrekilde, D. 共2003兲. Afprøvning of reaktiv jernvœg til grundvandsrensning—Vapokongrunden. (Test of reactive iron barrier for groundwater treatment—The Vapokon site, in Danish), Miljøprojekt 743, Teknologiudviklingsprogrammet for Jord og Grundvandsforurening, Miljøstyrelsen, Copenhagen, Denmark 共in Danish兲. Bonin, P. M. L., Odziemkowski, M. S., and Gillham, R. W. 共1998兲. “In situ identification of carbonate-containing green-rust on iron electrodes in solution simulating groundwater.” Corros. Sci., 40共8兲, 1391–1409. Bonin, P. M. L., Odziemkowski, M. S., Reardon, E. J., and Gillham, R. W. 共2000兲. “In situ identification of carbonate-containing green rust on iron electrodes in solutions simulating groundwater.” J. Solution Chem., 29共10兲, 1061–1074. Bouwer, E. J., and McCarty, P. L. 共1983兲. “Transformation of 1- and 2-carbon halogenated aliphatic organic compounds under methanogenic conditions.” Appl. Environ. Microbiol., 45共4兲, 1286–1294. Burris, D. R., Campbell, T. J., and Manoranjan, V. S. 共1995兲. “Sorption of trichloroethylene and tetrachloroethylene in a batch reactive metallic iron-water system.” Environ. Sci. Technol., 29共11兲, 2850–2855. Clesceri, L. S., Greenberg, A. E., and Eaton, A. D. 共1998兲. Standard methods for the examination of water and wastewater, 20th Ed., APHA, AWWA, and WEF. Deng, B., Hu, S., Whitworth, T. M., and Lee, R. 共2003兲. “Trichloroethylene reduction on zerovalent iron: Probing reactive versus nonreactive sites.” Innovative strategies for the remediation of chlorinated solvents and DNAPLs in the subsurfaces, S. Henry, ed., ACS Book Series, American Chemical Society, Washington, D.C., 181–205. EnviroMetal Technologies Inc. 共1998兲. “Bench-scale treatability report of the EnviroMetal process at the Vapokon site, Fyn, Denmark.” Rep. No. ETI 31438.10, Guelph, Ont., Canada. Farrell, J., Kason, M., Melitas, N., and Li, T. 共2000兲. “Investigation of the long-term performance of zero-valent iron for reductive dechlorination of trichloroethylene.” Environ. Sci. Technol., 34共3兲, 514–521. Freedman, D. L., and Gossett, J. M. 共1991兲. “Biodegradation of dichloromethane and its utilization as a growth substrate under methanogenic conditions.” Appl. Environ. Microbiol., 57共10兲, 2847–2857. Freeze, R. A., and Cherry, J. A. 共1979兲. Groundwater, Prentice-Hall, Englewood Cliffs, N.J. Gillham, R. W., and O’Hannesin, S. F. 共1994兲. “Enhanced degradation of halogenated aliphatics by zero-valent iron.” Ground Water, 32共6兲, 958–967. Gu, B., Watson, D. B., Wu, L. Y., Phillips, D. H., White, D. C., and Zhou, J. Z. 共2002兲. “Microbiological characteristics in a zero-valent iron reactive barrier.” Environ. Monit. Assess., 77, 293–309. Hardy, L. I., and Gillham, R. W. 共1996兲. “Formation of hydrocarbons from the reduction of aqueous CO2 by zero-valent iron.” Environ. Sci. Technol., 30共1兲, 57–65. Helland, B. R., Alvarez, P. J. J., and Schnoor, J. L. 共1995兲. “Reductive dechlorination of carbon tetrachloride with elemental iron.” J. Hazard. Mater., 41, 205–216. Kohler-Staub, D., Frank, S., and Leisinger, T. 共1995兲. “Dichloromethane as the sole carbon source for Hyphomicrobium sp. Strain DM2 under
denitrification conditions.” Biodegradation, 6, 229–235. Lai, K. C. K., and Lo, I. M. C. 共2002兲. “Bench-scale study of the effects of seepage velocity on the dechlorination of TCE and PCE by zerovalent iron.” Proc., 6th Int. Symp. on Environmental Geotechnology, Seoul, Korea, 181–186. Lai, K. C. K., Lo, I. M. C., and Kjeldsen, P. 共2004兲. “Investigation of flow pattern of groundwater through a Fe0 PRB.” Proc., 4th Int. Conf. on Remediation of Chlorinated and Recalcitrant Compounds, Monterey, Calif. Lo, I. M. C., Lai, K. C. K., and Kjeldsen, P. 共2003a兲. “Field monitoring of the performance of PRB at Vapokon site in Denmark.” Proc., Remediation Technologies Development Forum Permeable Reactive Barriers (PRBs) Action Team Meeting, Remediation Technologies Development Forum, Niagara Falls, N.Y., 95–112. Lo, I. M. C., Lai, K. C. K., and Kjeldsen, P. 共2003b兲. “Performance of permeable reactive barrier on remedying aliphatic chlorinated organics contaminated groundwater.” Proc., Int. Conf. on Contaminated Soils and Groundwater in Arid Countries, Muscat, Oman. Mackenzie, P. D., Horney, D. P., and Sivavec, T. M. 共1999兲. “Mineral precipitation and porosity losses in granular iron columns.” J. Hazard. Mater., 68, 1–17. Mägli, A., Messmer, M., and Leisinger, T. 共1998兲. “Metabolism of dichloromethane by the strict anaerobe dehalobacterium formicoaceticum.” Appl. Environ. Microbiol., 64共2兲, 646–650. Masters, G. M. 共1998兲. Introduction to environmental engineering and science, 2nd Ed., Prentice-Hall PTR, Upper Saddle River, N.J. Matheson, L. J., and Tratnyek, P. G. 共1994兲. “Reductive dehalogenation of chlorinated methanes by iron metal.” Environ. Sci. Technol., 28共12兲, 2045–2053. MicroMath Scientist. 共1995兲. Experimental data fitting/Microsoft Windows version 2.0, Salt Lake City. Odziemkowski, M. S., Schuhmacher, T. T., Gillham, R. W., and Reardon, E. J. 共1998兲. “Mechanism of oxide film formation on iron in simulating groundwater solutions: Raman spectroscopic studies.” Corros. Sci., 40共2/3兲, 371–389. O’Hannesin, S. F., and Gillham, R. W. 共1998兲. “Long-term performance of an in situ “iron wall” for remediation of VOCs.” Ground Water, 36共1兲, 164–170. Reardon, E. J. 共1995兲. “Anaerobic corrosion of granular iron: Measurement and interpretation of hydrogen evolution rates.” Environ. Sci. Technol., 29共12兲, 2936–2945. Ritter, K., Odziemkowski, M. S., and Gillham, R. W. 共2002兲. “An in situ study of the role of surface films on granular iron in the permeable iron wall technology.” J. Contam. Hydrol., 55, 87–111. Su, C., and Puls, R. W. 共1999兲. “Kinetics of trichloroethene reduction by zerovalent iron and tin: Pretreatment effect, apparent activation energy, and intermediate products.” Environ. Sci. Technol., 33共1兲, 163–168. Travis, C. C., and Doty, C. B. 共1990兲. “Can contaminated aquifers at superfund sites be remediated?” Environ. Sci. Technol., 24共10兲, 1464–1466. United States Environmental Protection Agency 共USEPA兲. 共1996兲. “Drinking water regulations and health advisories.” Rep. No. EPA822-B-002, Office of Water, Washington, D.C. United States Environmental Protection Agency 共USEPA兲. 共1998兲. “Permeable reactive barrier technologies for contaminant remediation.” Rep. No. EPA/600/R-98/125, Office of Research and Development, Washington, D.C. United States Environmental Protection Agency 共USEPA兲. 共1999兲. “An in situ permeable reactive barrier for the treatment of hexavalent chromium and trichloroethylene in ground water: Volume 2 performance monitoring.” Rep. No. EPA/600/R-99/095b, Office of Research and Development, Washington, DC 20460. United States Environmental Protection Agency 共USEPA兲. 共2002兲. “Field applications of in situ remediation technologies: Permeable reactive
JOURNAL OF ENVIRONMENTAL ENGINEERING © ASCE / FEBRUARY 2006 / 209
Downloaded 08 May 2009 to 128.227.146.124. Redistribution subject to ASCE license or copyright; see http://pubs.asce.org/copyright
barriers.” Rep. No. EPA/68/W-00/084, Office of Solid Waste and Emergency Response, Technology Innovation Office, Washington, D.C. United States Environmental Protection Agency 共USEPA兲. 共2003兲. “Capstone report on the application, monitoring, and performance of permeable reactive barriers for ground-water remediation: Volume 1—Performance evaluations at two sites.” Rep. No. EPA/600/R-03/ 045a, National Risk Management Research Laboratory, Office of Research and Development, Cincinnati.
van Genuchten, MTh. 共1981兲. “Analytical solutions for chemical transport with simultaneous adsorption, zero-order production and firstorder decay.” J. Hydrol., 49共3–4兲, 213–233. Vogel, T. M., and McCarty, P. L. 共1987兲. “Abiotic and biotic transformations of 1,1,1-trichloroethane under methanogenic conditions.” Environ. Sci. Technol., 21共12兲, 1208–1213. Yabusaki, S., Cantrell, K., Sass, B., and Steefel, C. 共2001兲. “Multicomponent reactive transport in an in situ zero-valent iron cell.” Environ. Sci. Technol., 35共7兲, 1493–1503.
210 / JOURNAL OF ENVIRONMENTAL ENGINEERING © ASCE / FEBRUARY 2006
Downloaded 08 May 2009 to 128.227.146.124. Redistribution subject to ASCE license or copyright; see http://pubs.asce.org/copyright