... 2004; last revised 25 June 2004; accepted 11 August 2004 ... liquid limit (LL , 50) (CL) soil from Osage county, Kansas, and a CL soil from near Hugoton, ...
Ground Improvement (2005) 9, No. 1, 33–38
33
Field performance of fly ash stabilised subgrades R. L. Parsons and E. Kneebone Department of Civil and Environmental Engineering, University of Kansas, Lawrence, USA Class C fly ash has been used to improve the properties of subgrade soils for several decades. This report contains a summary of the results of a study to quantify the level of improvement provided by Class C fly ash and the degree to which those improvements are effectively permanent. A series of dynamic cone penetrometer values were obtained for 12 streets with fly ash treated subgrades, and for five streets with untreated subgrades. Streets ranged in age from zero to nine years. For subgrades with fly ash the penetration resistance was recorded for the fly ash treated layer and the untreated soil beneath. Higher strengths were recorded for all fly ash treated subgrade layers than for the untreated soil beneath. No deterioration with age was observed for the subgrades evaluated. Laboratory and field testing of soils treated with fly ash also showed that fly ash contributed to soil strength and stiffness while plasticity and swell potential were reduced, although swelling was not eliminated.
Keywords : fly ash; dynamic cone penetrometer; soil improvement; soil stabilisation
Introduction Subgrade soils are an essential component of pavement structures, and inadequate subgrade performance is the cause of many premature pavement failures. Clay subgrades in particular may provide inadequate support, particularly when saturated. Soils with significant plasticity may also shrink and swell substantially with changes in moisture conditions. These changes in volume can cause the pavement to shift or heave with changes in moisture content, and may cause a reduction in the density and strength of the subgrade, accelerating pavement deterioration. There is a substantial history of use of soil stabilisation admixtures to improve poor subgrade soil performance by controlling volume change and increasing strength. Lime and cement have been used successfully for many decades, and more recently Class C fly ash has been used as an economical alternative to improve subgrade performance. The benefits of Class C fly ash may be divided into three categories (adapted from Ferguson, 1993): (a) Drying agent. Fly ash hydrates when exposed to water. As a water consumer, it can be used as a drying agent for wet soils when acceleration of the drying process is desired. (GI 4201) Received 20 February 2004; last revised 25 June 2004; accepted 11 August 2004
La cendre volante de classe C est utilise´e depuis plusieurs de´cennies pour ame´liorer les proprie´te´s des fonds de forme. Ce rapport re´sume les re´sultats d’une e´tude visant a` quantifier le niveau d’ame´lioration apporte´ par la cendre volante de classe C et le degre´ de permanence de ces ame´liorations. Une se´rie de valeurs obtenues par pe´ne´trome`tre a` coˆne dynamique a e´te´ obtenue dans 12 rue posse´dant des fonds de formes traite´s a` la cendre volante et dans cinq rues avec fonds de forme non traite´es. Les rues avaient de ze´ro a` neuf ans. Pour les fonds de forme traite´s a` la cendre volante, la re´sistance a` la pe´ne´tration a e´te´ enregistre´e pour la couche traite´e a` la cendre volante et pour le sol non traite´ en dessous. Pour toutes les couches de fonds de forme traite´es a` la cendre volante, des re´sistances plus e´leve´es ont e´te´ enregistre´es que sur le sol non traite´ en dessous. Aucune de´te´rioration due a` l’aˆge n’a e´te´ observe´e pour les fonds de forme e´value´s. Les essais de terrain et en laboratoire sur sols traite´s a` la cendre volante ont montre´ que la cendre volante contribuait a` la re´sistance et a` la rigidite´ du sol tandis que la plasticite´ et le potentiel de gonflement se trouvait re´duit, bien que le gonflement ne soit pas totalement e´limine´.
(b) Control of volume change. Fly ash reduces shrink/swell behaviour because it does not experience significant volume change itself, so its addition acts to dilute the effects of the swelling clays that are present. It also contains some lime, which acts through ion exchange to reduce the clay particles’ affinity for water (Ferguson and Levorson, 1999). (c) Increase strength. Fly ash acts as a weak cementing agent that increases the strength of the treated soil. Much of this strength gain occurs very quickly; however, for some soil–ash combinations there may be additional strength gains over time owing to pozzolanic reactions as with lime. The immediate strength gain is of particular value because it results in a subgrade that serves as a superior working platform for asphalt paving and compaction equipment. The permanence of these improvements is uncertain. McCallister and Petry (1991) showed in laboratory testing that stabilisation with an inadequate amount of lime could yield improvements in soil behaviour that were non-permanent. Laboratory research by Parsons and Milburn (2003a) showed some evidence that the plasticity of fly ash stabilised soils can also revert to native levels with leaching. However, Ferguson and Zey (1992) found that fly ash stabilised soils performed well in the field after a period of two years. Based on the reported benefits of fly ash stabilisation, Overland Park, Kansas, began stabilisation of selected street 1365-781X # 2005 Thomas Telford Ltd
Parsons and Kneebone
Study objectives This study was conducted with the following objectives in mind: (a) Confirm that introduction of Class C fly ash provides a statistically significant improvement in soil properties as compared with untreated subgrades. (b) Quantify the improvement in subgrade properties achieved through the use of fly ash. (c) Determine whether there is a deterioration of the fly ash treated subgrade over time. A series of tests were conducted in the laboratory and on existing subgrades to evaluate the performance of fly ash stabilised subgrades. Laboratory tests were conducted on three soils and included strength, stiffness, swell, and Atterberg limits. Field testing consisted of strength testing using the dual-mass dynamic cone penetrometer (DCP) developed by the US Army Corps of Engineers (USACE) (USACE, 1999) and stiffness measurements using the soil stiffness gauge.
several researchers (Turner, 1997; Ferguson and Leverson, 1999; Parsons and Milburn, 2003a). Similar results were obtained for the soils evaluated as a part of this research with both laboratory and field testing. The three soils were evaluated with 0%, 12% and 16% fly ash by weight. Samples were mixed with a range of water contents and compacted in accordance with ASTM D 698 (ASTM, 1999b) and tested for strength in accordance with ASTM D 5102 (ASTM, 1998). A delay time of 1 h was included between mixing and compaction of fly ash treated samples to simulate construction practice. Soil samples were extruded and cured for a 28-day period in a moisture room. Strength gains of the order of 100–300% with the addition of fly ash were recorded. Moisture–unit weight and moisture– strength relationships for the Metcalf soil are shown in Figs 1(a) and 1(b).
Atterberg limits and volume change Changes in the plasticity index and one-dimensional swell potential were also evaluated. Addition of fly ash caused 17
Unit Weight: kN/m3
subgrades in 1993, and in 1996 began requiring stabilisation of all new subgrades with liquid limits (LL) above 40 and a plasticity index (PI) above 25. The amount of fly ash required has been between 12% and 16%. At these rates the cost of stabilisation is approximately $3.30–4.20/m2 . The source for most fly ash for the Overland Park area is the LaCygne, Kansas, power plant. Additional ash has been provided by the Iatan and Nearman plants. Table 1 contains chemical analyses for a range of times for the LaCygne plant. Chemical analyses obtained for the other plants were similar.
Native 12% Fl y ash 16% Fl y ash ZAV
16
15
14
13
10
15
20 Moisture content: %
25
30
15
20 Moisture content: %
25
30
Laboratory testing 700 600 UC Strength: kPa
Three soils were selected for laboratory testing with fly ash contents of 12% and 16%. Soils were classified by the American Society for Testing and Materials (ASTM) D 2487 standard (ASTM, 1999). Two of these soils, a clay with a low liquid limit (LL , 50) (CL) soil from Osage county, Kansas, and a CL soil from near Hugoton, Kansas, were previously characterised by Parsons and Milburn (2003a). The third soil was a clay with a high liquid limit (LL > 50) (CH) soil from Overland Park at approximately 149th and Metcalf, which was one of the test locations. The soils were evaluated for strength, Atterberg limits, swell potential, and stiffness.
Native 12% 16%
500 400 300 200 100 0
10
Unit weight and strength Class C fly ash has been shown to improve the strength and modulus of subgrade soils through laboratory testing by
Fig. 1. Moisture–unit weight and moisture-strength relationships for Metcalf soil (ZAV (zero air voids))
Table 1. Composition of LaCygne fly ash SiO2 Al2 O3 Fe2 O3 Sum SO3 CaO AA MgO
Feb–June 1996* 34.09 22.67 5.86 61.67 1.70 26.70 1.38 N/A.
*Misra (1998). AA (available alkaline)
34
Std dev. 2.13 0.98 0.41 1.78 0.20 1.36 0.05 N/A
Jul 2001 37.06 22.48 5.86 65.40 1.09 24.31 1.21 4.53
Aug 2001 36.67 22.63 5.93 65.23 1.10 24.38 1.28 4.68
Sep 2001 37.77 22.34 5.80 65.91 0.98 23.90 1.29 4.46
Mean 37.17 22.48 5.86 65.51 1.06 24.20 1.26 4.56
Std dev. 0.56 0.15 0.07 0.35 0.07 0.26 0.04 0.11
Field performance of fly ash stabilised subgrades 35 30
Native 12% fly ash 16% fly ash
30
25 20
17
PI
16 15
15 12
12
11 9
10
9
5 0 Metcalf (CH)
Hugoton (CL)
Osage (CL)
Soil
Fig. 2. Reduction in the plasticity index (PI) with the addition of fly ash
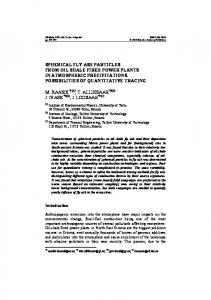
some reduction in the plasticity index (PI), as shown in Fig. 2, although the soils retained some plasticity. Swell potential was evaluated in accordance with the Kansas Department of Transportation (KDOT) method for volume change, which is a one-dimensional swell test on a 102 mm diameter, 51 mm thick sample with a 7.18 kPa surcharge. Fig. 3 shows the swell for each soil at optimum moisture for that native soil. As this figure shows, fly ash significantly reduced the swelling potential for each soil. Note that swell potential will tend to be greater for soils compacted at a moisture content that is below optimum, which is often the case for fly ash stabilised soils. Note also that in both figures the native CH soil (Metcalf) had the highest PI and the greatest swell. Although both the PI and the swell potential were reduced for this soil, the amount of swelling was still significant after the addition of fly ash. These results were consistent with those previously reported by Parsons and Milburn (2003a), who found that although the use of fly ash reduced swelling, CH clays could still swell significantly after the introduction of fly ash.
carried device that repeatedly generates a small dynamic vertical force on the compacted surface. The SSG measures the deflection of a known mass resulting from the application of a known vibrating force, and calculates the stiffness for a series of loading frequencies (Chen et al., 1999). The stiffness gauge has been evaluated as a potential substitute for the nuclear density gauge, with good results (Humboldt, 2000). SSG stiffness values may also be converted to soil modulus by assuming a value for Poisson’s ratio. The SSG modulus has shown a good correlation (R2 ¼ 0.81) with back-calculated resilient modulus using the falling weight deflectometer (Chen et al., 1999) and has also been correlated with results from the resonant column test (Sawangsuriya and Edil, 2002). Samples of the Metcalf soil were prepared with fly ash in accordance with ASTM D 698. Stiffness was monitored over a 28-day period using the soil stiffness gauge. As shown in Fig. 4, the soil stiffness increased by approximately 45% for the fly ash stabilised samples. Stiffness increases were similar for the samples with 12% and 16% fly ash. The final stiffness for the fly ash treated samples of approximately 6.4 MN/m corresponds to a modulus of 55.5 MPa for a Poisson’s ratio of 0.35. The SSG was also used to measure the short-term increase in stiffness of the subgrade for a reconstructed section of Metcalf before and after fly ash treatment. A total of 36 stiffness measurements were taken at 12 sampling locations on a portion of the subgrade that had been stabilised in the previous 48 h. An additional 18 measurements were taken on native soil that had not yet been stabilised. Tests were located 3, 6 and 10 m from the edge of paving. The results are summarised in Table 2. As this table shows, an average increase in stiffness of 93% was measured in the stabilised subgrade. Recorded stiffness values from the field testing were also substantially higher than for the laboratory samples for both fly ash treated and native samples.
Penetration resistance and durability Soil stiffness using the soil stiffness gauge The improvement in stiffness was also evaluated using the soil stiffness gauge (SSG, Geogauge) on laboratory samples and in the field. As described by Parsons and Milburn (2003b), the soil stiffness gauge is a non-nuclear hand-
An extensive evaluation of the performance of fly ash treated subgrades in service was conducted in coordination with the Overland Park Engineering Department. A total of 171 DCP tests were conducted on 12 streets with fly ash subgrades. The DCP test, described in detail in USACE (1994), consists of measuring penetration resistance by driving a rod tipped with a 20 mm diameter 608 steel cone into the subgrade by dropping an 8 kg sliding hammer a 8
8
7
Native
7
12% fly ash 6
Stiffness: MN/m
Swell: %
5 4 3
5
Untreated soil
4 3
2
2
1
1
0
Fly ash treated
6
16% fly ash
Native 12% fly ash 16% fly ash
0 Metcalf (CH)
Hugoton (CL)
Osage (CL)
Soil
Fig. 3. Reduction in swell potential for three soils with fly ash
1
10
100
1000
Time: hours
Fig. 4. Stiffness of laboratory samples with and without fly ash (Metcalf)
35
Parsons and Kneebone
Table 2. Stiffness gauge measurements for native and fly ash treated soil Native soil* Station
Fly ash treated soil*
Stiffness: MN/m
10 + 350 3m 6m 10 m 10 + 370 3m 6m 10 m
Modulus: MPa
6.1 7.3 6.7
52.9 63.1 58.0
5.2 7.8 7.9
44.8 67.9 68.8
6.8 1.1
Average Std dev.
Station
Stiffness: MN/m
Modulus: MPa
9.6 16.7 8.8
83.5 144.9 76.0
11.4 16.1 10.5
98.7 139.8 91.3
15.2 11.7 12.8
132.0 101.7 111.4
11.6 16.4 16.4 13.1 2.9
101.1 142.3 142.6 113.8 25.2
10 + 440 3m 6m 10m 10 + 460 3m 6m 10 m 10 + 480 3m 6m 10 m 10 + 490 3m 6m 10 m
59.3 9.3
*Values reported represent an average of three measurements.
292 DCP1:12
CBR ¼
distance of 57.4 mm. Penetration resistance was measured in the fly ash treated layer and in the untreated soils beneath to evaluate the relative and absolute improvement in soil strength. Access to the subgrade was obtained by drilling a hole approximately 2.54 cm in diameter through the existing asphalt pavement, as recommended by Livneh et al. (1995). The layer boundary was determined from plots of the penetration resistance, and was typically at a depth of approximately 20 cm. The total depth of testing was 41– 51 cm. Streets with a range of ages were included in the study to evaluate the effects of time on subgrade performance. Penetration resistance was converted to the more widely used California Bearing Ratio (CBR) value for this research. The US Army Corps of Engineers relationship for all soils (USACE, 1994), shown in equation (1), was used to convert penetration rate to the CBR values reported:
where DCP is the penetration rate in mm/blow. Final strength values increased by 40–250% over the strength of the untreated soil below the treated layer. The average CBR of the fly ash treated layers for all streets was 24, whereas that of the untreated layers beneath was 9. Strength values for each of the subgrades tested are shown in Fig. 5. These values represent the average values of 10–51 DCP tests for each street. Incorporation of fly ash made a statistically significant improvement in the strength of all soil subgrades treated with fly ash, as determined using the one-tailed Behrens– Fisher t9 test with a 95% level of confidence (Æ ¼ 0.05) with the exception of 127th and Nall, where the increase was significant with a 90% level of confidence. 127th and Nall had widely varying test values with four CBR values of 3 or
50
CBR – untreated layer
45
Fly ash treated layer
40 35
CBR
30 25 20 15 10 5
h) ly
lu
rf
Pf
(a f
te
ha m
M
et
ca
lf
ng ot ti N
as
m
te Es
ta
lo ol kh
m
s
w
ew Br oo
op
Vi
at le y H illt
he W
ou n
(S
.b
& ve ra ui Q & h
12 7t
36
d)
al l N
ch 12 7
th
An 3r d
14
12 7t
h
&
&
R
&
os
tio
eh
Bo nd
ar h
La
m 12 7t
& h 11 0t
ill
0
Fig. 5. Average CBR values for fly ash treated subgrades
(1)
Field performance of fly ash stabilised subgrades Lower Layer Upper Layer
35 30 25 CBR
lower for the fly ash treated layer and four values of 10 or greater. The average depth to the fly ash layer was estimated at only 11.2 cm, and four of 10 sample locations had higher CBR values in the untreated soil than in the fly ash layer directly above, which is highly unusual. These factors suggest that subgrade conditions were not uniform, and that results for this street reflect other factors in addition to the incorporation of fly ash. The results of the statistical analysis are summarised in Table 3.
20 15 10 5
Comparison of treated and untreated subgrades
0
Owing to the possibility that greater compactive effort was applied to the upper subgrade layer, it was considered possible that some of the increase in strength within the upper layer was the result of more compactive effort rather than the use of fly ash. To evaluate the effect of additional compaction on the upper soil layer, four untreated subgrades from neighbouring Lenexa, Kansas, and one untreated subgrade from Overland Park, all in service, were tested in an identical manner to the fly ash treated subgrades in Overland Park. No consistent improvement in strength for the upper layer was observed. One of the four streets had a statistically significant increase in strength in the upper subgrade layer, and one had a statistically significant decrease. These results may have been caused by variations in compactive effort or soil type. Average CBR values for the upper and lower subgrade layers were 13 and 10 for the untreated subgrades respectively. Based on these results, it was concluded that fly ash was the dominant cause of the increase in strength for the Overland Park subgrades. Complete results for the untreated subgrades are shown in Fig. 6, and a summary of the results of the statistical analysis is reported in Table 3.
Deterioration with age Durability of soil stabilisation agents varies with the type of stabilisation agent, soil type, environmental conditions, and percentage of stabilisation agent added to the soil in laboratory testing. To evaluate long-term performance, CBR values for
127th & Brittany Quivera Crest (N. bound) (Lenexa) (Overland Park)
Falcon Ridge Falcon Ridge Estate Villas (Lenexa) (Lenexa)
Parkhurst (Lenexa)
Fig. 6. CBR for upper and lower layers for untreated streets
the fly ash treated subgrades were compared with the age of the streets. The maximum age of the subgrades tested was 9 years. A plot of this comparison is shown in Fig. 7. This figure shows, again, that the fly ash treated subgrades were much more resistant to penetration, and that no correlation was observed between CBR and age for the subgrades tested. 127th and Quivira represents a particularly notable comparison. The southbound lanes were treated with fly ash and the northbound lanes were not. The northbound lanes have a CBR of 9 throughout the subgrade (Fig. 6), whereas the southbound lanes have a CBR of 32 for the fly ash treated layer over an untreated subgrade CBR of 10, a 220% increase in strength (Fig. 5). The pavement was 9 years old, and was the oldest section tested.
Implications for pavement thickness design An improved subgrade (or sub-base) will contribute to the overall strength of the pavement system. Current Overland
Table 3. Test results for Overland Park and Lenexa Streets Fly ash treated streets
110th and Lamar 127th and Bond 127th and Rosehill 143rd and Antioch 127th and Nall 127th and Quivira (S. bound) Wheatley Hilltop View Brookhollow Nottingham Estates Pflumm Metcalf (after fly ash) Average Untreated streets 127th and Quivira (N. bound) (OP) Brittany Crest (Lenexa) Falcon Ridge Estate (Lenexa) Falcon Ridge Villas (Lenexa) Parkhurst (Lenexa) Average
CBR Fly ash treated layer
Untreated layer
Percent of original strength: %
15 42 46 30 7 32 21 26 13 19 29 11 24
7 12 14 9 5 10 8 8 5 7 14 5 9
Upper layer Lower layer 9 9 25 6 20 19 4 7 7 8 13 10
Statistically significant improvement
Probability of improvement
Number of tests
Soil type
LL
PL
PI
210 350 330 330 140 320 260 330 260 270 210 220
Yes Yes Yes Yes No Yes Yes Yes Yes Yes Yes Yes
1.00 1.00 1.00 1.00 0.91 1.00 1.00 1.00 1.00 1.00 1.00 1.00 Number of tests
20 10 10 10 10 10 10 10 10 10 10 51 171
CH
50
26
24
MH CL CL CL CH CH CH CL CH CH
50 32 47 44 52 64
29 20 23 21 26 29
21 12 24 23 26 35
47 56 56
17 25 26
30 31 30
100 420 110 60 90
No Yes No Decreased No
0.64 0.98 0.59 0.99 0.92 Number of tests
10 11 11 11 11 54
CL CL CL CL CL
44 43 44 49 47
21 24 23 23 22
23 19 21 26 25
Note: Reported Atterberg limits are based on testing of nearby soils or original geotechnical reports. (OP (Overland Park)); MH (silt with a high liquid limit (LL > 50))
37
Parsons and Kneebone 50
References
Fly ash Untreated Linear (untreated) Linear (fly ash)
45 40 35
CBR
30 y ⫽ 1·04x ⫹ 19·13 R2 ⫽ 0·06 Low R2 values indicate little correlation between CBR and age
25 20 15 10
y ⫽ 0·19x ⫹ 7·72 R2 ⫽ 0·02
5 0 0
2
4
6
8
10
Age: years
Fig. 7. Relationship between CBR and years of service
Park street design is based on an assumed subgrade CBR of 5 (Parsons, 2002). Given the significant increases in strength achieved through soil improvement as documented in this report, Overland Park has adjusted its requirements to permit a reduction of pavement thickness for selected street types if the contractor demonstrates that the CBR of the treated layer (treatment method is not specified) is consistently greater than 15.
Conclusions Based on the results of the research described, the following conclusions were reached: (a) Incorporation of Class C fly ash into subgrade soils significantly improves the strength and stiffness of the pavement section very quickly. This benefit is particularly important because the heaviest loads to be placed on the subgrade often occur during construction of the road and the development of associated properties. (b) No decline with age in the performance of the treated subgrade was observed for pavements with ages up to 9 years. (c) Incorporation of Class C fly ash reduced soil plasticity and reduced the potential for swelling. Some swell potential still remained, however, for the more highly plastic clay. Use of fly ash alone for stabilisation of highly plastic clays may not be sufficient to improve soil properties to desired levels. (d) Increases in stiffness due to the incorporation of fly ash are substantial, and may be monitored using the soil stiffness gauge. (e) An improved subgrade contributes to the strength of the pavement system, and may provide for savings through reductions in the thickness of the asphalt section.
American Society for Testing and Materials (1998) Standard test method for unconfined compressive strength of compacted soil-lime mixtures. Annual Book of ASTM Standards. Section 4: Construction. 4.09. ASTM, West Conshohocken, PA, 93–98. American Society for Testing and Materials (1999a) Standard practice for classification of soils for engineering purposes (unified soil classification system). Annual Book of ASTM Standards. Section 4: Construction. 4.08. ASTM, West Conshohocken, PA, 220–230. American Society for Testing and Materials (1999b) Standard test method for laboratory compaction characteristics of soil using standard effort. Annual Book of ASTM Standards. Section 4: Construction. 4.08. ASTM, West Conshohocken, PA, 78–85. Chen D.-H., Wu W., He R., Bilyeu J. and Arrelano M. (1999) Evaluation of In-Situ Resilient Modulus Testing Techniques. ASCE, Geotechnical Special Publication No. 86, Reston, VA, pp. 1–11. Ferguson G. (1993) Use of self-cementing fly ashes as a soil stabilization agent. In Fly Ash for Soil Improvement. ASCE, New York, Geotechnical Special Publication No. 36, pp. 1–14. Ferguson G. and Levorson S. M. (1999) Soil and Pavement Base Stabilization with Self-Cementing Coal Fly Ash. American Coal Ash Association International, Alexandria, VA. Ferguson G. and Zey J. (1992) Use of Coal Ash in Highway Pavements: Kansas Demonstration Project. Electric Power Research Institute (EPRI), Palo Alto, CA, Final Report TR-100328. Humboldt (2000) Test Results, Evaluation of the Humboldt Geogauge on New Mexico Route 44. Humboldt Mfg Co., Norridge, IL. Livneh M., Ishai I. and Livneh N. A. (1995) Effect of vertical confinement on dynamic cone penetrometer strength values in pavement and subgrade evaluations In Transportation Research Record 1473, TRB, National Research Council, Washington, DC, pp. 1–8. McCallister L. D. and Petry T. M. (1991) Physical property changes in a lime-treated expansive clay caused by leaching. In Transportation Research Record 1295, Transportation Research Board, National Research Council, Washington, DC, pp. 37–44. Misra A. (1998) Stabilization characteristics of clays using Class C fly ash. In Transportation Research Record 1611, Transportation Research Board, National Research Council, Washington, DC, pp. 46–54. Parsons R. L. (2002) Subgrade Improvement through Fly Ash Stabilization. Technical Report, City of Overland Park, Kansas. Parsons R. L. and Milburn J. P. (2003a) Engineering performance of stabilized soils. Transportation Research Record, Journal of the Transportation Research Board, No. 1837, 20–29. Parsons R. L. and Milburn J. P. (2003b) Monitoring stabilized soils using the soil stiffness gauge. Proceedings of Soil Rock America 2003, 12th Pan-American Conference on Soil Mechanics and Geotechnical Engineering, Cambridge, MA, 2709–2713. Sawangsuriya A. and Edil T. B. (2002) Comparison of moduli obtained from the soil stiffness gauge with moduli from other tests. Proceedings of Transportation Research Board 81st Annual Meeting, Washington, DC, CD-ROM. Turner J. P. (1997) Evaluation of Western Coal fly ashes for stabilization of low-volume roads. In Testing Soil Mixed with Waste or Recycled Materials. American Society for Testing and Materials, West Conshohocken, PA, ASTM STP 1275, pp. 157– 171. United States Army Corps of Engineers (1994) Description And Application Of Dual-Mass Dynamic Cone Penetrometer. US Army Corps of Engineers, Washington, DC, FM 5-430-00-2/AFJPAM 32-8013, Vol. II, Appendix J.
Acknowledgements The City of Overland Park, Kansas, provided financial and logistical support for this project. Their assistance is greatly appreciated.
38
Discussion contributions on this paper should reach the editor by 1 July 2005