Lysinibacillus sphaericus. Clostridium novyi. Clostridium botulinum. Clostridium difficile. Clostridium kluyveri. Clostridium tetani. Clostridium acetobutylicum.
Figure S1 Histogram of degree of overlap between TARs in the two medias. An overlap of 0 means that the TAR is unique to that media, whereas an overlap of 1 means that the TAR is identical to a tar in the other media.
0
500
Frequency
1000
1500
TAR overlap
0.0
0.2
0.4
0.6
Fraction overlap
0.8
1.0
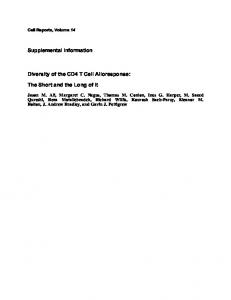
Benchmarking of Benchmarking TARs. (a) Shows of TARs. the ROC-like (a) Showscurve the ROC-like of found genes. curve The of found True genes. Positives The(TP) Trueare Positives the genes (TP)asare the genes as they are currently theyannotated are currently and the annotated False Positives and the (FP) Falseare Positives the same (FP)regions are thebut same on the regions opposite but on strand. the opposite (b) strand. (b) Figure shows S3 how many shows of the how know many Transcription of the knowStart Transcription Sites (TSSs) Start thatSites are (TSSs) found as that a function are found of as thea function distance of the distance Benchmarking of TARs. Shows the ROC-like curve of found genes. The True Positives (TP) are the genes as they are between this and between the (a) observed this andbreakpoint. the observed breakpoint.
currently annotated and the False Positives (FP) are the same regions but on the opposite strand. (b) shows how many of the know Transcription Start Sites (TSSs) that are found as a function of the distance between this and the observed breakpoint. (c) Autocorrelation of expression signal as a function of spatial organization of genes (red) or TARs (blue).
150 100 False Positives
250 200 150
True Positives
50 0 0200
10
20 0
30 10
0.8 0.6 0.4
● ●
0.2
●
●
●
●
●
●
0.0
Autocorrelation
●
●
1
5
●
●
●
● ● ● ● ● ● ● ● ●● ●
● ●
●
●● ● ● ●●●● ● ●●●●●●● ●●●●●●●●● ●●● ● ● ● ● ●●● ●●●●●●● ● ● ● ● ● ● ● ● ● ● ● ● ● ● ● ● ● ● ● ● ● ● ● ● ● ●● ● ● ● ● ●●● ● ● ● ●● ● ● ● ● ● ● ● ● ● ● ● ● ● ● ● ● ● ● ● ● ● ● ● ● ● ● ● ●● ● ● ●● ● ●●● ● ● ● ● ● ● ● ● ● ● ● ● ● ● ●● ●● ● ● ● ● ● ● ●● ● ● ● ● ● ● ● ● ●●●●● ● ● ● ● ●● ● ● ● ● ● ● ● ● ● ● ● ● ●● ● ● ● ● ● ● ● ● ● ● ● ● ● ● ● ● ● ● ●● ● ● ● ● ● ● ● ● ● ● ● ● ● ● ●● ● ● ● ● ● ●● ● ● ● ●● ●● ● ● ● ● ● ● ● ● ● ● ● ● ● ● ● ● ● ● ● ● ● ● ● ● ● ● ● ● ● ● ● ● ● ● ● ● ● ● ● ● ● ●● ●● ● ● ●● ●● ● ● ● ● ● ● ● ●● ● ● ● ● ● ● ● ● ● ● ● ● ● ● ● ● ● ● ● ● ● ● ●● ● ● ● ●● ● ● ● ● ● ● ● ● ● ● ● ● ● ● ● ● ● ● ●● ● ● ● ● ● ● ● ● ● ● ● ● ● ● ● ● ● ● ● ● ● ● ● ● ● ● ● ● ● ● ● ● ● ● ● ● ● ● ● ● ● ● ● ● ● ● ● ● ● ● ● ● ● ● ● ● ● ● ● ● ● ● ● ● ● ● ● ● ● ● ● ● ● ● ● ● ● ● ● ● ● ● ● ● ● ● ● ● ● ● ● ● ● ● ●● ●● ● ● ●● ● ● ● ● ● ● ● ●● ●● ●● ● ● ● ● ● ● ● ● ● ● ●● ● ● ● ● ● ● ● ● ● ● ● ● ● ● ● ● ● ● ● ●● ● ● ● ● ● ● ● ● ● ● ● ● ● ●● ● ● ● ● ● ● ● ● ● ● ●●● ●●● ●●●● ● ● ●● ● ● ● ● ● ● ● ● ● ● ● ● ● ● ● ● ● ● ● ● ● ● ● ● ● ● ● ● ● ● ● ● ● ● ● ● ● ● ● ● ● ● ● ● ● ● ● ● ● ● ● ● ● ● ● ● ● ● ● ● ● ● ● ● ● ● ● ● ● ● ● ● ● ● ● ● ● ● ● ● ● ● ● ● ● ● ● ● ● ● ● ● ● ● ● ● ● ● ● ● ● ● ● ● ● ● ● ● ● ● ● ● ● ● ● ● ● ● ● ● ● ● ● ● ● ● ● ● ● ● ● ● ● ● ● ● ● ● ● ● ● ● ● ● ● ● ● ● ● ● ● ● ● ● ● ● ● ● ● ● ● ● ● ● ● ● ● ● ● ● ● ● ● ● ● ● ● ● ● ● ● ● ● ● ● ● ● ● ● ● ● ● ● ● ● ● ● ● ● ● ● ● ● ● ● ● ● ● ● ● ● ● ● ● ● ● ● ● ● ● ● ● ● ● ● ● ● ● ● ● ● ● ● ● ● ● ● ● ● ● ● ● ● ● ● ● ● ● ● ● ● ● ● ● ● ● ● ● ● ● ● ●● ● ● ● ● ● ● ● ● ● ●● ● ● ● ● ● ● ● ● ● ● ● ● ● ● ● ●●● ● ● ●●●●● ● ● ● ● ● ● ● ● ● ● ● ● ● ● ● ● ● ● ● ● ● ● ● ● ● ●● ● ● ● ● ● ● ● ● ● ● ● ● ● ●●● ● ● ● ●●●● ● ● ● ● ● ● ● ● ● ● ● ● ● ● ● ●● ●● ●●●●● ● ● ● ● ● ● ● ● ● ● ● ● ● ● ● ● ● ● ● ● ● ● ● ● ● ● ● ● ● ● ● ● ● ● ● ●● ● ● ● ● ● ● ● ● ● ● ● ● ● ● ● ● ● ● ● ● ● ● ● ● ● ● ● ● ● ● ● ● ● ● ● ● ● ● ● ● ● ● ● ● ● ● ● ● ● ● ● ● ● ● ● ● ● ● ● ● ● ● ● ● ● ● ● ● ● ●● ●● ●● ● ●● ● ●● ● ● ● ● ● ● ● ● ● ● ● ● ● ● ●● ●● ● ●● ● ● ● ● ● ● ● ● ● ● ● ● ● ● ● ● ● ●● ● ● ● ● ● ● ● ● ● ● ● ● ● ● ● ● ● ●● ● ● ● ● ● ● ● ● ● ● ● ● ● ● ● ● ● ● ● ● ● ● ●● ●● ● ● ●● ● ● ● ● ● ● ●
10
40 20
50 30
60 40
70 50
60
TAR starts deviations TAR from starts known deviations TSS (bp) from known TSS (bp)
1.0
False Positives
200 150
LB M9 Random
100
250 200 50
100 50
TSS benchmarkTSS benchmark
LB M9 Random
0
0 500
b
300
300
b
150
True Positives
2000 1500 500
1000
True Positives
2000 1500 1000 0
500
True Positives
LB M9 Random
2500
LB M9 Random
0
c
b
Benchmark (Coverage) Benchmark (Coverage)
100
a
2500
a
a
50
100
Linear distance (nr of tars / genes)
500
1000
70
Figure S4 Density of gene expression of sporulation regulons, LB (a) and M9 (b). The regulons are color coded as: sigF (green), sigE (blue), sigG (yellow), sigK (red) and all genes (black). The vertical dotted line shows background signal. The composition of each regulon was taken from Steil et al., 2005 and is shown in (c).
0.8 0.6 0.2 0.0 0
c
0.4
Fraction of genes
0.6 0.4 0.0
0.2
Fraction of genes
0.8
1.0
b 1.0
a
2
4
6
8
10
0
Expression log2
Regulon
2
4
6
8
10
Expression log2
Genes in regulon
sigF
bofC, dacF, gpr, lonB, rsfA, spoIIQ, spoIIR, spoIVB, sspN, tlp, yphA, seaA
sigE
cotE, cotJA, cotJB, cotJC, cwlD, cwlJ, dacB, mmgA, mmgB, mmgC, mmgD, phoB, safA, spoIID, spoIIIAA, spoIIIAB, spoIIIAC, spoIIIAD, spoIIIAE, spoIIIAF, spoIIIAG, spoIIIAH, spoIIID, spoIVA, spoIVFA, spoIVFB, spoVD, spoVID, ysxE, spoVK, spoVR, usd, yaaH, ydhD, yjmC, exuR, exuT, uxuA, yjmD, uxuB, yknT, spoVM
sigG
coxA, csgA, gdh, gerAC, gerBA, gerBB, gerBC, gerD, sigG, sleB, splA, splB, spoIVB, spoVAA, spoVAB, spoVAC, spoVAD, spoVAEA, spoVAEB, spoVT, sspA, sspB, sspC, sspD, sspE, sspF, sspH, sspI, sspJ, sspK, sspL, sspN, tlp, ybaK, yhcN
sigK
cgeA, cgeB, cgeC, cgeE, cotA, cotB, cotD, cotF, cotG, cotH, cotS, cotV, cotW, cotX, cotY, cotZ, gerE, gerPA, gerPB, gerPC, gerPE, gerPF, spoIIIC, spoVFA, spoVFB, spsA, spsC, spsD, spsE, spsF, spsG, spsI, spsJ, spsK, sspG, tgl, yabG, ydgB, cotP, ydgA, ykvP, cotR, yvdP
Figure S5 Gene expression of prophage and prophage-like elements. Upper row show phage element expression in LB media and lower row gene expression in M9 media. Squares represents genes in the phage elements. The color scale range from white (low expression) to blue (high expression). Arrows indicate the sublancin area (bdbB to sunI) in the SPβ prophage.
SPbeta 1−96 SPbeta 97−192 SKIN PBSX pro1 pro2 pro3 pro4 pro5 pro6 pro7
Log2 Expression
0.8
2.7
4.6
6.5
8.4
SPβ:2152-2286 kb, PBSX: 1316-1347 kb, SKIN: 2653-2700 kb, pro1: 202-220 kb, pro2:529-570 kb, pro3: 652-665 kb, pro4:1262-1270 kb, pro5:1879-1891 kb, pro6: 2046-2073 kb, pro7: 2707-2756 kb.
Figure S6 Density plots of gene expression of prophage and prophage-like elements. Expression for LB and M9 is shown blue and red, respectively. Prophage coordinates are shown in Fig. S5.
6
8
2
4
6
8
0.5 0.3 0.0
0.1
0.2
Density 0
2
4
6
8
0
2
4
6
pro2
pro3
pro4
pro5
6
8
2
4
6
8
0.4 0.1 0.0 0
2
4
6
Log2 signal
pro6
pro7
All genes
Log2 signal
8
0.4 0.3
Density
0.1 0.0
0.1 0.0 6
0
2
4
6
Log2 signal
8
0
2
4
6
Log2 signal
0
2
4
6
Log2 signal
0.2
0.4 0.3
Density
0.2
0.4 0.3 0.2 0.1
4
8
0.5
Log2 signal
0.5
Log2 signal
2
0.3
Density
0.1 0.0 0
0.2
0.4 0.3
Density
0.1 0.0 4
0.2
0.4 0.3
Density
0.2
0.4 0.3 0.2 0.0
2
8
0.5
Log2 signal
0.5
Log2 signal
0.5
Log2 signal
0.5
Log2 signal
0.0 0
0.4
0.5 0.4 0.1 0.0 0
0.5
0
0.3
Density
0.1 0.0 4
pro1
0.2
0.4 0.3
Density 2
0.1
Density
0.2
0.4 0.3 0.2 0.0
0.1
Density
0
Density
PBSX
0.5
SKIN
0.5
SPbeta
8
8
ncr80
ncr75
ncr70
ncr65
ncr60
ncr55
ncr50
ncr45
ncr40
ncr35
ncr30
ncr25
ncr20
ncr15
ncr10
ncr5
ncr1
Figure S7 Conservation plot of non coding RNAs (ncr) identified. Nucleotide sequence of identified ncrs was compared against all available Firmicute sequences (genome and plasmid) and the maximum hit is plotted. The color scale ranges from black (0% identity) to white (100% identity).
Bacillus amyloliquefaciens Bacillus licheniformis Bacillus pumilus Bacillus cereus Bacillus weihenstephanensis Bacillus thuringiensis Bacillus anthracis Bacillus clausii Bacillus halodurans Geobacillus thermodenitrificans Geobacillus kaustophilus Lysinibacillus sphaericus Clostridium novyi Clostridium botulinum Clostridium difficile Clostridium kluyveri Clostridium tetani Clostridium acetobutylicum Clostridium perfringens Clostridium beijerinckii Clostridium phytofermentans Oceanobacillus iheyensis Staphylococcus haemolyticus Staphylococcus epidermidis Staphylococcus saprophyticus Staphylococcus aureus Exiguobacterium sibiricum Alkaliphilus metalliredigens Alkaliphilus oremlandii Thermoanaerobacter sp. Thermoanaerobacter pseudethanolicus Thermoanaerobacter tengcongensis Listeria monocytogenes Listeria welshimeri Listeria innocua Natranaerobius thermophilus Desulfotomaculum reducens Moorella thermoacetica Desulfitobacterium hafniense Carboxydothermus hydrogenoformans Lactobacillus brevis Lactobacillus fermentum Lactobacillus plantarum Lactobacillus delbrueckii Lactobacillus salivarius Lactobacillus reuteri Streptococcus pneumoniae Streptococcus thermophilus Streptococcus agalactiae Streptococcus gordonii Streptococcus sanguinis Streptococcus mutans Streptococcus pyogenes Streptococcus equi Streptococcus suis Pediococcus pentosaceus Pelotomaculum thermopropionicum Leuconostoc citreum Leuconostoc mesenteroides
Identity (%)
0
33
67
100
Figure S8 Sense overlap and antisense/ratio of antisense transcripts. (a) Fraction of sense genes (cds) overlapped by antisense transcript. Two distributions (< 0.7 and > 0.7) of overlaps can be seen. (b) For the 127 antisense transcripts, log2 sense (LB/M9) and log2 antisense (LB/M9) ratio is plotted. If antisense transcript is the primary regulator of the sense area at the conditions tested, the antisense and sense ratios would expect to be anti-correlated (upper left and lower right quarters). The number plotted corresponds to the shd nomenclature (e.g. 4 = shd4).
a
b 2
121
39
1.5
11
60 115103
58
38 117 49
9
8 126 94 124 26 67 32 7 82 91 118 120 75 62 123 54114 4751053586 1822 33 110 1670101 116 23 2 76 71 90 100 25 50 87 43 78 40 51 64 53 107 125 84 85 56 65 9677 44 111 17 68 69 46 66 106127 11021 98 52122 104 4889 119 93 15 7420 3 72 42 12 45 28 81 4157 34 63 24 36 31 95 6 37 61 27109 99 1997 113 112 13 79 92 80
55
−2
Sense ratio (LB/M9)
88
102 59 4
−4
1.0
83
−6
0.5
Density
0
14
30
108 73 29
0.0
0.2
0.4
0.6
Fraction overlap of sense gene
0.8
1.0
−3
−2
−1
0
Antisense ratio (LB/M9)
1
2
Figure S9 Folding of conserved 3’UTR RNA elements. All elements were folded using RNAfold v1.6 and bases are coloured according to base-pair probabilities, from 0 to 1 (purple, blue, green, yellow to red).
UU U C U AU AU AU AU CG UA UA GC GC CG UG UA GU A G A UG AU AU GC CG CG GA AU A C UGA A UA U CAAAA U GC U UCCUA GUUUU A A A C A G UC A U AGGAU GU U UC UUUGU C AUCU U A A U G C U A C G G C C G A U CAU G C A C U G U U GAA U A U A G C G C A U A U G U CG U G A A A A GU GCA A C C U A A G G U G AAG C G C G GG A C C A G A G CG C A A UA G C C G C G A A GC G C A G A U C AG G C C G U A U A A U A G G U U
dagK
U A AU AU UA GU A UC AU AU AU AU CG CG CG CG CG GC CG GU G G G G A UG
U
AU G U U U U A A AU G AU AU GU AU AU AU AU GC AU AU AU UA AU CG CG CG AU CG GC GC C A CG G GC CU GC CG A U GC C U UG C A C U C A UC A C GC GC CG CG GC U C CG GC CG GC CG AU UA UA GC CG UA UA UA UA U G UA U UA U UU U GG U A A A A U C C U A A A A C A G U AC G AC G GU U A AG AG A C A A A A A U U GCA A A AUCC U U C AU U C AU CAUUUUAGGAUUUUGUCA C A U U U U G U G A UU U C A U U U U CGUUUUAGG G G G G CUU U U C C C C G A G A U C U C G A G A AU A AU G U CC U C G G G UG A U A AU A U U A U A U A G A G C G C G C G C G U A C A U A U G U CG U CG U G U G A A A A A UA C A A UA C A G G G G A A C C C C U U A A A A G G G G U G A G UC GA A C A G CGG G C G GGA G A C C C A A G G C C G A G CG A A G G C A A C A UA G A G C U U C AG C G C G A G A A GC A GC G A G A C C G G G A G GU C GU A G A G C C C C G U U AU A U U A A A A A A U U U A G G U C U UU A A U A
C
U
tcyC
0
1
UU A U C A UC AU AU AU GC CG AU CG CG UA A C GA U A U U C A UU U A A
AC U A A U A A A AA UC AU AU GU AU GC CG GC G CU CG GC GC UA A A U U U U A A AU
phrG
A CU GC A U CG U GG C U GG C U GC AA CG UGG A CA A A AUCCUA AGA A A U U CAUC U A A GUUUUAGGAUUCUUU U U A GUA U G C U A C G G C C G A U C G A AU G U C G UG A U A U A U A G C G C G C A U G U CGUAA G G C A A A C A G A U G C U UA C G C G G A G A C A G G A C AC G A GC G A A U AG U C G CA G A G CG A C G G C A G UG C C G
ydcA
CG
A A UG CG G U A A A A GU GCA C A C U A A G G G A AU C G C G U A G C A G C AG G A C AC C G A U GC U GC A C A C A UG G A G GU AU GCA C C G GC U A A C U G U U AU ACG UU G CG A G C C AU G C CG G GAU A U UU C G A A G G GA U A U G U U A C G C G G C C A A GG
AUA A A U A AGC AU GU A U AU CG AU CG AU CG AU GC CG C GA CG CG CG GUG CG A A CG G U GC GA UG C GC A C GC C C CG C U G A C CA GC G GC CG AU G C A A GU UA G CC CCA U A CG G G CC A A GGAUUUU A UA AU U G C U U U C U U A C A A AUCCUA A UAC UA U GAUGA A AGA C A U AC U A U A C A A UUUUA U A C GU U A GG A A A A A U GA A U A AACC U G U U U AUCCU C A ACAAA UG A G A A U G U G G C C C CG A G G G G A A A U C U C U G A U G CA C C C U U G A G A CA C A CA A U CA U A U A A U A U A U C U C U C G C G C G C G C U G G AA C UA C A U G C U C G UU A G CU UU AC C C U C GC G C U UA U C G C G U A G UA U GC U U A A UA U U CGA U C C G U U U U U C C C G U G C C U C U C G C C CU C C U CC U C G G CU G A GC A G U G U G U C AC C U G C C U C GGU C C C G G G U C GU G U C C A C C CG G G U U A A C A C G UU U A A U C C U U AU C A AAA G AC A U A A
A A
U
C
yttB
yceJ
AU GC AU GC GUU GC G A UA U C GC A A A UA U A CG U G AC C C U UA UA UA CG AU GC CG GC UA GC A A U UG GC A UG AU AU AU CG CG CG UA UG GCG A U A A GU A C G CA U A A C G A G G A AU GC GC AU CG A G A C G CG CG A UA A G G C C AGC C A UU A GU G C AU A G GC C A GC GC AU A C G A UG A C U G UU A AU CG CG AU GC A CG GC U G C GAU G A U U G AA UG UA UG AU GC GC C GC A G GA
CG GC UG CG U GU CG U CA AAAA U UU GC UU UCCU AG CG GA AAAA GU UU UA U U C A G UU U UG GU CA AG A CG U U CU U CA U U C G G C C G A U C G A AU G U C G CG A U A U A U A G C G C G C
U A U A A A G U G G UUU
argI
ytvA
UUU U A U A U U AAU AU GC AU AU GC CG C GA G A A A U U U UG AU GC GC CG UA UA CG UA UA A A A A AUC U U UA CUA A A ACA GUAG G UUUAGGA CG A AG UUUUGUCA U UC UC U A C CU U G G C C G A U C G A AU G U C G UG A U A U A U A G C G C G C A U G U CG U G A A A UA C A G G A C C U A A G G U G A A U A C G G C GA C C A G C A G G 0 C C 1 A UA A U C G C G A A GC G A C G G G GU A G C C G U A U A A A U U G C C U
efeN