May 28, 2018 - Montage of spectra of selected O supergiant, B hypergiant, WNVLh, and LBV stars to ..... bers to those of yellow hypergiants (Yamamuro et al.
c ESO 2018
Astronomy & Astrophysics manuscript no. Quintuplet˙arxiv May 28, 2018
An updated stellar census of the Quintuplet cluster ⋆ J. S. Clark1 , M. E. Lohr1 , L. R. Patrick2,3,4 , F. Najarro5 , H. Dong6 , and D. F. Figer7 1
School of Physical Science, The Open University, Walton Hall, Milton Keynes, MK7 6AA, United Kingdom Instituto de Astrof´ısica de Canarias, E-38205 La Laguna, Tenerife, Spain 3 Universidad de La Laguna, Dpto Astrof´ısica, E-38206 La Laguna, Tenerife, Spain 4 Universidad de La Laguna, Dpto Astrofsica, E-38206 La Laguna, Tenerife, Spain 5 Departamento de Astrof´ısica, Centro de Astrobiolog´ıa, (CSIC-INTA), Ctra. Torrej´on a Ajalvir, km 4, 28850 Torrej´on de Ardoz, Madrid, Spain 6 Instituto de Astrof´ısica de Andaluc´ıa (CSIC), Glorieta de la Astronom´a S/N, E-18008 Granada, Spain 7 Center for Detectors, Rochester Institute of Technology, 74 Lomb Memorial Drive, Rochester, NY 14623, USA 0000-0002-4206733X
arXiv:1805.10139v1 [astro-ph.SR] 25 May 2018
2
Preprint online version: May 28, 2018 ABSTRACT
Context. The Quintuplet is one of the most massive young clusters in the Galaxy. As a consequence it offers the prospect of constraining stellar formation and evolution in extreme environments. However, current observations suggest that it comprises a remarkably diverse stellar population that is difficult to reconcile with an instantaneous formation event. Aims. To better understand the nature of the cluster we aim to improve observational constraints on the constituent stars. Methods. In order to accomplish this goal we present HST/NICMOS+WFC3 photometry and VLT/SINFONI+KMOS spectroscopy for ∼ 100 and 71 cluster members, respectively. Results. The Quintuplet appears far more homogeneous than previously expected. All supergiants are classified as either O7-8 Ia or O9-B0 Ia, with only one object of earlier (O5 I-III) spectral type. These stars form a smooth morphological sequence with a cohort of seven early-B hypergiants and six luminous blue variables and WN9-11h stars, which comprise the richest population of such stars of any stellar aggregate known. In parallel, we identify a smaller population of late-O hypergiants and spectroscopically similar WN8-9ha stars. No further H-free Wolf-Rayet (WR) stars were identified, resulting in a 13:1 ratio for WC/WN stars. A subset of the O9-B0 supergiants are unexpectedly faint, suggesting they are both less massive and older than the greater cluster population. Conclusions. Due to an uncertain extinction law, it is not possible to quantitatively determine a cluster age via isochrone fitting. Nevertheless, we find an impressive coincidence between the properties of cluster members preceding the H-free WR phase and the evolutionary predictions for a single, non-rotating 60M⊙ star, implying an age of ∼ 3.0 − 3.6Myr. Neither the late O-hypergiants nor the low luminosity supergiants are predicted by such a path; we suggest that the former either result from rapid rotators or are the products of binary driven mass-stripping, while the latter may be interlopers. The H-free WRs must evolve from stars with an initial mass in excess of 60M⊙ but it appears difficult to reconcile their observational properties with theoretical expectations. This is important since one would expect the most massive stars within the Quintuplet to be undergoing core-collapse/SNe at this time; since the WRs represent an evolutionary phase directly preceding this event,their physical properties are crucial to understanding both this process and the nature of the resultant relativistic remnant. As such, the Quintuplet provides unique observational constraints on the evolution and death of the most massive stars forming in the local, high metallicity Universe. Key words. stars:evolution - stars:early type - stars:binary - (Galaxy:) open clusters and associations: individual: Quintuplet
1. Introduction The formation and subsequent lifecycle of very massive stars is one of the outstanding problems of stellar physics, impacting on fields as diverse as the re-ionisation in the early Universe, the chemical enrichment of galaxies, and the production of both electromagnetic and gravitational wave transients. Recent observations suggest that the formation of such stars is, in many cases, hierarchical, with binaries and higher-order multiples forming in stellar clusters or associations, which in turn are located within cluster complexes. Such star-forming structures are characteristic of many external (starburst) galaxies; unfortunately, whilst it is possible to resolve and study individual clusters, one cannot identify their consituent stars. As a consequence one must rely on observations of local clusters and associations in order to ⋆ Based on observations made at the European Southern Observatory, Paranal, Chile under programme ESO 093.D-0306
benchmark the population and spectral synthesis codes used to infer the properties of such aggregates at cosmological distances. Found within ∼ 200pc of the Galactic Centre and characterised by predominantly molecular rather than atomic gas, the central molecular zone (CMZ) is of particular interest. The presence of numerous compact H ii regions within the Sgr B2 molecular cloud (e.g. De Pree et al. 1998), three young (< 10Myr) massive (& 104 M⊙ ) clusters (YMCs) - the Arches, Quintuplet, and circumnuclear Galactic Centre cluster (e.g. Figer et al. 1999b, Paumard et al. 2006) - as well as a population of apparently isolated massive stars (e.g. Mauerhan et al. 2010a, 2010c, Dong et al. 2011, 2012, 2015) points to dramatic recent and ongoing star formation within the CMZ. However, despite containing some ∼ 80% of the dense molecular gas within the Galaxy (Morris & Serabyn 1996) and with individual clouds apparently of sufficient mass and density to form clusters such as the Arches (e.g. G0.253+0.016; Longmore et al. 2012), the rate of star for1
J. S. Clark et al.: An updated stellar census of the Quintuplet cluster
mation (per unit mass) within the CMZ appears depressed by at least an order of magnitude in comparison to that inferred for the Galactic disc (Barnes et al. 2017). The reason(s) for this discrepancy are unclear (cf. Barnes et al. 2017), but given this observation and the extreme conditions present within the CMZ1 one might ask whether clusters and their constituent stars form in the same manner and have the same physical properties as their counterparts in more quiescent regions of the Galactic disc. This is an important question since circumnuclear starbursts are present in many external galaxies and the conditions within the CMZ are thought to be similar to those present within high redshift starburst galaxies (cf. Barnes et al. 2017, but see also Kauffmann 2017). In order to address these questions we have initiated a reappraisal of the properties of both the isolated and clustered stellar populations present within the CMZ. Previous publications (Clark et al. 2018, Lohr et al. 2018) have concentrated on the Arches, and in this paper we turn our attention to the Quintuplet. Initial near-IR surveys of the Galactic centre revealed the Quintuplet as a heavily blended source. However, in 1990 three groups successfully resolved the Quintuplet into multiple stellar sources (Glass et al. 1990, Nagata et al. 1990 and Okuda et al. 1990), with the latter two noting the extreme luminosity and cool spectral energy distribution of five members of the putative cluster. Subsequent spectroscopic confirmation of the presence of massive stars within the Quintuplet was provided by a number of different authors (e.g. Moneti et al. 1994, Geballe et al. 1994, Figer et al. 1995,1996, Cotera et al. 1996), with extensive spectroscopic surveys published by Figer et al. (1999a; henceforth Fi99a) and Liermann et al. (2009; henceforth Li09). In conjunction with photometric data, these observations suggested that the Quintuplet was both older than the Arches - e.g. 3 ± 0.5My (Liermann et al. 2012) to 4 ± 1Myr (Fi99a) versus ∼ 2 − 3Myr (Clark et al. 2018) - and substantially less dense, although integrated masses were expected to be broadly comparable (Figer et al. 1999b). These results, particularly the divergent cluster densities, prompt the question of whether the two clusters formed via different mechanisms or if secular evolution and/or an interaction with an outside agent such as the tidal field of the Galactic centre has led to this situation. Indeed, the large range of spectral types and luminosity classes apparently exhibited by Quintuplet members (e.g. Li09, Liermann et al. 2012) raises the possibility that the cluster is not co-eval and instead results from multiple episodes of star formation or the merger of sub-clusters of differing ages. Schneider et al. (2014) investigated this issue and were able to demonstrate that, despite these findings, the Quintuplet could be co-eval, but at the cost of inferring an (interacting) binary fraction of ∼ 60% and an age somewhat larger than commonly assumed (4.8 ± 1.1Myr). The possibility of a significant role for binary interaction in the evolution of the constituent stars of the Quintuplet heralds a further observational opportunity. Current spectral analysis suggest that it hosts a rich and diverse population of post-main sequence (MS) objects (Fi99a, Li09) including comparatively rare objects such as luminous blue variables (LBVs) and OB hypergiants. Despite the brevity of these phases, the extreme mass loss 1 The average density, pressure, temperature, and (turbulent) velocity dispersion of the gaseous material as well as the strength of the magnetic fields threading clumps, the frequency of clump/clump collisions, the intensity of the ambient radiation field and the cosmic ray ionisation rate are all significantly higher than found within the Galactic disc (cf. Barnes et al. 2017, Kauffmann 2017).
2
rates that characterise them are expected to profoundly influence the evolution of massive stars by stripping away the H-rich mantle to reveal the nuclear processed, chemically enriched core. If the cluster formation history may be adequately quantified, and the properties of the putative binary population constrained, the Quintuplet will serve as an excellent testbed for stellar evolution theory for both single and binary channels, providing constraints that complement those derived from both younger and older clusters such as the Arches and Westerlund 1, respectively (Clark et al. 2005a, 2018, Negueruela et al. 2010). In order to address these issues,this paper presents a (re)analysis of Hubble Space Telescope (HST)/NICMOS+WFC3 near-IR photometry and Very Large Telescope (VLT)/SINFONI+KMOS spectroscopy for the Quintuplet. In Sect. 2 we describe data acquisition and the reduction techniques employed before presenting the resultant datasets. Sect. 3 sets out the spectral classification of cluster members, with the implications of these for global cluster properties highlighted in Sect. 4. A discussion of issues arising from these findings is presented in Sect. 5, before we draw our final conclusions in Sect. 6.
2. Data acquisition, reduction and analysis 2.1. Spectroscopy
Data from VLT/KMOS and VLT/SINFONI were reduced following the methodology described below. The resultant spectra are presented in Figs. 1-9, A.1, and A.2. 2.1.1. VLT/KMOS data
The VLT-KMOS (Sharples et al. 2013) data for this paper were obtained under ESO programme 093.D-0306 (PI: Clark), with observations made between 2014 August 02-13. The spectral resolution of the observations is a function of rotator angles and the integral field units (IFUs) used (cf. Patrick et al. 2015), varying between ∆λ/λ ∼ 3895 − 4600. Each observing block consisted of 12×30 s exposures in an ABA observing pattern, where the first observation of each field used the more rigorous 24arm telluric standard star approach and all subsequent observations of the same field used the standard 3-arm telluric approach. The standard stars used for these observations were HIP 84846 (A0V), HIP 91137 (A0V), and HIP 3820 (B8V). Science and standard star observations were calibrated, reconstructed and combined using the KMOS/esorex pipeline (Davies et al. 2013). In the K-band the sky emission lines present a significant problem and to apply an accurate and consistent sky subtraction we used the KMOS/esorex pipeline with the sky tweak option. The wavelength solution for each extracted science and telluric standard star spectrum was checked and improved upon using an iterative cross-correlation approach, where a high resolution spectrum of the Earth’s telluric absorption was used as a reference2. As the majority of the useful diagnostic lines for these targets lie in a region of the K-band that is highly contaminated by telluric absorption, we implemented a rigorous telluric correction routine, adapted from Patrick et al. (2015, 2017). Specifically, to create a telluric spectrum free of stellar absorption features, the Br γ absorption line present in the standard star was modelled with a double Lorentzian profile, via an iterative approach 2 Retrieved from http://eso.org/sci/facilities/paranal/decommissioned/isaac/ tools/spectroscopic standards.html
J. S. Clark et al.: An updated stellar census of the Quintuplet cluster
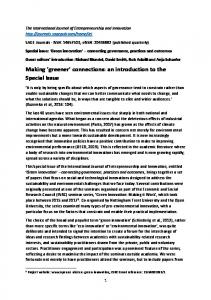
Fig. 1. Montage of spectra of selected O supergiant, B hypergiant, WNVLh, and LBV stars to illustrate the evolution in strengths of the Si iv, Si iii, and Mg ii lines as a function of decreasing stellar temperature. In order to render these transitions visible, the He i2.058µm and Brγ profiles of certain stars overlap; these are reproduced in Figs. 6 and 7. Note the appearance of pronounced emission in Fe ii in the coolest star, the LBV qF362. See Sect. 3.1 for further details. tailored to each KMOS IFU, in order to simultaneously fit the wings and centre of the profile in order to allow the most complete removal of it.
Once the Br γ correction is applied to an acceptable degree, the telluric standard star spectra are all continuum normalised by identifying multiple continuum points, where telluric contamination is minimised, across the entire spectral range (1.934 – 3
J. S. Clark et al.: An updated stellar census of the Quintuplet cluster
2.460 µm). A linear interpolation to these data creates a continuum spectrum, which is then used to divide each telluric spectrum. The science observations are continuum normalised in a similar fashion using, however, an entirely different set of continuum points tailored individually to the spectral appearance of the star in question. The final telluric correction is made when the science and telluric spectra are continuum normalised. In order to best match the telluric spectrum to the science, a scaling function is applied to the former, which is defined by using multiple wavelength regions where the telluric absorption is most severe. An appropriate scaling factor is identified for each region individually by iteratively comparing the science and telluric spectra. The scaling function is then defined for the entire wavelength range by means of a linear interpolation between the multiple indiviudal scaling factors. After the scaling function has been applied to the telluric spectrum, the science spectrum is divided by the resulting telluric spectrum. The telluric-corrected science spectrum is then continuum normalised in the fashion outlined above, using a linear interpolation to several continuum points which are defined on the basis of spectral appearance. In total this programme resulted in spectra of 19 cluster members, of which ten were in common with the VLT/SINFONI dataset of Li09 and nine unique to the VLT/KMOS observations. 2.1.2. VLT/SINFONI data
Spectroscopic observations were made in service mode3 of the central region of the Quintuplet cluster using the SINFONI integral field spectrograph on the ESO/VLT (Eisenhauer et al. 2003; Bonnet et al. 2004) between 18 May and 1 July 2006 (see Li09 for a full description of the instrument set-up, field placements and times of observation). The raw science and telluric frames and associated calibration files were downloaded from the ESO archive and reduced with the latest version of the ESO SINFONI pipeline running under Reflex, which performed flat-fielding and optical distortion corrections, wavelength calibration and improved sky background subtraction, before constructing co-added data cubes for each observation. As noted by Li09, the sky fields chosen contained obvious stars, contaminating the spectra of the sky-subtracted science fields in corresponding regions and in extreme cases producing negative stellar spectra in certain pixels of the science cubes. However, the majority of each sky-subtracted science cube was not significantly affected and was very well cleaned of OH sky emission lines by the new SINFONI pipeline software. Therefore, a flattened sky image was used to generate a bad pixel mask for each sky-subtracted science frame, and, with a version of the custom IDL code described in Clark et al. (2018), multiple uncontaminated spectral pixels were manually selected for each target of interest, and optimally combined to produce a single spectrum per object. This approach produced cleaner final spectra than the alternative methods of subtracting a “monochromatic median” of a starless region of each science cube (as carried out by Li09), or replacing the star-affected pixels of the sky images by median spectra derived from the whole sky cube prior to subtraction from the science cubes. A few fainter targets of interest were fully coincident with stars in the corresponding sky fields, and so were not extracted here, since no significant improvement in their spectra was to be expected relative to those published in Li09. Objects with obvious CO bandhead absorption (classified by Li09 as K–M giants or supergiants) were not generally ex3
4
ESO proposal 077.D-0281(A)
tracted, on the presumption that they were not cluster members and that further re-reduction would not reveal additional spectral features. Likewise we refrained from extracting spectra of obviously blended and/or particularly faint stars (foreshadowing Sect. 2.2 the faintest star for which a spectrum was extracted had mF205W ∼ 14.7). Science spectra had small corrections made to wavelength calibration, and telluric absorption line removal was carried out, as described fully in Sect. 2.1.1 above and Clark et al. (2018). Continuum normalisation again followed the methodology outlined above and in that work. Barycentric corrections were then applied, and, in the few cases where two observations had been made of a single object4 the two final spectra were averaged together. Bad lines (present at around 2.028 and 2.180µm in almost all spectra) were manually removed; a few other unphysical features resulting from nebular emission in the sky fields or from imperfect telluric correction were manually removed by interpolation, after careful comparison of science spectra to telluric or sky spectra to ensure the feature in question was spurious and not astrophysical in origin. However two fields were subject to nebular contamination in both He i 2.059µm and Brγ which we were unable to remove in a robust and objective manner from the spectra of a number of stars5 . Foreshadowing Sect. 3 both transitions are important classification diagnostics. Additional diagnostics in regions free of nebular contamination suggested early spectral-types for both LHO5 and -143; unfortunately the low S/N of the remaining objects precluded meaningful analysis, save that they do not appear to be WR stars due to their lack of strong broad emission lines. As a consequence we do not discuss these stars further. We suspect residual contamination in the Brγ emission profile of LHO16 and the absorption feature of LHO149, although these are retained since it proved possible to classify them. This resulted in a much reduced dataset of spectra for 54 stars compared to the 160 presented in Li09 (noting that 62 of these were of stars of spectral-type K or M and hence were not re-extracted). However the methodology employed here greatly improved the S/N of the resultant spectra, allowing us to access weaker emission (e.g. C iv 2.079µm) and absorption (e.g. He ii 2.189µm) features that are critical to spectral classification of massive stars (Sect.3). 2.2. Photometry
Currently, the only photometric data available for indivdual stars in the literature is derived from ground-based observations (e.g. Fi99a, Li09). Given the limitations of such data in terms of crowding and atmospheric transmission we compiled HST/NICMOS+WFC3 observations of potential members of the Quintuplet. These are of both greater sensitivity and angular resolution than previous studies and critically also permit the construction of spectral energy distributions and subsequent de-reddening of individual stars, as well as direct comparison to members of the Arches and isolated massive stars across the CMZ for which HST data are also available. HST/NICMOS observations of the Quintuplet in the F110W, F160W, and F205W filters were made in 1997 (GO 7362; PI Figer) and are described and presented in Figer et al. (1999b). We refer the reader to that work for details of reduction and analysis. Unfortunately photometric data associated with individual 4 Where field placements overlapped - objects LHO67, -69, -71, -75, and -110. 5 LHO5, -9, -143, -145, -152, -154, -157, and -159.
J. S. Clark et al.: An updated stellar census of the Quintuplet cluster
NIII blend
LHO39 (12.6mag)
LHO44 (12.0mag)
O9 Ia
LHO51 (12.2mag) CIV
LHO54 (12.1mag)
BrGamma LHO148 (12.3mag)
LHO141 (12.5mag)
O9 Ia
HeII HeI HeI HeI
Fig. 2. Examples of cluster supergiants (black) which appear earlier than O9-B0 Ia template spectra (red; Hanson et al. 2005) by virtue of ubiquitous and pronounced He ii 2.189µm absorption and C iv 2.079µm emission. Even when the strength of He ii 2.189µm absorption is comparable to the O9 Ia template (e.g. LHO44), the combination of C iv 2.079µm emission and/or much weaker He i 2.112µm absorption clearly marks them out as of earlier spectral type. We therefore adopt a classification of O7-8 Ia, noting that the broad Brγ emission in LHO54 leads to a classification of O7-8 Ia(+) (Sects. 3.2 and 3.3). HST/NICMOS F205W magnitudes are given in parentheses (Table A.1). stars was not presented in that work, and so here we provide such a breakdown by cluster member (Table A.1). Complimentary and hitherto unpublished HST/WFC3 photometry in the F127M, F139M, and F153M filters was obtained in 2010-2012 under programmes GO-11671, 12318, and 12667 (PI, Andrea Ghez); a detailed description of data acquisition, reduction and analysis, including error determination, can be found in Dong et al. (2017). An initial target list was derived from the catalogues of stellar sources given in Fi99a and Li09, with the exclusion of the K-M stars which are likely interlopers. This contained a number of sources from Li09 that are found within the core of the cluster and for which we were unable to re-extract and process unblended spectra; these were retained to inform future observational programmes. In order to match sources from both HST programmes the coordinate system derived from the WFC3 dataset was applied to the NICMOS image. A star was considered detected in the NICMOS dataset if it lay within 2.5pixel of its expected position as determined from the WFC3 observations. This resulted in a total of 108 sources, for which photometry is presented in Table A.1. Of these, four WFC3 sources lack NICMOS photometry, while the NICMOS counterpart is uncertain for a further five objects due to the presence of more than one object within the search radius. These are flagged within
the comments of Table A.1, as are eight further stars for which spectral classifications are available but photometry is unavailable due to blending or their falling outside the fields-of-view of the observations. Given the very reddened nature of the stars within the Quintuplet, the differing filter passbands and the possibility of blending we refrain from comparing the resultant dataset to published ground based observations (Fi99a, Li09). Likewise we highlight that the NICMOS and WFC3 data were obtained over a decade apart and that a number of stars are either known to be variable (e.g. the LBVs; Glass et al. 1999, Mauerhan et al. 2010a) or might be anticipated to be based on other examples (e.g. the WNLh and WCL cohorts); thus caution should be applied in constructing and interpreting spectral energy distributions from these data.
3. Spectral classification In combination the VLT/SINFONI+KMOS datasets yield spectra of 63 unique stars. To these we may add historical spectra of a further eight stars. Six of these originate in Fi99a, while the seventh and eighth, of the candidate late-O supergiant qF344 and 5
J. S. Clark et al.: An updated stellar census of the Quintuplet cluster
NIII blend HeI O9 Ia
LHO89 (11.6mag)
HeII LHO46 (11.2mag)
CIV
BrGamma
LHO90 (10.8mag)
LHO74 (11.4mag)
B0 Ia
LHO143 (10.9mag)
HeI HeI
Fig. 3. Examples of cluster supergiants (black) which we may classify as O9-B0 Ia due to their close correspondence to appropriate template spectra (red) from Hanson et al. (2005). HST/NICMOS F205W magnitudes are given in parentheses (Table A.1). et al. (2010a, 2010b). This results in a spectroscopic census of 71 putative massive cluster members. Unlike our Arches survey (Clark et al. 2018) it is not anticipated that these observations will be sensitive enough to reliably reach the main sequence and giant cluster populations. Moreover, as a consequence of their low spectral resolution, S/N and amplitude of spectral features present, we treat classifications derived from spectra presented by Fi99a as provisional7. 3.1. Methodology
Fig. 4. The spectrum of LHO72 (black), the earliest O star detected within the Quintuplet and O5 Ia and O5 III template spectra (red) for comparison. The HST/NICMOS F205W magnitude is given in parenthesis (Table A.1). the LBV G0.120-0.048 (= [DWC2011] 92)6 , are from Mauerhan 6
Which, given its proximity and similarity to both the Pistol star and qF362 we consider likely to have originated in the Quintuplet (cf. Mauerhan et al. (2010b) 6
As with the Arches, uncertainty in the correct extinction law to apply and likely differential reddening across the Quintuplet means that we rely solely on spectroscopic data for classification purposes. A detailed reprise of spectral diagnostics in the K-band window was provided in Clark et al. (2018); we do not reproduce this here for reasons of space. However, given the more diverse nature of the stellar population of the Quintuplet we briefly describe relevant publications utilised for classification and salient details of the procedure if not contained within that work. Hanson et al. (2005) provide classification criteria for OB supergiants although, foreshadowing Sect. 3.2, there is an unfortunate absence of template spectra of spectral type ∼O6.58. We employ data from the Arches supplemented by the low 7 Stars previously identified as late-O/early-B supergiants have subsequently been classified as late-type stars (qF269), LBVs (qF362), WCLs (qF250), and mid-late O and early-B hypergiants (qF257, qF270S, qF278, qF381, and qF406).
J. S. Clark et al.: An updated stellar census of the Quintuplet cluster
qF274 (10.9mag) HeI
CIV
LHO99 (10.6mag) Arches B1
WN8-9h
NIII blend LHO1 (10.6mag) qF406 Arches F10
O7-8Ia+
LHO54 (12.1mag) Arches F13
O7-8Ia+
HeI
BrGamma HeII
HeI
Fig. 5. Spectra of late O hypergiant and WN8-9h cluster members (black) in comparison to spectra of stars within the Arches cluster (red; Clark et al. 2018). Where available HST/NICMOS F205W magnitudes are given in parentheses (Table A.1). spectral resolution and S/N data from Hanson et al. (1996) to infer trends in spectral morphologies for supergiants in this range. No one publication presents classification criteria for OB hypergiants; for early- to mid-O hypergiants we utilise Hanson et al. (2005) and Clark et al. (2018), while spectra and analysis of late-O/early-B hypergiants are provided by Clark et al. (2012, 2014b) and Waisberg et al. (2017). Representative spectra of LBVs in both hot- and cool-phases are provided by Morris et al. (1996), Clark et al. (2003, 2005b, 2009a, 2011) and Oksala et al. (2013). Wolf-Rayet classification criteria are provided by Figer et al. (1997), Crowther et al. (2006), Crowther & Walborn (2011) and Rosslowe & Crowther (2018). However there are a number of additional diagnostics not discussed in these works that are newly accessible to us via our greatly improved telluric correction and sky subtraction. The most prominant of these is a strong emission feature at ∼ 2.43µm. Non-LTE model atmosphere simulations utilising the CMFGEN code (Hillier & Miller 1998,1999) suggest the identity of this feature is sensitive to temperature, with contributions from, respectively, the n=10→9 lines of O iv, N iv, C iv, and finally Si iv as one transitions to cooler temperatures, with the latter dominating for the stars considered here. Given this one would also expect the emission feature to demonstrate an explicit abundance dependence as the products of CNO burning are revealed at the stellar surface. Following the discussion in Clark et al. (2018) for WNLh stars hotter than ∼ 30kK one would expect Si iv to dominate the emission feature. N iv starts to contribute at ∼ 32kK, equalling
the strength of Si iv at 36.5kK. Subject to depletion C iv might be expected to provide a minor contribution; since the stars considered here are almost certainly cooler than ∼ 45kK one would not expect a contribution from O iv. Similarly for supergiants of spectral type mid-O and later one would expect this feature to result from a combination of Si iv, C iv, and N iv, with Si iv increasingly dominant for cooler stars. Simulations indicate that the Si iv ∼ 2.427µm feature drops out around spectral types ∼B1.5-2 (∼ 18 − 20kK); high S/N spectra of stars in this temperature range which drive dense winds reveals the presence of additional weak Si iii 2.0367, 2.0746, 2.0805, 2.0863, 2.1013, and 2.1323µm emission lines8 . Emission also develops in the Mg ii 2.1369, 2.1432, 2.4042, and 2.4125µm lines, which become particularly prominent for spectral type B3 and later (. 15 − 16kK). Finally, for comparatively cool stars (. 10kK), absorption in the He i 2.112µm line disappears and the Na i 2.206/9µm transitions may be seen in emission (cf. Clark et al. 2011). The spectra of Quintuplet members presented in Fig. 1 show the expected trends in line strengths for Si iv ∼ 2.427µm, Mg ii 2.138, 2.144, and 2.4125µm and the multiple Si iii transitions, while the weakening of He i 2.112µm absorption and development of Na i 2.206/9µm emission at yet cooler temperatures is apparent in the montage of LBV spectra in Fig. 7. The classifi8
Additional Si iii emission and absorption features are present within the K-band spectral window; here we simply reproduce the subset that are present in LHO67 and are not blended with other stronger lines. 7
J. S. Clark et al.: An updated stellar census of the Quintuplet cluster
Fig. 6. Left panel: montage of spectra of early-B hypergiants within the Quintuplet. The spectrum of the B1 Ia+ hypergiant BP Cru is provided for comparison (red; spectrum from Waisberg et al. 2017). Right panel: comparison of the B0-1 Ia+ star qF381 to the cluster WN10h star LHO67 and the WN11h star LHO71. Given the scale only prominent emission lines are shown; weaker transitions are indicated in Fig. 1. Where available HST/NICMOS F205W magnitudes are given in parentheses (Table A.1). cations of individual spectra in these figures is discussed further below. Supergiant B[e] (sgB[e]) stars complete the menagerie of hot and massive evolved stars relevant to the Quintuplet. Such stars are of considerable interest as they are thought to be masive binaries either undergoing (e.g. Wd1-9; Clark et al. 2013b, Fenech et al. 2017), or to have recently exited from, rapid (case-A) mass transfer (e.g. Kastner et al. 2010, Clark et al. 2013a). Spectra of sgB[e] stars are presented by Clark et al. (1999), Oksala et al. (2013) and Liermann et al. (2014); superficially these resemble those of LBVs, being dominated by emission from hydrogen, helium and low excitation metallic species. However a large number also present CO bandhead in emission and, by definition, all show a pronounced near-IR excess due to hot circumstellar dust; no stars within the Quintuplet fulfil all these criteria. 8
Finally we turn to stars of later (F-M) spectral type. Liermann et al. (2012) identify a possible population of low mass (< 9M⊙ ) red supergiants via pronounced CO bandhead absorption (Davies et al. 2012) but, given their discrepant radial velocities, they conclude that these are likely interlopers. The most luminous - LHO7 (=MGM 5-7) - has a mass of ∼ 15−20M⊙, significantly less than we infer for bona fide cluster members (Sect. 4) suggesting it too is unlikely to be a cluster member. More massive (≥ 30 − 40M⊙ ) RSGs - such as those within Westerlund 1 (Borgmann et al. 1970, Westerlund 1987) - would support nearIR luminosities that would rival or exceed the Quintuplet-proper members and consequently we can conclude that such stars are not present. Likewise, comparison of the spectra of cluster members to those of yellow hypergiants (Yamamuro et al. 2007, Clark et al. 2014a) show these too are absent.
J. S. Clark et al.: An updated stellar census of the Quintuplet cluster
Fig. 7. Montage of spectra of cluster LBVs (qF362, the Pistol star and G0.120-0.048) in comparison to field LBVs and WNLh stars. Spectra of the latter from Martins et al. (2007; GC IRS 34W and 16C), Clark et al. (2009a; W51 LS1), Najarro (2001; P Cygni), Egan et al. (2002; Wra17-96), Clark et al. (2009b; AFGL 2298), this work (footnote 11; G24.73+0.69), and Yamamuro et al. (2007; IRC +10 420). Given the scale only prominent emission lines are shown; weaker transitions are indicated in Fig. 1. Given that Mauerhan et al. (2010b) demonstrate that all three LBVs are variable we refrain from presenting HST data for these stars.
9
J. S. Clark et al.: An updated stellar census of the Quintuplet cluster
3.2. OB supergiants
Accurate classification of the supergiant cohort is vital given the implications it has for both the age and the co-evality of the Quintuplet. Consequently, one of the more surprising results of Li09 is that the hot supergiants they identify appear to span an unexpectedly wide range of spectral types, from as early as O3 (e.g. LHO1, -17, -65, and -128) to B3 (LHO32 and -37) although many are classified within a more restricted range of spectral types (∼O7-B1). Fortunately, the higher S/N afforded by our combined spectroscopic dataset affords greater confidence in the presence, or otherwise, of weak, temperature dependent classification criteria such as C iv 2.079µm, He i 2.112µm, and He ii 2.189µm, as well as permitting a robust interpretation of the blended He i 2.162µm+Brγ profile, which is sensitive to stellar luminosity as well as temperature. As can be seen from Figs. 2 and 3, the majority of supergiants can be divided into two distinct morphological groups on the basis of these diagnostics. The first consists of 18 supergiants (with mF205W ∼ 12−13.1) that are characterised by C iv 2.079µm emission and/or He ii 2.189µm absorption (including the transitional super-/hypergiant LHO54; Figs. 2 and A.1 and Table 1). The presence of the former and the weakness of the temperature-sensitive He i 2.112µm absorption feature in comparison to the template spectra of Hanson et al. (2005) suggests a spectral-type earlier than O9 Ia. Conversely the presence of He i 2.112µm absorption and the comparative weakness of C iv 2.079µm emission suggests that these stars are cooler than the O4-6 Ia supergiants that characterise the Arches cluster (Martins et al. 2008, Clark et al. 2018). Mindful of the lack of appropriate template spectra, we consequently adopt an intermediate classification of O7-8 Ia for these stars. An additional argument for this assignment is the depth of Brγ absorption in many of these stars, being markedly more pronounced than the He ii 2.189µm line. Emission is present in the He i 2.162µm+Brγ blend of a number of these stars, albeit of differing nature - e.g. the broad emission in LHO54 (see also Sect. 3.3.1) versus the narrow emission components in the red wing of Brγ in LHO141 and -148. Additionally a degree of infilling appears present in LHO31, -73, -118, and -144. He i 2.059µm is seen in absorption, with narrow emission in the red wing again seen in stars such as LHO141 and -148; mirroring the behaviour of Brγ and arguing for the presence of stronger winds in these objects. The second cohort comprises nine stars which closely match the O9-B0 Ia template spectra from Hanson et al. (2005; Figs. 3 and A.2 and Table 1). These uniformly lack C iv 2.079µm emission and the He ii 2.189µm photospheric profile is very weak or absent. Pronounced absorption is seen in the He i 2.112µm line and the He i 2.162µm+Brγ blend, although emission in the red wing of the Brγ profile may be present in some stars (e.g. LHO89). The He i 2.059µm profile is complex, with apparent infilling or narrow emission components present in a number of stars (e.g. LHO90 and -143). Five of these objects (Fig. 3) appear more luminous than the O7-8 Ia cohort, with mF205W ∼ 10.9 − 11.6; unexpectedly the remaining four (Fig. A.2) appear systematically fainter with mF205W ∼ 13.0 − 13.8, despite having comparable near-IR colours (hence apparently excluding differential reddening as an explanation). Additionally, six rather faint objects (mF205W ∼ 13.3 − 14.7) have low S/N spectra that are dominated by a pronounced Brγ photospheric profile, with He i 2.059µm and/or 2.112µm absorption also present in some cases. The Brγ profiles appear systematically too deep for them to be early-mid O-type stars (cf. 10
Martins et al. 2008, Clark et al. 2018), while they also lack the pronounced emission in the 2.11µm blend that is ubiquitous in such stars. Subject to the low S/N, pronounced He ii 2.189µm emission also appears to be absent. As a consequence, while we assign a generic OB star classification, we suspect these are unlikely to have a spectral type earlier than late-O. Li09 suggest that a number of stars potentially have rather early classifications (e.g. LHO88 and -128; O3-4 IIIf and O35 I, respectively). Our results do not support this hypothesis (cf. Table 1), with LHO72 appearing to be of the earliest spectral type of our sample (Fig. 4): the comparable strength of emission in C iv 2.079µm and the He i+N iii ∼ 2.11µm blend, when combined with the lack of He i 2.112µm absorption and the strong He ii 2.189µm photospheric profile, suggesting an O5 classification. Differentiating between luminosity class I-III is difficult based solely on spectral morphology, although with mF205W ∼ 12.9 LHO72 is broadly comparable to the fainter subset of the O7-8 supergiants discussed above Finally we turn to the six stars for which only archival spectra are available. Comparing the spectrum of qF344 from Mauerhan et al. (2010a) to our dataset suggests a tentative O78 Ia clasification on the basis of the strong He ii absorption although, with mF205W ∼ 11.5, it is somewhat brighter than other examples (possibly suggesting a marginally later classification). Likely due to their low S/N and resolution, the spectra of four of the remaining five stars9 appear essentially featureless; the exception being qF307, which appears to have He i 2.059µm in emission. The classifications suggested by Fi99a are broadly consistent with the wider supergiant cohort and their near-IR magnitudes. A possible exception is qF307; the combination of its brightness and spectral morphology suggesting a potential early-B hypergiant classification (cf. qF257, -278, and -381; footnote 7 and Sect. 3.3). 3.3. Hypergiants
Our data suggest the presence of two distinct cohorts of hypergiants within the Quintuplet, distinguished by their temperatures; we discuss these separately below. 3.3.1. O hypergiants
As described in Sect. 3.2, a subset of stars with spectral features consistent with spectral type O7-8 show broad emission in Brγ, indicative of a more developed stellar wind than generally seen in the supergiant population. Of these both LHO54 and qF406 bear close resemblance to the hypergiants within the Arches cluster (Fig. 5), with the former apparently intermediate between qF406 and the Quintuplet supergiants. LHO1 appears more extreme, with emission also present in He i 2.059µm. As a consequence we adopt an O7-8 Ia+ classification for LHO1 and qF406 and O7-8 Ia(+) for LHO54 (Table 1). 3.3.2. B hypergiants
Li09 identifies a subset of five stars - LHO77, -96, -100, -110, and -146 - defined by the presence of strong, narrow emission in He i 2.059µm and absorption in the He i 2.112µm line. Following our (re-)reduction of the combined datasets we may add LHO29 and qF381 to this grouping (Fig. 6). Li09 define these as O6-8 Ife 9
qF157 ( 60M⊙ and most likely & 85M⊙ - but might be reconcilable if a binary formation channel was/is dominant in the Quintuplet and leads to enhanced mass-loss and hence lower mass and luminosity WC stars. Intriguingly, the sole WC9 cluster member for which parameters have been determined - LHO19 (=MGM 5-3; Najarro et al. 2017) - appears to be sub-luminous in comparison to theoretical predictions (Sect. 4.3). Based on the calibration of Langer (1989) the range of luminosities allowed for the WC component of LHO19 corresponds to current masses of ∼ 10 − 12M⊙ . This is already significantly lower than the masses predicted for the pre-core collapse endpoints of non-rotating (rotating) stars of initial masses 120M⊙ , 85M⊙ , and 60M⊙ - 30.7M⊙ (18.9M⊙), 18.5M⊙ (26.2M⊙), and 12.4M⊙ (18.9M⊙ ) respectively (Groh et al. 2013) - suggesting an additional source of mass-loss for this system. Although challenging, quantitative analysis of the remaining WC stars (via assessment of the relative contributions from primary, secondary and circumstellar dust) appears essential for 20
both internal differentiation - i.e. is LHO19 anomalously faint? and subsequent comparison to theoretical predictions in order to ascertain their formation channel(s). 5.3. The faint O9-B0 Ia stars
Finally we turn to the four anomalously faint O9-B0 stars LHO33, -41, -128, and -132 (Sect. 3.2) - and, by extension, likely a number of stars currently assigned a generic OB classification. Comparison to both cluster- and template-spectra suggest these are supergiants; certainly their relative brightness means they must be evolved post-MS stars (cf. the absolute magnitudes of OB main sequence stars presented in Martins & Plez 2006a and Pecaut & Mamajek 2013). MaP17 suggest that lateO/early B supergiants may evolve from stars of initial mass as low as ∼ 40M⊙ (see also Weidner & Vink 2010), which would be expected to be less luminous than the majority population of the Quintuplet. This prediction is borne out by observations of Westerlund 1, where the eclipsing binary Wd1-13 suggests initial masses of 35 − 40M⊙ (Ritchie et al. 2010) for the rich O9-B3 Ia population (Negueruela et al. 2010, Clark et al. in prep.). However this would imply a significantly greater age for this cohort in comparison to the remaining population of the Quintuplet, with Westerlund 1 thought to be ∼ 5Myr old (Negueruela et al. 2010). Rapid rotation and/or binary interaction cannot explain this discrepancy, since it would produce a cohort of stars that appear younger, hotter, and potentially more luminous than the dominant population of the Quintuplet, in direct contrast to observations. As a consequence does this subset of stars indicate that the cluster is indeed non-coeval? While such a conclusion cannot be ruled out - arising either from the merger of sub-clusters or genuine multi-generational star formation in a single stellar aggregate - other options suggest themselves. Embedded within the G305 star-forming complex (Clark & Porter 2004) and separated by a projected distance of ∼ 4pc, the young massive clusters Danks 1 and 2 show a clear difference in ages (1.5+1.5 −0.5 Myr Myr, respectively; Davies et al. 2012); one could easily and 3+3 −1 imagine a situation in which similarly physically distinct clusters were projected against each other along the same line of sight to the Quintuplet. Intriguingly, Steinke et al. (2016) report the discovery of a handful of OB stars in proximity to the WN6 star qF353E, which they suggest may represent a distinct stellar cluster, potentially supportive of the idea of a spatially and temporally extended episode of star formation that could yield the requisite spread in stellar ages along the line of sight to the Quintuplet. Alternatively, the CMZ hosts an additional population of apparently isolated massive stars of uncertain origin, which includes late-O/early-B supergiants comparable to these stars (Mauerhan et al. 2010a, 2010c). In principle, one could envisage the chance superposition of a number of such ‘field’ stars onto the Quintuplet, although the compactness of the cluster and the homogeneity of the putative population of interlopers would mitigate against this possibility. In any event determining the origin of this stellar population would seem key to determining the co-evality (or otherwise) of the Quintuplet and the star formation history in its vicinity.
6. Conclusions and future perspectives This paper reports the results of a combined photometric (HST/NICMOS+WFC3) and spectroscopic study of
J. S. Clark et al.: An updated stellar census of the Quintuplet cluster
the Quintuplet cluster, the latter comprising both archival (VLT/SINFONI) and new (VLT/KMOS) data. Photometry is supplied for 108 objects derived from the combined target lists of Fi99a and Li09a and from which stars of late spectral type have been excluded. We present new spectra of 63 unique objects for which our re-reduction of the VLT/SINFONI data has resulted in a much improved S/N ratio, permitting reliable assessment of faint classification diagnostics such as He ii 2.189µm and C iv 2.079µm. These are supplemented by lower S/N and resolution published data for a further eight stars, yielding a final spectroscopic dataset of 71 stars. Analysis of these data results in the re-classification of ∼ 70% of the cluster members. The major finding of this analysis is that the Quintuplet appears to be far more homogeneous than previous studies have suggested. All supergiants classified were of spectral types O7-8 and O9-B0 with the exception of a sole O5 I-III star. Despite the suggestion that stars with spectral type as early as O3 might be present (Li09), this is currently the earliest spectral type identified. In terms of spectral morphology the supergiant cohort smoothly extends through populations of early-B hypergiants and LBV/WN9-11h stars. However a ‘parallel channel’ comprising mid-late O hypergiants and WN8-9ha stars is also present. No further examples of H-free WRs were detected; these comprise a single WN6 star and a rich population of WC8-9 stars, of which a majority appear to be binaries. No main sequence objects were identified, presumably due to the limited depth of the current observations. Due to uncertainty regarding the correct extinction law to employ and the probability of differential reddening, it was not possible to quantitatively determine a cluster age via isochrone fitting. We likewise refrain from determining a cluster mass function and hence estimating an integrated cluster mass at this time, noting simply that the large number of hitherto rare spectral sub-types (e.g. BHGs and LBVs) attests to the presumably extreme mass of the Quintuplet. Nevertheless, comparison to other young massive clusters and the output of a combination of single-star evolutionary and spectral synthesis codes suggests a cluster age of ∼ 3.0 − 3.6Myr. This implies progenitor masses of ∼ 60M⊙ for the majority of cluster members that have yet to reach the H-free WR phase (≥ 38 stars; Sect. 4.2), with that cohort presumably evolving from more massive stars still. While the vast majority of cluster members appear entirely co-eval, a handful of objects potentially challenge this conclusion for the Quintuplet as a whole. The five mid-late O hypergiants and WN8-9ha stars look somewhat younger, their appearance being consistent with membership of the 23Myr old Arches cluster. Potential explanations for this discrepancy include the effect of rapid rotation, possibly induced by mass-accretion in an interacting binary, or binary-driven massstripping (cf. Wd1-5; Clark et al. 2014a). This would be consistent with the predictions of e.g. van Bever & Vanbeveren (1998) and Schneider et al. (2014) that binary products should be present within the Quintuplet. We also identify a small population of underluminous O9-B0 Ia stars which appear to represent an older population of lower initial masses (potentially also revealed by the RSG LHO7). Given the dense stellar environment of the CMZ, we cannot at present distinguish between the Quintuplet being non-coeval or the chance superposition of interlopers - whether a coherent physical aggregate or isolated field stars - along the cluster sight line. A combination of proper-motion and radial-velocity data would help discriminate between these possibilities. Nevertheless, the combination of the age and mass of the Quintuplet presents unique opportunities. No other cluster is so
richly populated by the closely related BHGs, LBVs, and WN911h stars which, as a consequence of their quiescent and impulsive mass loss rates, appear pivotal to massive stellar evolution. Recently, it has been suggested that such stars form via binary interaction and as a result of either dynamical ejection or SNe kicks are preferentially found in isolation rather than in clusters (Smith & Tombleson 2015). Rosslowe & Crowther (2018) have already challenged the ideas that LBVs are more isolated than other massive stars such as WRs and are not located in clusters. The results presented here are further in tension with Smith & Tombleson (2015); in the Quintuplet the LBVs and WN9-11h stars form a smooth evolutionary sequence with the less evolved OB supergiants and B hypergiants (cf. Fig. 1 and Sect. 4.2), with no suggestion that binarity mediates this procession. If present, mass-gaining binary products appear more likely to be found amongst the handful of O hypergiants (and their close spectral relatives the WN8-9ha stars), for which progenitor stars have not been identified. And while the dusty WC9 stars could represent stripped primaries in interacting binaries, none show evidence of an LBV secondary (nor the LBVs/WN9-11h stars a WR companion). The H-free WR population of the Quintuplet is also of particular interest. Prior to this phase the single-star 60M⊙ evolutionary channel (Ekstr¨om et al. 2012, Gr14) provides an excellent fit to observations: O7-O8 Ia → O9-B0 Ia → B0-3 Ia+ → LBV ↔ WN9h-11h However as detailed in Sect. 5.2 it appears likely that observations diverge from theory after this point in three distinct ways: the presence of uniformly late WR spectral sub-types; the extreme ratio (13:1) of H-free WC stars relative to WN (discussed by e.g. Li09, Liermann et al. 2012); the fact that the current mass inferred for the WC9 primary of LHO19 appears unexpectedly low (cf. Groh et al. 2013). A number of nonexclusive solutions suggest themselves, including observational limitations/bias, the effect of a possible non-solar metallicity in the CMZ and potential deficiencies in the single-star evolutionary physics adopted, such as the treatment of mass-loss and its prevalence in comparison to a binary channel. In relation to the final suggestion, the presence of hot dust associated with a minimum of eight WC stars is indicative of a very high binary fraction amongst this cohort, emphasising the potential role of binary interaction in the production of the WCL stars (cf. Schneider et al. 2014), although in isolation it would appear unable to explain the absence of the WCE stars predicted by the single star evolutionary channel. What are the future prospects for exploiting the potential of the Quintuplet? In observational terms a multi-epoch RV spectroscopic survey of cluster members to determine the binary fraction of the cluster - and hence the applicability of singlestar evolutionary predictions - appears essential. Summation of multiple spectra (cf. Clark et al. 2018) would also allow classification of fainter cluster members such as main sequence objects and, if present, intrinsically fainter WR stars such as the WO subtype predicted to immediately precede core-collapse. In conjunction with this, individually tailored quantitative non-LTE model-atmosphere analysis of cluster members would allow the construction of an HR diagram, from which a cluster age could be inferred. This would also serve to calibrate the cluster (I)MF, from which a cluster mass and density could be determined, as well as the integrated radiative and mechanical feedback into the CMZ from the Quintuplet. Most importantly, such efforts would help refine the input physics of stellar evolu21
J. S. Clark et al.: An updated stellar census of the Quintuplet cluster
tion codes (the results of which are utilised in cluster spectralsynthesis codes such as Starburst99) and constrain the influence of binarity and the properties of the final pre-SN stellar endpoint. In particular we highlight the importance of these goals in understanding the formation of the coalescing high mass black hole binaries identified via gravitational wave observations. With an age of 3-3.6Myr we would expect the most massive stars (≥ 85M⊙ ) within the Quintuplet to be undergoing SNe at this time, which implies that their immediate progenitors should also be present. Groh et al. (2013) suggest these progenitors should have core-masses of 18.5 − 30.7M⊙ and yet the mass of the WC9 primary of LHO19 is already substantially lower at ∼ 10−12M⊙. If the remaining population of WCL stars within the Quintuplet are also of comparably low mass, it would raise important questions. If stars of ≥ 85M⊙ are unable to form black holes with masses substantially in excess of 10M⊙ , how massive must their progenitors be? Do they need to form via a different mechanism (e.g. chemically homogeneous evolution; de Mink et al. 2009)? Is their formation even possible in the local, high metallicity Universe? Acknowledgements. Based on observations collected at the European Organisation for Astronomical Research in the Southern Hemisphere under ESO programmes 077.D-0281 and 093.D-0306. This research was supported by the Science and Technology Facilities Council. FN acknowledges financial support through Spanish grants ESP2015-65597-C4-1-R and ESP2017-86582C4-1-R (MINECO/FEDER). We thank Chris Evans for his invaluable support in preparing for the KMOS observations, and Jose Groh for informative discussions.
References Barnes, A. T., Longmore, S. N., Battersby, C. et al. 2017, MNRAS, 469, 2263 Bibby, J.L., Crowther, P. A., Furness, J. P. & Clark, J. S. 2008, MNRAS, 386, L23 Borgmann, J., Koornneef, J. & Slingerland, J. 1970, A&A, 4, 248 Cardelli, J. A., Clayton, G. C. & Mathis, J. S. 1989, ApJ, 345, 245 Clark, J. S., Steele, I. A., Fender, R. P. & Coe, M. J. 1999, A&A, 348, 888 Clark, J. S., Egan, M. P., Crowther, P. A. et al. 2003, A&A, 412, 185 Clark, J. S. & Porter, J. M. 2004, A&A, 427, 839 Clark, J. S., Negueruela, I., Crowther, P. A. & Goodwin, S. P. 2005a, A&A, 434, 949 Clark, J. S., Larionov, V. M. & Arkharov, A. 2005b, A&A, 435, 239 Clark, J. S., Muno, M. P., Negueruela, I. et al. 2008, A&A, 477, 147 Clark, J. S., Davies, B., Najarro, F. et al. 2009a, A&A, 504, 429 Clark, J. S., Crowther, P. A., Larionov, V. M. et al. 2009b, A&A, 507, 1555 Clark, J. S., Arkharov, A., Larionov, V. et al. 2011, BSRSL, 80, 361 Clark, J. S., Najarro, F., Negueruela, I. et al. 2012, A&A, 541, A145 Clark, J. S., Bartlett, E. S., Coe, M. J. et al. 2013a, A&A, 560, A10 Clark, J. S., Ritchie, B. W. & Negueruela, I. 2013b, A&A, 560, A11 Clark, J. S., Negueruela, I. & Gonz´alez-Fern´andez, C. 2014a, A&A, 561, A15 Clark, J. S., Ritchie, B. W., Najarro, F., Langer, N. & Negueruela, I. 2014b, A&A, 567, A73 Clark, J. S., Lohr, M. E., Najarro, F., Dong, H. & Martins, F. 2018, A&A, in press [arXiv:1803.09567] Conti, P. S. & Vacca, W. D. 1990, AJ, 100, 2 Cotera, A. S., Erickson, E. F., Colgan, S. W. J. et al. 1996, ApJ, 461, 750 Crowther, P. A., Hadfield, L. J., Clark, J. S., Negueruela, I. & Vacca, W. D. 2006, MNRAS, 372, 1407 Crowther, P. A. 2007, ARA&A, 45, 177 Crowther, P. A. & Walborn, N. R. 2011, MNRAS, 416, 1311 Davies, B., Figer, D. F., Kudritzki, R.-P. et al. 2007, ApJ, 671, 781 Davies, B., Clark, J. S., Trombley, C. et al. 2012, MNRAS, 419, 1871 Davies, R. I., Agudo Berbel, A., Wiezorrek, E., et al. 2013, A&A, 558, A56 de la Fuente, Najaro, F., Borissova, J. et al. 2016, A&A, 589, A69 de Mink, S. E., Cantiello, M., Langer, N. et al. 2009, A&A, 497, 243 de Mink, S. E., Langer, N., Izzard, R. G., Sana, H. & de Koter, A. 2013, ApJ, 764, 166 de Mink, S. E., Sana, H., Langer, N., Izzard, R. G. & Schneider, F. R N. 2014, ApJ, 782, 7 De Pree, C. G., Goss, W. M. & Gaume, R. A. 1998, ApJ, 500, 847 Dong, H., Wang, Q. D., Cotera, A. et al. 2011, MNRAS, 417, 114 Dong, H., Wang, Q. D. & Morris, M. R. 2012, MNRAS, 425, 884
22
Dong, H., Mauerhan, J., Morris, M. R., Wang, Q. D. & Cotera, A. 2015, MNRAS, 446, 842 Dong, H., Sch¨odel, R., Williams, B. F. et al. 2017, MNRAS, 470, 3427 Dufton, P. L., Langer, N., Dunstall, P. R. et al. 2013, A&A, 550, A109 Egan, M. P., Clark, J. S., Mizuno, D. R. et al. 2002, ApJ, 572, 288 Eikenberry, S. S., Matthews, K., LaVine, J. L. et al. 2004, ApJ, 616, 506 Ekstr¨om, s., Georgy, C., Eggenberger, P. et al. 2012, A&A, 537, A146 Espinoza, P., Selman, F. J. & Melnick, J. 2009, A&A, 501, 563 Feldmeier-Krause, A., Neumayer, N., Schodel, R. et al. 2015, A&A, 584, A2 Fenech, D. M., Clark, J. S., Prinja, R. K. et al. 2017, MNRAS, 464, L75 Figer, D. F., McLean, I. S. & Morris, M. 1995, ApJ, 447, L29 Figer, D. F., Morris, M. & McLean, I. S. 1996, ASPC, 102, 263 Figer, D. F., McLean, I. S. & Najarro, F. 1997, ApJ, 486, 420 Figer, D. F., Najarro, F., Morris, M. et al. 1998, ApJ, 506, 384 Figer, D. F., McLean, I. S. & Morris, M. 1999a, ApJ, 514, 202 (Fi99a) Figer, D. F., Kim, S. S., Morris, M., et al. 1999b, ApJ, 525, 750 Figer, D. F., Najarro, F., Geballe, T. R., Blum, R. D., Kudritzki, R. P. 2005, ApJ, 622, L49 Geballe, T. R., Genzel, R., Krabbe, A., Krenz, T., & Lutz, D. 1994, in Infrared Astronomy with Arrays, ed. I. S. McLean (Dordrecht: Kluwer), 73 Geballe, T. R., Najarro, F. & Figer, D. F. 2000, ApJ, 530, L97 Glass, I. S., Moneti, A. & Moorwood, A. F. M. 1990, MNRAS, 242, L55 Glass, I. S., Matsumoto, S., Carter, B. S. & Sekiguchi, K. 1999, MNRAS, 304, L10 Groh, J., Hillier D. J., Damineli A., et al. 2009, ApJ, 698, 1698 Groh, J. H., Meynet, G., Georgy, C. & Ekstr¨om, S. 2013, A&A, 558, A131 Groh, J. H., Meynet, G., Ekstr´om, S. & Georgy, C. 2014, A&A, 564, A30 Hadfield, L. J. & Crowther, P. A. 2007, MNRAS, 381, 418 Hanson, M. M., Conti, P. S. & Rieke, M. J. 1996, ApJS, 107, 281 Hanson, M. M., Kudritzki, R.-P., Kenworthy, M. A., Puls, J. & Tokunaga, A. T. 2005, ApJS, 161, 154 Hillier, D. J. & Miller, D. L. 1998, ApJ, 496, 407 Hillier, D. J. & Miller, D. L. 1999, ApJ, 519, 354 Hillier, D. J., Davidson, K., Ishibashi, K. & Gull, T. 2001, ApJ, 553, 837 Hosek, M. W., Lu, J. R., Anderson, J. et al. 2018, ApJ, submitted Hur, H., Park, B., Sung, H. et al. 2015, MNRAS, 446, 3797 Kaper, L., van der Meer, A. & Najarro, F. 2006, A&A, 457, 595 Kastner, J. H., Buchanan, C., Sahai, R., Forrest, W. J. & Sargent, B. A., 2010, AJ, 139, 1993 Kauffmann, J. 2017, in Proceedings of the Star Formation in Different Environments, ICISE, Quy Nhon, Vietnam, 2016, (eds. D. Johnstone, T. Hoang, F. Nakamura, Q. Nguyen-Luong, and J. T. Tranh Van) Kim, S. S., Figer, D. F., Kudritzki, R. P. & Najarro, F. 2006, ApJ, 653, L113 Lang, C. C., Johnson, K. E., Goss, W. M. & Rodr´ıguez, L. F 2005, AJ, 130, 2185 Langer, N. 1989, A&A, 210, 93 Lau, R. M., Herter, T. L., Morris, M. R. & Adams, J. D. 2014, ApJ, 785, 120 Liermann, A., Hamann, W.-R. & Oskinova, L. M. 2009, A&A, 494, 1137 (Li09) Liermann, A., Hamann, W.-R., Oskinova, L. M., Todt, H. & Butler, K. 2010, A&A, 524, A82 Liermann, A., Hamann, W.-R. & Oskinova, L. M. 2012, 540, A14 Liermann, A., Schnurr, O., Kraus, M. et al. 2014, MNRAS, 443, 947 Linder, N., Rauw, G., Manford, J, et al. 2009, A&A, 495, 231 Lohr, M. E., Clark, J. S., Najarro, F., et al. 2018, A&A, in press [arXiv:1804.05607] Longmore, S. N., Rathborne, J., Bastian, N. et al. 2012, ApJ, 746, 117 Martins, F. & Plez, B. 2006a, A&A, 457, 637 Martins, F., Trippe, S., Paumard, T. et al. 2006, ApJ, 649, L103 Martins, F., Genzel, R., Hillier, D. J., et al. 2007 A&A, 468, 233 Martins, F., Hillier, D. J., Paumard, T. et al. 2008, A&A, 478, 219 Martins, F. & Palacios, A. 2017, A&A, 598, A56 Massey, P., DeGioia-Eastwood & Waterhouse, E. 2001, AJ, 121, 1050 Mauerhan, J. C.,Muno, M. P., Morris, M. R., Stolovy, S. R. & Cotera, A. 2010a, ApJ, 710, 706 Mauerhan, J. C., Morris, M. R., Cotera, A., et al. 2010b, ApJ, 713, L33 Mauerhan, J. C., Cotera, A., Dong, H. et al. 2010c, ApJ, 725, 188 Mauerhan, J. C., Cotera, A., Dong, H. et al. 2015, ApJ, 811, 158 Messineo, M., Davies, B., F., Ivanov, V. D., et al. 2009, ApJ, 697, 701 Messineo, M., Davies, B., Figer, D. F. et al. 2011, ApJ, 733, 41 Moneti, A., Glass, I. S.& Moorwood, A. F. M. 1992, MNRAS, 258, 705 Moneti, A., Glass, I. S.& Moorwood, A. F. M. 1994, MNRAS, 268, 194 Moneti, A., Stolovy, S., Blommaert, J. A. D. L., Figer, D. F., Najarro, F. 2001, A&A, 366, 106 Morris, M., & Serabyn, E. 1996, ARA&A, 34, 645 Morris, P. W., Eenens, P. R. J., Hanson, M. M., Conti, P. S. & Blum, R. D. 1996, ApJ, 470, 597 Muno, M. P., Bauer, F. E., Baganoff, F. K. et al. 2009, ApJS, 181, 110 Nagata, T., Woodward, C. E., Shure, M., Pipher, J. L. & Okuda, H. 1990, ApJ, 351, 83
J. S. Clark et al.: An updated stellar census of the Quintuplet cluster Najarro, F. 2001, P Cygni 2000: 400 Years of Progress, ASPC, 233, 133 Najarro, F., Figer, D. F., Hillier, D. J., Geballe, T. R., & Kudritzki, R. P. 2009, ApJ, 691, 1816 Najarro, F., de la Fuente, D., Geballe, T. R., Figer, D. F. & Hillier, D. J. 2015, IAUS, 307, 426 Najarro, F., Geballe, T. R., Figer, D. F. & de la Fuente, D. 2017, ApJ, 845, 127 Naz´e, Y., Rauw, G. & Hutsem´ekers, D. 2012, A&A, 538, A47 Negueruela, I., Clark, J. S. & Ritchie, B. W. 2010, A&A, 516, A78 Nishiyama, S., Nagata, T., Kusakabe, N. et al. 2006, ApJ, 638, 839 North, J. R., Tuthill, P. G., Tango, W. J. & Davis, J. 2007, MNRAS, 377, 415 Oksala, M. E., Kraus, M., Cidale, L. S., Muratore, M. F. & Borges Fernandes, M. 2013, A&A, 558, A17 Okuda, H., Shibai, H., Nakagawa, T. et al. 1990, ApJ, 351, 89 Patrick, L. R., Evans, C. J., Davies, B. et al. 2015, ApJ, 803, 14 Patrick, L. R., Evans, C. J., Davies, B. et al. 2017, ApJ, 468, 492 Paumard, T., Genzel, R., Martins, F et al. 2006, ApJ, 643, 1011 Peeples, M. S., Bonanos, A. Z., DePoy, D. L., et al. 2007, ApJ, 654, L61 Pecaut, M. J. & Mamajek, E. E. 2013, ApJS, 208, 9 Ram´ırez-Agudelo, O. H., Sim´on-D´ıaz, S., Sana, H. et al. 2013, A&A, 560, A29 Ritchie, B. W., Clark, J. S., Negueruela, I. & Langer, N. 2010, A&A, 520, A48 Rosslowe, C. K. & Crowther, P. A. 2018, MNRAS, 473, 2853 Sana, H., de Mink, S. E., de Koter, A., et al., 2012, Science, 337, 444 Sana, H., de Koter, A., de Mink, S. E., et al. 2013 A&A, 550, A107 Sander, A., Hamann, W.-R. & Todt, H. 2012, A&A, 540, A144 Schneider, F. R. N., Izzard, R. G., de Mink, S. E., et al. 2014, ApJ, 780, 117 Serabyn, E., Shupe, D. & Figer, D. F. 1998, Nature, 394, 448 Sharples, R., Bender, R. & Agudo Berbel, A., et al. 2013, Messenger, 151, 21 Smith, N. & Tombleson, R. 2015, MNRAS, 447, 598 Steinke, M., Oskinova, L. M., Hamann, W.-R. et al. 2016, A&A, 588, A9 Stroud, V. E., Clark, J. S., Negueruela, I. et al. 2010, A&A, 511, A84 Trippe, S., Martins, F., Ott, T. et al. 2006, A&A, 448, 305 Tuthill, P., Monnier, J., Tanner, A., et al. 2006, Science, 313, 935 Ueta, T., Meixner, M., Dayal, A. et al. 2001, ApJ, 548, 1020 van Bever, J. & Vanbeveren, D. 1998, A&A, 334, 21 Waisberg, I., Dexter, J. Pfuhl, O. et al. 2017, ApJ, 844, 72 Wang, Q., D., Dong, H. & Lang, C. 2006, MNRAS, 371, 38 Weidner, C. & Vink, J. S. 2010, A&A, 524, A98 Westerlund, B. E. 1987, A&AS, 70, 311 Yamamuro, T., Nishimaki, Y., Motohara, K., Miyata, T. & Tanaka, M. 2007, PASJ, 59, 973
Appendix A: Additional spectra and HST photometry
23
J. S. Clark et al.: An updated stellar census of the Quintuplet cluster Table A.1. The stellar population of the Quintuplet cluster
qF # 134 151 157 211 231 235S 235N 240 241 243 250 251 256 257 258 270S 274 276 278 307A 309 320 344 353E 358 381 406 -
24
ID LHO # 019 042 034 047 067 071 075 079 084 099 096 102 110 077 146 158 001 002 003 005 009 010 011 013 015 016 017 018 024 026 028 029 031 032 033 035 037 039 041 044 045 046 048 050 051 054 055 056 058 059 060 061 062 064 065
RA
Dec
266.56352 266.55717 266.55780 266.56612 266.56129 266.56321 266.56315 266.56642 266.56299 266.55890 266.56417 266.56165 266.56895 266.56310 266.55967 266.56291 266.57305 266.55593 266.56301 266.56450 266.57294 266.55855 266.56948 266.54639 266.56899 266.55605 266.55772 266.56972 266.56656 266.56560 266.56307 266.56380 266.56320 266.56845 266.56933 266.56406 266.56358 266.56541 266.56497 266.56709 266.56287 266.56372 266.56139 266.56325 266.56574 266.56921 266.56223 266.55973 266.56021 266.56601 266.56231 266.55875 266.56347 266.56281 266.56788 266.56575 266.56035 266.56547 266.56258 266.56342 266.56417 266.55915 266.55987 266.56912 266.56503 266.56232
-28.83425 -28.82204 -28.83302 -28.82927 -28.82794 -28.82820 -28.82760 -28.82713 -28.82693 -28.82682 -28.82623 -28.82616 -28.82546 -28.82567 -28.82537 -28.82480 -28.82467 -28.82473 -28.82630 -28.82226 -28.82181 -28.82123 -28.81921 -28.81829 -28.81799 -28.81641 -28.81403 -28.83089 -28.83082 -28.83082 -28.83075 -28.83027 -28.82992 -28.82989 -28.82966 -28.82963 -28.82955 -28.82941 -28.82931 -28.82911 -28.82899 -28.82879 -28.82862 -28.82857 -28.82856 -28.82847 -28.82820 -28.82814 -28.82797 -28.82800 -28.82785 -28.82789 -28.82783 -28.82768 -28.82760 -28.82755 -28.82745 -28.82747 -28.82740 -28.82730 -28.82728 -28.82728 -28.82718 -28.82720 -28.82712 -28.82712
mF110W (mag) 12.69±0.06 16.67±0.08 15.36±0.04 14.63±0.06 17.00±0.06 17.07±0.06 15.05±0.10 14.33±0.08 16.80±0.05 16.15±0.14 15.94±0.05 15.43±0.05 15.02±0.07 18.96±0.08 14.90±0.05 15.88±0.07 16.07±0.09 15.31±0.09 14.47±0.05 17.24±0.07 16.35±0.11 17.31±0.07 16.48±0.08 15.53±0.08 18.94±0.08 18.27±0.07 17.92±0.08 14.94±0.07 20.10±0.06 18.69±0.05 19.01±0.07 20.42±0.13 17.08±0.05 18.28±0.06 19.74±0.08 17.86±0.09 18.17±0.09 17.69±0.09 15.20±0.08 17.22±0.07 18.57±0.07 17.74±0.08 18.69±0.08 20.55±0.07 17.67±0.05 17.89±0.07 16.89±0.05 21.85±0.09 15.90±0.06 17.89±0.07 17.72±0.06 17.02±0.12 17.31±0.07 17.65±0.10 18.16±0.07 18.68±0.09 18.71±0.07 22.48±0.21 21.47±0.12 19.33±0.08 18.43±0.09 18.88±0.05
mF160W (mag) 9.34±0.04 12.97±0.05 13.58±0.05 10.52±0.04 9.67±0.03 13.50±0.05 13.54±0.04 11.39±0.07 10.84±0.05 11.48±0.05 12.13±0.09 11.13±0.05 12.13±0.05 11.56±0.05 13.55±0.04 11.44±0.06 12.43±0.05 12.56±0.07 11.85±0.05 11.05±0.05 13.60±0.05 12.66±0.04 13.26±0.04 12.45±0.05 12.13±0.07 15.70±0.04 14.79±0.06 14.36±0.05 14.20±0.05 16.29±0.04 15.41±0.03 15.64±0.05 16.66±0.04 13.77±0.05 14.71±0.04 15.99±0.03 14.57±0.05 14.58±0.05 14.19±0.05 11.80±0.05 13.88±0.06 15.21±0.04 14.41±0.04 15.20±0.05 16.60±0.05 14.18±0.04 14.49±0.06 13.24±0.14 17.59±0.05 12.61±0.04 14.43±0.04 14.42±0.05 13.47±0.12 13.73±0.06 14.13±0.04 14.72±0.04 15.12±0.04 15.42±0.03 17.82±0.06 17.27±0.04 16.07±0.03 15.09±0.04 15.36±0.04
mF205W (mag) 7.74±0.02 11.27±0.02 11.85±0.02 7.57±0.05 6.80±0.04 11.73±0.02 11.74±0.02 9.70±0.02 9.21±0.03 8.33±0.02 9.95±0.06 8.27±0.02 10.57±0.01 9.90±0.02 9.78±0.02 9.86±0.05 10.90±0.02 10.97±0.02 10.21±0.01 9.46±0.02 11.74±0.02 10.82±0.03 11.47±0.02 10.53±0.01 10.61±0.03 14.27±0.02 13.44±0.03 12.87±0.02 13.95±0.03 14.67±0.01 14.14±0.04 14.34±0.03 15.01±0.01 12.26±0.02 13.11±0.02 14.38±0.01 13.11±0.02 13.13±0.03 12.69±0.02 10.29±0.02 12.38±0.02 13.68±0.02 13.09±0.02 13.72±0.02 14.99±0.02 12.64±0.01 12.96±0.02 11.98±0.02 15.61±0.06 11.18±0.02 12.96±0.02 13.00±0.01 12.17±0.08 12.07±0.01 12.57±0.03 13.17±0.35 13.61±0.01 13.97±0.02 15.69±0.06 15.58±0.02 14.70±0.02 13.52±0.03 13.81±0.01
mF127M (mag) 11.79±0.01 15.55±0.01 16.62±0.03 14.53±0.01 14.33±0.01 15.92±0.01 16.06±0.01 13.90±0.01 13.18±0.01 15.92±0.01 15.34±0.01 15.12±0.01 14.31±0.01 13.99±0.01 17.90±0.02 13.87±0.01 14.83±0.01 15.02±0.01 14.26±0.01 13.43±0.01 16.17±0.01 15.18±0.01 16.29±0.01 16.03±0.01 15.43±0.01 14.41±0.01 15.56±0.01 14.51±0.01 17.85±0.02 17.17±0.02 16.71±0.01 14.56±0.01 18.82±0.02 17.76±0.02 18.05±0.02 19.69±0.04 16.00±0.01 17.27±0.02 18.55±0.02 16.72±0.02 17.05±0.02 16.58±0.01 14.16±0.01 16.24±0.01 17.48±0.02 16.65±0.01 17.73±0.02 19.50±0.03 16.60±0.01 16.83±0.02 16.00±0.01 20.83±0.06 14.88±0.01 16.70±0.02 16.67±0.01 16.23±0.01 16.19±0.01 16.49±0.01 16.97±0.02 17.50±0.02 17.63±0.02 21.88±0.12 20.31±0.06 18.28±0.02 17.36±0.02 17.69±0.02
mF139M (mag) 10.84±0.01 14.40±0.01 15.35±0.02 13.03±0.01 12.82±0.01 14.99±0.02 14.85±0.02 12.84±0.01 12.16±0.01 14.29±0.01 14.07±0.01 13.57±0.01 13.37±0.01 12.93±0.01 16.17±0.02 12.84±0.01 13.85±0.01 13.97±0.01 13.18±0.01 12.40±0.01 14.97±0.02 14.16±0.01 15.03±0.02 15.11±0.02 14.16±0.01 13.30±0.01 14.45±0.01 13.52±0.01 16.90±0.02 16.17±0.02 15.69±0.02 14.40±0.01 17.70±0.02 16.81±0.02 17.05±0.02 18.45±0.04 15.02±0.02 16.21±0.02 17.44±0.02 15.77±0.02 16.00±0.02 15.58±0.02 13.13±0.01 15.23±0.02 16.49±0.02 15.68±0.02 16.67±0.02 18.30±0.03 15.58±0.02 15.81±0.02 14.73±0.02 19.53±0.06 13.87±0.01 15.72±0.02 15.71±0.02 15.15±0.02 15.13±0.02 15.47±0.02 15.95±0.02 16.46±0.02 16.68±0.02 20.31±0.11 19.00±0.06 17.34±0.02 16.36±0.02 16.65±0.02
mF153 (mag) 13.38±0.01 14.06±0.02 11.46±0.01 11.20±0.01 13.95±0.01 14.13±0.02 11.82±0.01 11.11±0.01 12.57±0.01 12.78±0.01 12.04±0.01 12.45±0.01 11.91±0.01 14.25±0.01 11.88±0.01 12.86±0.01 12.97±0.01 12.21±0.01 11.42±0.01 14.24±0.01 13.06±0.01 13.80±0.01 14.12±0.01 12.93±0.01 12.26±0.01 13.40±0.01 12.51±0.01 15.97±0.02 15.22±0.02 14.72±0.01 14.21±0.01 16.59±0.02 15.93±0.02 16.08±0.02 17.26±0.03 14.09±0.01 15.15±0.02 16.38±0.02 14.84±0.02 15.02±0.02 14.57±0.01 12.13±0.01 14.25±0.01 15.55±0.02 14.75±0.01 15.65±0.02 17.14±0.03 14.59±0.01 14.83±0.02 13.95±0.01 18.25±0.05 12.96±0.01 14.75±0.02 14.78±0.01 14.17±0.01 14.10±0.01 14.47±0.01 14.95±0.02 15.47±0.02 15.75±0.02 18.84±0.08 17.76±0.04 16.45±0.02 15.38±0.01 15.64±0.02
J. S. Clark et al.: An updated stellar census of the Quintuplet cluster Table A.1. continued. qF # -
ID LHO # 069 072 073 074 076 081 088 089 090 092 094 097 100 101 103 104 105 106 107 109 111 118 120 122 125 126 128 130 132 134 139 141 143 144 145 148 149 152 154 157 159
WR 102ca
RA
Dec
266.55962 266.56381 266.56225 266.56050 266.55893 266.56660 266.55964 266.56262 266.56210 266.56958 266.56563 266.56960 266.56323 266.56276 266.55910 266.56808 266.56501 266.56797 266.56697 266.56243 266.56241 266.56692 266.56913 266.55933 266.56038 266.56899 266.56082 266.56847 266.56011 266.56366 266.56919 266.56245 266.56675 266.56388 266.56671 266.56274 266.55838 266.56696 266.56184 266.56690 266.56638 266.55436
-28.82698 -28.82683 -28.82683 -28.82679 -28.82645 -28.82617 -28.82601 -28.82588 -28.82590 -28.82580 -28.82573 -28.82561 -28.82538 -28.82538 -28.82539 -28.82536 -28.82529 -28.82513 -28.82505 -28.82487 -28.82468 -28.82426 -28.82426 -28.82406 -28.82397 -28.82400 -28.82383 -28.82364 -28.82348 -28.82345 -28.82307 -28.82290 -28.82261 -28.82237 -28.82239 -28.82188 -28.82178 -28.82158 -28.82148 -28.82138 -28.82125
mF110W (mag) 17.59±0.08 17.58±0.19 16.67±0.07 17.25±0.07 19.14±0.07 18.99±0.09 16.70±0.05 15.96±0.08 19.35±0.06 19.06±0.09 19.62±0.04 14.98±0.10 18.33±0.08 18.28±0.07 19.29±0.05 18.49±0.07 17.91±0.06 19.68±0.06 18.30±0.10 17.60±0.12 17.27±0.06 20.01±0.08 17.43±0.06 19.67±0.10 18.28±0.06 18.66±0.06 15.45±0.06 18.75±0.06 18.82±0.07 21.22±0.11 17.59±0.05 16.25±0.10 17.54±0.08 18.36±0.07 17.35±0.06 17.54±0.24 20.34±0.08 18.65±0.08 21.80±0.10 19.94±0.08
mF160W (mag) 13.80±0.06 14.12±0.12 12.98±0.05 13.20±0.05 15.41±0.04 15.42±0.05 13.21±0.04 12.45±0.05 16.03±0.04 15.42±0.05 16.32±0.04 11.43±0.05 14.76±0.03 14.84±0.05 15.80±0.05 15.01±0.05 14.55±0.05 15.97±0.05 14.86±0.04 14.07±0.04 13.56±0.05 16.39±0.04 13.92±0.06 15.95±0.11 14.67±0.04 15.35±0.07 14.83±0.07 15.15±0.03 15.13±0.05 15.99±0.04 14.08±0.05 12.56±0.05 14.10±0.05 14.79±0.03 13.83±0.05 13.61±0.17 16.36±0.05 14.88±0.05 17.04±0.04 16.07±0.04
mF205W (mag) 12.07±0.02 12.92±0.02 12.34±0.04 11.35±0.02 10.88±0.01 13.90±0.02 13.88±0.02 11.59±0.01 10.82±0.02 14.59±0.01 13.95±0.03 14.87±0.01 9.91±0.02 13.12±0.03 13.28±0.02 14.34±0.03 13.57±0.03 13.06±0.02 14.35±0.01 13.32±0.02 12.46±0.03 11.91±0.01 14.76±0.01 12.33±0.02 14.51±0.11 13.02±0.01 13.79±0.03 14.50±0.03 13.53±0.02 13.58±0.01 13.73±0.03 12.54±0.03 10.86±0.01 12.62±0.02 13.18±0.03 12.25±0.02 12.36±0.11 14.51±0.02 13.30±0.02 14.90±0.02 14.31±0.02
mF127M (mag) 16.38±0.01 16.52±0.01 16.43±0.01 15.65±0.01 16.14±0.01 17.88±0.02 17.86±0.01 15.84±0.01 14.86±0.01 18.18±0.02 17.86±0.02 18.59±0.02 14.14±0.01 17.30±0.02 17.16±0.02 18.24±0.02 17.37±0.02 16.93±0.02 18.56±0.02 17.15±0.02 16.40±0.01 16.29±0.01 18.92±0.02 16.34±0.01 18.59±0.02 17.22±0.02 17.64±0.02 15.05±0.01 17.77±0.01 17.66±0.02 18.51±0.02 16.48±0.01 15.07±0.01 16.44±0.01 17.34±0.02 16.25±0.01 16.62±0.01 19.16±0.02 17.41±0.01 21.20±0.05 18.83±0.02
mF139M (mag) 15.26±0.02 15.55±0.02 15.37±0.02 14.55±0.02 14.81±0.02 16.83±0.02 16.83±0.02 14.78±0.02 13.85±0.01 17.23±0.02 16.83±0.02 17.61±0.02 13.05±0.01 16.23±0.02 16.16±0.02 17.21±0.02 16.35±0.02 15.92±0.02 17.43±0.02 16.17±0.02 15.39±0.02 15.12±0.02 17.83±0.02 15.28±0.02 17.56±0.02 16.14±0.02 16.61±0.02 14.93±0.02 16.68±0.02 16.61±0.02 17.36±0.02 15.47±0.02 13.99±0.01 15.45±0.02 16.29±0.02 15.15±0.02 15.50±0.02 17.92±0.02 16.32±0.01 19.58±0.05 17.66±0.02
mF153 (mag) 14.19±0.01 14.56±0.01 14.32±0.01 13.40±0.01 13.83±0.01 15.81±0.02 15.82±0.02 13.72±0.01 12.84±0.01 16.32±0.02 15.82±0.02 16.68±0.02 12.01±0.01 15.17±0.02 15.19±0.02 16.21±0.02 15.35±0.02 14.92±0.02 16.37±0.02 15.20±0.02 14.38±0.02 13.97±0.01 16.77±0.02 14.27±0.01 16.57±0.02 15.05±0.02 15.64±0.02 14.74±0.01 15.59±0.02 15.58±0.02 16.25±0.02 14.44±0.01 12.94±0.01 14.49±0.01 15.25±0.02 14.17±0.01 14.49±0.01 16.75±0.02 15.27±0.02 17.91±0.03 16.51±0.02
-28.82363
17.07±0.08
13.16±0.07
10.90±0.01
16.14±0.01
14.84±0.02
13.90±0.01
Objects for which no photometry is available are qF76 (WC9; this work), qF269 (OB I; Fi99a), qF301 (