Department of Civil & Coastal Engineering. College of Engineering ... are suitable and effective for performing creep tests on Florida concretes, and (2) to ...
FINAL REPORT
U.F. Project No. 49104504973-12 RPWO#: 85 Contract No: BC-354
MODULUS OF ELASTICITY, CREEP AND SHRINKAGE OF CONCRETE Mang Tia Yanjun Liu Danny Brown May 2005
Department of Civil & Coastal Engineering College of Engineering University of Florida Gainesville, Florida
DISCLAIMER The opinions, findings and conclusions expressed in this publication are those of the authors and not necessarily those of the Florida Department of Transportation
or
the
U.S.
Department
of
Transportation.
Prepared in cooperation with the State of Florida Department of Transportation and the U.S. Department of Transportation.
Technical Report Documentation Page 1. Report No.
2. Government Accession No.
3. Recipient's Catalog No.
4. Title and Subtitle
5. Report Date
Modulus of Elasticity, Creep and Shrinkage of Concrete
April 2005 6. Performing Organization Code
7. Author(s)
8. Performing Organization Report No.
Mang Tia, Yanjun Liu & Danny Brown
49104504973-12
9. Performing Organization Name and Address
10. Work Unit No. (TRAIS)
Department of Civil & Coastal Engineering, P.O. Box 116580, University of Florida, Gainesville, Florida 32611
11. Contract or Grant No.
BC 354-85 12. Sponsoring Agency Name and Address
13. Type of Report and Period Covered
Final Report January 2003 – March 2005
Florida Department of Transportation 605 Suwannee St. MS 30 Tallahassee, Florida 32399 (850)414-4615
14. Sponsoring Agency Code
15. Supplementary Notes
Prepared in cooperation with the USDOT and FHWA 16. Abstract
At present, the modulus of elasticity, creep and shrinkage properties of concrete that are used in structural design in Florida are based on the arbitrary available literature or based on the limited research of the locally available material. There is a great need for a comprehensive testing and evaluation of locally available concrete mixes to determine these mechanical and physical properties of Florida normal-weight as well as lightweight concretes, so that correct values for these properties can be used in structural designs. The main objectives of this study are (1) to design, evaluate and construct creep test apparatuses that are suitable and effective for performing creep tests on Florida concretes, and (2) to evaluate the compressive strength, indirect tensile strength, elastic modulus, drying shrinkage and creep characteristics of typical Florida Class II, IV, V and VI concrete mixes made with normal-weight and lightweight aggregates. A creep test apparatus was designed, and twelve creep test apparatuses were constructed and set up in the laboratory for use in performing the creep tests in this study. The creep test apparatus was evaluated to be working satisfactorily. An effective procedure for the creep test using this apparatus was developed and documented. This study has generated valuable data and determined general trends on the compressive strength, splitting tensile strength, elastic modulus, drying shrinkage strains and creep coefficient of typical Florida structural concretes made with normal weight and lightweight aggregates. 17. Key Word
18. Distribution Statement
Modulus of Elasticity, Shrinkage, Creep, Indirect Tensile Strength, Compressive Strength, Florida Concrete, Lightweight Concrete, Stalite, Miami Oolite, Creep Test Apparatus.
No Restriction This report is available to the public through the NTIS, Springfield, VA 22161
19. Security Classif. (of this report)
Unclassified Form DOT F 1700.7 (8-72)
20. Security Classif. (of this page)
Unclassified Reproduction of completed page authorized
21. No. of Pages
22. Price
SI* (MODERN METRIC) CONVERSION FACTORS APPROXIMATE CONVERSIONS TO SI UNITS APPROXIMATE CONVERSIONS FROM SI UNITS Symbol When You Know
Multiply By
To Find
Symbol Symbol When You Know
inches feet yards miles
25.4 0.305 0.914 1.61
in 2 ft 2 yd ac 2 mi
square inches square feet square yards acres square miles
fl oz gal 3 ft 3 yd
fluid ounces gallons cubic feet cubic yards
millimeters meters meters kilometers
mm m m km
645.2 0.093 0.836 0.405 2.59
square millimeters square meters square meters hectares square kilometres
mm 2 m 2 m ha 2 km
VOLUME 29.57 3.785 0.028 0.765
milliliters liters cubic meters cubic meters
mm m m km
millimeters meters meters kilometers
0.039 3.28 1.09 0.621
Symbol
mm 2 m 2 m ha 2 km
square millimeters square meters square meters hectares square kilometers
ml l 3 m 3 m
ml l 3 m 3 m
grams kilograms megagrams
g kg Mg
Temperature (exact) 5(F-32)/9 Celcius or (F-32)/1.8 temperature
inches feet yards miles
in ft yd mi
0.0016 10.764 1.195 2.47 0.386
square inches square feet square yards acres square miles
in 2 ft 2 yd ac 2 mi
milliliters liters cubic meters cubic meters
VOLUME 0.034 0.264 35.71 1.307
fluid ounces gallons cubic feet cubic yards
fl oz gal 3 ft 3 yd
g kg Mg
grams kilograms megagrams
0.035 2.202 1.103
ounces pounds short tons (2000 lb)
oz lb T
°C
°C
Celcius temperature
lx 2 cd/m
lx 2 cd/m
lux 2 candela/m
N kPa
N kPa
newtons kilopascals
AREA
AREA 2
To Find
LENGTH
LENGTH in ft yd mi
Multiply By
2
2
2
3
NOTE: Volumes greater than 1000 l shall be shown in m . MASS
MASS oz lb T
ounces pounds short tons (2000 lb)
°F
Fahrenheit temperature
fc fl
foot-candles foot-Lamberts
lbf psi
FORCE and PRESSURE or STRESS poundforce 4.45 newtons poundforce per square 6.89 kilopascals inch
28.35 0.454 0.907
ILLUMINATION 10.76 lux 2 3.426 candela/m
* SI is the symbol for the International System of Units. Appropriate rounding should be made to comply with Section 4 of ASTM E380.
Temperature (exact) 1.8C + 32 Fahrenheit temperature
°F
ILLUMINATION 0.0929 foot-candles 0.2919 foot-Lamberts
fc fl
FORCE and PRESSURE or STRESS 0.225 poundforce 0.145 poundforce per square inch
lbf psi
(Revised August 1992)
ACKNOWLEDGMENTS The Florida Department of Transportation (FDOT) is gratefully acknowledged for providing the financial support for this study. The FDOT Materials Office provided the additional testing equipment, materials and personnel needed for this investigation. Sincere thanks go to the project manager, Mr. Michael Bergin for providing the technical coordination and advices throughout the project. Sincere gratitudes are extended to the FDOT Materials Office personnel, particularly to Mr. Charles Ishee for his valuable technical advices and to Mr. Richard DeLorenzo for his long hours of supervision and conductance of the laboratory tests in this study. Sincere thanks to Ms. Irene Scarso and Ms. Candace Leggett for their editing and printing of this report.
i
TABLE OF CONTENTS
ACKNOWLEDGEMENTS................................................................................................. i LIST OF FIGURES .............................................................................................................v LIST OF TABLES...............................................................................................................x EXECUTIVE SUMMARY ............................................................................................... iv
CHAPTER 1 INTRODUCTION 1.1 Research Need ......................................................................................................1 1.2 Scope of This Study..............................................................................................2 1.3 Scope of This Report ............................................................................................2 CHAPTER 2 LITERATURE REVIEW 2.1 Introduction ..........................................................................................................4 2.2 Elastic Modulus of Concrete ................................................................................4 2.2.1 Definition of modulus of elasticity of concrete ............................................4 2.2.2 Significance of studying elastic modulus of concrete ..................................5 2.2.3 Effect of coarse aggregate on elastic modulus of concrete...........................6 2.2.4 Models for predicting elastic modulus of concrete.....................................10 2.3 Shrinkage of Concrete ........................................................................................12 2.3.1 Definition of shrinkage of concrete ............................................................12 2.3.2 Significance of studying shrinkage of concrete..........................................13 2.3.3 Effect of coarse aggregate on shrinkage of concrete ..................................13 2.3.4 Models of predicting shrinkage of concrete ...............................................17
ii
2.4 Creep of Concrete...............................................................................................22 2.4.1 Definition of creep of concrete ...................................................................22 2.4.2 Significance of studying creep behavior of concrete..................................23 2.4.3 Effect of coarse aggregate on creep of concrete .........................................24 2.4.4 Models of predicting creep of concrete ......................................................26 CHAPTER 3 DESIGN AND CONSTRUCTION OF CREEP TEST APPARATUS 3.1 Introduction ........................................................................................................32 3.2 Creep test apparatus............................................................................................32 3.2.1 The design...................................................................................................32 3.2.2 Maximum capacity of the creep apparatus .................................................34 3.2.3 Load relaxation due to creep of concrete....................................................36 3.2.4 Stresses in the steel rods of creep apparatus ...............................................36 3.2.5 Circular ......................................................................................................37 3.3 Gauge-point Positioning Guide ..........................................................................37 3.4 Alignment Frame................................................................................................41 CHAPTER 4 EXPERIMENTAL PROGRAMS 4.1 Introduction ........................................................................................................43 4.2 Concrete mixtures evaluated ..............................................................................43 4.2.1 Mix proportions ..........................................................................................43 4.2.2 Mix ingredients ...........................................................................................45 4.3 Preparation of fresh concrete..............................................................................53 4.4 Curing conditions for concrete specimens .........................................................55 4.5 Tests on fresh concrete and properties of fresh concrete ...................................56
iii
4.6 Tests on hardened concrete ................................................................................58 CHAPTER 5 RESULTS OF STRENGTH AND ELASTIC MODULUS TESTS 5.1 Introduction ........................................................................................................67 5.2 Results of compressive strength tests .................................................................67 5.3 Results of splitting tensile tests ..........................................................................73 5.4 Results of elastic modulus tests..........................................................................78 5.5 Relationship between compressive strength and splitting tensile strength ........83 5.6 Relationship between compressive strength and elastic modulus......................86 CHAPTER 6 RESULTS OF SHRINKAGE AND CREEP TESTS 6.1 Introduction ........................................................................................................91 6.2 Results of shrinkage tests ...................................................................................91 6.3 Results of creep tests ........................................................................................100 CHAPTER 7 SUMMARY AND RECOMMENDATIONS 7.1 Design and Construction of Creep Apparatuses...............................................124 7.2 Findings from the Research Testing Programs ................................................124 7.3 Recommendations ............................................................................................127 REFERENCE Appendix A Raw data from strength and elastic modulus tests Appendix B Figures about development of shrinkage strain and creep strain with time
iv
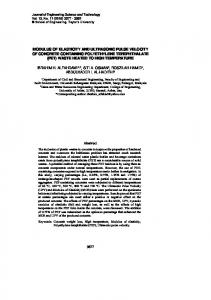
TABLE OF FIGURES Figure 2-1 Diagrammatic representation of the stress-strain relation for concrete .............5 Figure 2-2 Relation between compressive strength and volume of aggregate at W/C= 0.5.......................................................................................................................7 Figure 2-3 Stress-strain relations for cement paste, aggregate and concrete.......................7 Figure 2-4 Static modulus of elasticity of concrete made with gravel aggregate and expanded clay, and tested at different ages up to one year.................................9 Figure 2-5 Shrinkage of concrete with different cement contents (at a curing temperature of 68oF, 50% relative humidity and wind velocity of 2.25 mph) ...................14 Figure 2-6 Influence of aggregate content in concrete on the ratio of the shrinkage of concrete to the shrinkage of cement paste ........................................................15 Figure 2-7 Effect of coarse aggregate content on the shrinkage of concrete.....................16 Figure 2-8 Shrinkage of concrete of fixed mix proportion but made with different aggregate and stored in air at 70 °F and relative humidity of 50% ................17 Figure 2-9 Typical strain-time plot of concrete under a sustained load and after release of load ..................................................................................................................23 Figure 2-10 Creep of concrete of fixed mix proportion with different aggregate (loaded at the age of 28 days, and stored in air at 70 oF and relative humidity of 50% ...25 Figure 3-1 Design of creep test apparatus..........................................................................33 Figure 3-2 Positions of springs on the steel plate ..............................................................35 Figure 3-3 Design of Gauge-position guide.......................................................................38 Figure 3-4 Picture showing gauge-positioning guide ........................................................39 Figure 3-5 Plastic cylinder inside gauge position guide ....................................................40 Figure 3-6 Schematics of alignment frame........................................................................42 Figure 4-1 Gradation of fine aggregate..............................................................................49 Figure 4-2 Gradation of Miami Oolite coarse aggregate ...................................................50 Figure 4-3 Gradation of Stalite lightweight aggregate ......................................................51 Figure 4-4 Picture of concrete mixer .................................................................................53
v
Figure 4-5 Loading configuration of split tensile test........................................................58 Figure 4-6 The equipment used for performing elastic modulus test ................................60 Figure 4-7 Concrete cylinders with gauge installed on it ..................................................62 Figure 4-8 Whittemore gauge ............................................................................................63 Figure 5-1 Development of compressive strength of concretes with 20% fly ash ............70 Figure 5-2 Development of compressive strength of concretes with slag .........................71 Figure 5-3 Development of compressive strength of lightweight aggregate concrete ......72 Figure 5-4 Development of splitting tensile strength of concretes with 20% fly ash........76 Figure 5-5 Development of splitting tensile strength of concretes with slag ...................77 Figure 5-6 Development of splitting tensile strength of lightweight concrete ..................78 Figure 5-7 Development of elastic modulus of concrete with 20% fly ash.......................81 Figure 5-8 Development of elastic modulus of concrete with slag ...................................82 Figure 5-9 Development of elastic modulus of concrete with lightweight aggregate .......83 Figure 5-10 Relationship between compressive strength and splitting tensile strength ...85 Figure 5-11 Relationship between compressive strength and elastic modulus at 28 days .........................................................................................................88 Figure 5-12 Relationship between compressive strength and elastic modulus at 91 days .........................................................................................................89 Figure 5-13 Relationship between compressive strength and elastic modulus for all curing Conditions ........................................................................................................90 Figure 6-1 Development of shrinkage strain of concrete with 20% fly ash and 7-day moist curing.....................................................................................94 Figure 6-2 Development of shrinkage strain of concrete with 20% fly ash and 14-day moist curing...................................................................................95 Figure 6-3 Development of shrinkage strain of concrete with slag and 7-day moist curing.....................................................................................96 Figure 6-4 Development of shrinkage strain of concrete with slag and 14-day moist curing...................................................................................97 Figure 6-5 Development of shrinkage strain of lightweight aggregate concrete with 7-day moist curing ...................................................................................98 Figure 6-6 Development of shrinkage strain of lightweight aggregate concrete
vi
with 14-day moist curing ..................................................................................99 Figure 6-7 Development of creep strain of concrete with 20% fly ash (7-day moist curing and 40% load level) .......................................................................................112 Figure 6-8 Development of creep strain of concrete with 20% fly ash (7-day moist curing and 50% load level) .......................................................................................113 Figure 6-9 Development of creep strain of concrete with 20% fly ash (14-day moist cure and 40% load level) .......................................................................................114 Figure 6-10 Development of creep strain of concrete with 20% fly ash (14-day moist curing and 50% load level) ............................................................................115 Figure 6-11 Development of creep strain of concrete with slag (7-day moist curing and 40% load level) .......................................................................................116 Figure 6-12 Development of creep strain of concrete with slag (7-day moist curing and 50% load level) .......................................................................................117 Figure 6-13 Development of creep strain of concrete with slag (14-day moist curing and 40% load level) .......................................................................................118 Figure 6-14 Development of creep strain of concrete with slag (14-day moist curing and 50% load level) .......................................................................................119 Figure 6-15 Development of creep strain of lightweight concrete (7-day moist curing and 40% load level) .......................................................................................120 Figure 6-16 Development of creep strain of lightweight concrete (7-day moist curing and 50% load level) .......................................................................................121 Figure 6-17 Development of creep strain of lightweight concrete (14-day moist curing and 40% load level) .......................................................................................122 Figure 6-18 Development of creep strain of lightweight concrete (14-day moist curing and 50% load level) .......................................................................................123 Figure B-1 Comparison of shrinkage strains of Mix-1 under the different curing conditions......................................................................................................136 Figure B-2 Comparison of creep strains of Mix-1 under the different curing conditions and loading conditions ..................................................................................137 Figure B-3 Development of creep coefficient of Mix-1 with time..................................138 Figure B-4 Comparison of shrinkage strains of Mix-2 under the different curing
vii
conditions......................................................................................................139 Figure B-5 Comparison of creep strains of Mix-2 under the different curing conditions and loading conditions ..................................................................................140 Figure B-6 Development of creep coefficient of Mix-2 with time..................................141 Figure B-7 Comparison of shrinkage strains of Mix-3 under the different curing conditions......................................................................................................142 Figure B-8 Comparison of creep strains of Mix-3 under the different curing conditions and loading conditions ..................................................................................143 Figure B-9 Development of creep coefficient of Mix-3 with time..................................144 Figure B-10 Comparison of shrinkage strains of Mix-4 under the different curing conditions......................................................................................................145 Figure B-11 Comparison of creep strains of Mix-4 under the different curing conditions and loading conditions ..................................................................................146 Figure B-12 Development of creep coefficient of Mix-4 with time................................147 Figure B-13 Comparison of shrinkage strains of Mix-5 under the different curing conditions......................................................................................................148 Figure B-14 Comparison of creep strains of Mix-5 under the different curing conditions and loading conditions ..................................................................................149 Figure B-15 Development of creep coefficient of Mix-5 with time................................150 Figure B-16 Comparison of shrinkage strains of Mix-6 under the different curing conditions......................................................................................................151 Figure B-17 Comparison of creep strains of Mix-6 under the different curing conditions and loading conditions ..................................................................................152 Figure B-18 Development of creep coefficient of Mix-6 with time................................153 Figure B-19 Comparison of shrinkage strains of Mix-7 under the different curing conditions......................................................................................................154 Figure B-20 Comparison of creep strains of Mix-7 under the different curing conditions and loading conditions ..................................................................................155 Figure B-21 Development of creep coefficient of Mix-7 with time................................156 Figure B-22 Comparison of shrinkage strains of Mix-8 under the different curing conditions......................................................................................................157
viii
Figure B-23 Comparison of creep strains of Mix-8 under the different curing conditions and loading conditions ..................................................................................158 Figure B-24 Development of creep coefficient of Mix-8 with time................................159 Figure B-25 Comparison of shrinkage strains of Mix-9 under the different curing conditions......................................................................................................160 Figure B-26 Comparison of creep strains of Mix-9 under the different curing conditions and loading conditions ..................................................................................161 Figure B-27 Development of creep coefficient of Mix-9 with time................................162 Figure B-28 Comparison of shrinkage strains of Mix-10 under the different curing conditions......................................................................................................163 Figure B-29 Comparison of creep strains of Mix-10 under the different curing conditions and loading conditions ..................................................................................164 Figure B-30 Development of creep coefficient of Mix-10 with time..............................165
ix
LIST OF TABLES Table 3-1 Load relaxation in the creep apparatus due to creep strain of concrete.............36 Table 4-1 Mix proportions of ten mixtures investigated ...................................................44 Table 4-2 Physical properties of type-I cement .................................................................48 Table 4-3 Chemical properties of type-I cement ...............................................................48 Table 4-4 Physical and chemical properties of fly ash ......................................................48 Table 4-5 Physical and chemical properties of slag...........................................................49 Table 4-6 Physical properties of fine aggregate ................................................................49 Table 4-7 Physical properties of coarse aggregate ............................................................49 Table 4-8 Tests on fresh concrete ......................................................................................55 Table 4-9 Properties of fresh concrete ...............................................................................56 Table 4-10 The tests run on hardened concrete .................................................................57 Table 5-1 Average compressive strength of concrete at various ages ...............................69 Table 5-2 Average splitting tensile strength of concrete at various ages ..........................74 Table 5-3 Average elastic modulus of concrete at various ages........................................79 Table 5-4 Regression analysis of compressive strength versus splitting tensile strength of concrete.........................................................................................................84 Table 5-5 Regression analysis of compressive strength versus elastic modulus of concrete .............................................................................................................87 Table 6-1 Shrinkage strain of 10 mixtures at various ages................................................93 Table 6-2 Measured and calculated results from creep tests ...........................................102 Table A-1 Compressive strength of concrete...................................................................133 Table A-2 Splitting tensile strength of concrete ..............................................................134 Table A-3 Elastic modulus of concrete............................................................................135
x
EXECUTIVE SUMMARY Problem Statement At present, the modulus of elasticity, creep and shrinkage properties of concrete that are used in structural design in Florida are based on the arbitrary available literature or based on the limited research of the locally available material. In the absence of creep and shrinkage test results on the specific concretes to be used, an ultimate creep coefficient of 2.0 and an ultimate shrinkage strain of 0.0004 are usually used in designs. The possible errors in the estimation of these parameters can cause a serious problem in the design of pre-stressed concrete structures such as segmental bridges, which requires a more precise estimate of creep strain and shrinkage strain for the concrete. Thus, there is a great need for a comprehensive testing and evaluation of locally available concrete mixes to determine the mechanical and physical properties of Florida normal-weight as well as lightweight concretes, so that correct values for these properties can be used in structural designs. In addition, there is also an immediate need to determine the most effective and practical laboratory test setups and procedures for obtaining the modulus of elasticity, creep and shrinkage properties of structural concretes used in Florida.
Objectives of the Study The main objectives of this study are (1) to design, evaluate and construct creep test apparatuses that are suitable and effective for performing creep tests on Florida concretes, and (2) to conduct a research testing program to evaluate the compressive strength, indirect tensile strength, elastic modulus, drying shrinkage and creep
xi
characteristics of typical Florida Class II, IV, V and VI concrete mixes made with normal-weight and lightweight aggregates. With the time constraint of this two-year study, a total of 10 different concrete mixes were evaluated.
Design and Construction of Creep Apparatuses The creep test apparatus was designed, and twelve creep test apparatuses were constructed and set up in the laboratory for use in performing the creep tests in this study. In each test frame, three 6"×12" cylindrical specimens can be placed on top of one another and cemented together by an epoxy and tested under the same load. The maximum capacity of each creep apparatus is 1.92 × 10⁵ lbf . The maximum stress that can be applied to the 6"×12" cylindrical concrete specimens in the creep frame is 6795 psi. Three pairs of gage points with a gage distance of 10 inches are to be placed in each test concrete specimen. A mechanical strain gage (formerly known as Whittemore gage) is to be used to measure the change in distance between the gage points, which is the creep of the concrete specimen during the creep test. The creep test apparatus was evaluated to be working satisfactorily. An effective procedure for the creep test using this apparatus was developed and documented.
Findings from the Research Testing Program Ten typical Florida concrete mixes were evaluated in the research testing program for their compressive strength, splitting tensile strength, elastic modulus, shrinkage and creep characteristics. Eight of the ten concrete mixes used a Miami Oolite as the coarse aggregate, while two concrete mixes used a lightweight aggregate Stalite. Four normalweight concretes and one lightweight concrete used 20% fly ash, while the other four
xii
normal-weight concretes and one lightweight concrete used 50 to 70% slag. Tests were run on the concrete specimens up to an age of 91 days. Major findings from the tests on these ten concrete mixes are summarized as follows:
On Strength and Elastic Modulus
1.
The compressive strength, splitting tensile strength and elastic modulus of
the normal-weight concretes with 20 % fly ash continue to increase significantly beyond 28 days, while those of the normal-weight concretes with 50 to 70% slag level off considerably beyond 28 days. 2.
The lightweight concretes have considerably lower compressive strength,
splitting tensile strength and elastic modulus than those of the normal-weight concretes with similar w/c and mineral additive. 3.
The empirical relationships between compressive strength (fc’) and
splitting tensile strength ( fct) for the normal-weight concretes evaluated in this study are as follows: f ct = 7.08 ⋅
f c'
( )
f ct = f c'
0.72
The second equation was found to fit the data slightly better than the first one. 4.
The empirical relationships between compressive strength and elastic
modulus for the normal-weight concretes evaluated in this study are as follows: For 28-day curing,
E = 32.2 ⋅ w1.5 ⋅
f c'
For 91-day curing,
E = 32.8 ⋅ w1.5 ⋅
f c'
xiii
For all curing conditions, E = 33.0 ⋅ w1.5 ⋅
f c'
On Drying Shrinkage
5.
For the normal-weight concretes containing 20% fly ash, the drying
shrinkage decreases as w/c decreases, and as the moist curing time increases from 7 days to 14 days. 6.
For the normal-weight concretes containing 50 to 70% slag, the drying
shrinkage does not change significantly as the moist curing time increases from 7 days to 14 days. 7.
The normal-weight concretes containing 20% fly ash have a significantly
higher drying shrinkage than the concretes containing 50 to 70% slag of comparable w/c. 8.
For the two lightweight concretes evaluated, the drying shrinkage
decreases significantly as the moist curing time increases from 7 days to 14 days. 9.
The lightweight concretes have a significantly higher drying shrinkage
than the normal-weight concretes.
On Creep Characteristics
10.
The creep coefficient is generally lower for a concrete with a lower w/c.
11.
The creep coefficient of a concrete with slag is generally lower than that
for a concrete with fly ash, for comparable w/c. 12.
The creep coefficients of lightweight concretes are substantially lower
than those of normal-weight concretes.
xiv
13.
The creep coefficient does not vary linearly with load level. As the load
increases from 40% to 50% of ultimate load, the creep coefficient increases more than proportionally. 14.
With the exception of Mix 1 with a low w/c of 0.24, the creep coefficients
of the other nine concrete mixes appeared to continue to increase significantly beyond 91 days. 15.
Three of the ten concrete mixes evaluated had creep coefficients
exceeding the value of 2.0 at 91 days. At least two other concrete mixes had predicted creep coefficients exceeding 2.0 at one year.
Recommendations While this study has generated valuable data and determined general trends on the compressive strength, splitting tensile strength, elastic modulus, drying shrinkage strains and creep coefficient of typical Florida structural concretes made with normal weight and lightweight aggregates, it must be noted that this study was limited in scope due to the constraint of time and budget. Due to the time constraint, no replicate batch of the concrete mixes in the testing program was tested. There is a need to test the replicates of these concrete mixes to establish reliability of the findings and to evaluate the variability of the test results. The creep tests in this study were run only up to 91 days. However, the creep test results from this study indicate that most of concretes still continued to creep considerably at 91 days. There is a need to extend the creep tests beyond 91 days, and preferably to one year, so that the ultimate creep coefficient can be determined more reliably.
xv
Due to the limited scope of this study as described above, the concrete properties as determined from this study should not be recommended for use in structural designs yet at this point. It is recommended that further testing be conducted in the following areas: (1) Replicate batches of the ten concrete mixes evaluated in this study should be tested to establish reliability of the findings and to evaluate the variability of the test results. (2) The creep tests should be run up to one year, instead of 91 days. (3) Structural concretes using other Florida coarse aggregates should also be evaluated. (4) The effects of the type and amount of mineral admixtures (fly ash, slag and silica fume), and other admixtures should be evaluated.
xvi
Chapter 1 INTRODUCTION
1.1 Research Need At present, the modulus of elasticity, creep and shrinkage properties of concrete that are used in structural design in Florida are based on the arbitrary available literature or based on the limited research of the locally available material. For example, the “AASHTO LRFD Bridge Construction Specifications-2001 Interim Revisions” [AASHTO, 2001] specifies that, for the design of continuous prestressed concrete Igirder superstructures, the ultimate creep coefficient should be 2.0 and the ultimate shrinkage strain will take the value of 0.0004, in accordance with the recommendation of ACI 209. The guidelines say that, when mix-specific data are not available, estimates of shrinkage and creep may be made using the provisions of CEB-FIP model or ACI 209 model. However, the guidelines also state that, without results from tests on the specific concretes or prior experience with the materials, the use of the creep and shrinkage values referenced in these Specifications can not be expected to yield results with errors less than ±50%. This possible error can be a more serious problem for design of segmental bridges, which requires a more precise estimate of creep strain and shrinkage strain for the concrete. Furthermore, we do not have enough data available to judge whether the design parameters given by these specifications are in the range for safe design, especially for structural concretes made with Florida aggregates.
1
Thus, there is a great need for a comprehensive testing and evaluation of locally available concrete mixes to determine these mechanical and physical properties of Florida normal-weight as well as lightweight concretes, especially for the concretes used in pre-stressed concrete structure, so that correct values for these properties can be used in structural design. In addition, there is also an immediate need to determine the most effective and practical laboratory test setups and procedures for obtaining the modulus of elasticity, creep and shrinkage properties of structural concretes used in Florida. This research study was carried out to meet these needs of the FDOT.
1.2 Scope of This Study This research study had the following main objectives: (1) To evaluate and determine the most effective laboratory test setups and procedures for determining the modulus of elasticity, creep and shrinkage properties of structural concretes used in Florida. (2) To construct the necessary creep testing apparatuses and to set up the necessary laboratory testing equipment and data acquisition system at the FDOT Materials Office for evaluation of the modulus of elasticity, creep and shrinkage properties. (3) To determine the compressive strength, indirect tensile strength, modulus of elasticity, creep and shrinkage of typical Class II, IV, V and VI concrete mixes made with normal-weight and lightweight aggregates used in Florida. With the time constraint of this two-year study, a total of 10 different concrete mixes were evaluated.
2
(4) To recommend an efficient and reliable laboratory testing procedure for FDOT for determining or verifying the modulus of elasticity, creep and shrinkage properties of Class II, IV, V and VI concrete mixes.
1.3 Scope of This Report This report presents all the work performed in this project, including (1) a literature review on the factors affecting the elastic modulus, shrinkage and creep of concrete, and existing models for prediction of these mechanical properties, (2) the design and construction of the creep testing apparatuses, (3) the design and conductance of the laboratory testing program, (4) the collection and analysis of the laboratory data, and (5) findings and recommendations from this study.
3
Chapter 2 LITERATURE REVIEW 2.1 Introduction This chapter presents a literature review on the effects of various factors on the elastic modulus, shrinkage and creep properties of concrete. The existing models for predicting the elastic modulus, shrinkage and creep properties of concrete are also reviewed.
2.2 Elastic Modulus of Concrete 2.2.1 Definition of Elastic Modulus of Concrete The modulus of elasticity or “Young’s Modulus” is defined as the slope of the stress-strain curve within the proportional limit of a material. For a concrete material, the secant modulus is defined as the slope of the straight line drawn from the origin of axes to the stress-strain curve at some percentage of the ultimate strength. This is the value most commonly used in structural design. Since no portion of the stress-strain curve is a straight line, the usual method of determining the modulus of elasticity is to measure the tangent modulus, which is defined as the slope of the tangent to the stress-strain curve at some percentage of the ultimate strength of the concrete as determined by compression tests on 6"×12" cylinders. Figure 2-1 shows the stress-strain plot of a concrete as it is loaded and unloaded. From this figure, we can see that the secant modulus is almost identical to the tangent modulus obtained at some lower percentage of the ultimate strength.
4
Tangent modulus
Stress
Initial tangent modulus
Loading
Unloading
Secant modulus
Strain Figure 2-1. Diagrammatic representation of the stress-strain relation for concrete [A.M.Neville, 1996]
2.2.2 Significance of Studying Elastic Modulus of Concrete The elastic modulus of concrete is a very important mechanical parameter reflecting the ability of the concrete to deform elastically. For example, in prestressed concrete structures, elastic shortening of prestressed concrete is one of the main factors contributing to prestress loss. If a too conservative estimate of elastic shortening was used, the volume of tendon to reach the design prestress would have to be increased, resulting in possible waste of materials and increased cost. Also, prestress loss due to elastic shortening will decrease the capacity of a concrete structure, and even lead to collapse of the structure. In addition, in order to make full use of the compressive strength potential, the structures using high-strength concrete tend to be slimmer and require a higher elastic modulus so as to maintain its stiffness. Therefore, knowledge of
5
the modulus of high strength concrete is very important in avoiding excessive deformation, providing satisfactory serviceability, and achieving the most cost-effective designs. 2.2.3 Influence of Coarse Aggregate on Elastic Modulus of Concrete Since concrete is a multiphase material, any variation of coarse aggregate content, coarse aggregate type or mix design will result in the change of elastic modulus of concrete. The following sections will review the influence of aggregate content, aggregate type and mix design on the elastic modulus of concrete. Effects of Coarse Aggregate Content on Elastic Modulus In a study by A.F.Stock, D.J.Hannant and R.I.T.Williams [Stock et al, 1979], it was reported that for concretes with a fixed w/c of 0.5, as the volume of coarse aggregate varied from 20 to 60 %, the compressive strength of concrete remained almost same, as shown in Figure 2-2. This result is very consistent with the ‘W/C law’ established by Duff Abrams in 1919. That is to say, for a given mix proportion, the compressive strength of concrete will be determined by its water to cement ratio. This is especially true for normal concrete with compressive strength less than 60 MPa. However, the elastic modulus of the concrete was substantially influenced by the changes in its coarse aggregate content. As shown in Figure 2-3, we can see that the elastic modulus of concrete is remarkably different from that of hardened cement. Also, A.M.Neville [A.M.Neville, 1996] pointed out that, for a concrete of a given strength, because normal weight aggregate has a higher elastic modulus than hydrated cement paste, a higher aggregate content results in a higher modulus of elasticity of the concrete.
6
Figure 2-2. Relation between compressive strength and volume of aggregate at W/C= 0.5 [A.F.Stock, D.J.Hannant and R.I.T.Williams, 1979]
Stress -MPa
50 Aggregate 40 Concrete
30
Cement paste 20 10
0
1000
-6
2000
3000
Strain -10
Figure 2-3. Stress-strain relations for cement paste, aggregate and concrete [A.M.Neville, 1996] In a study by Bertil Persson [Persson, 2001], it was reported that the elastic modulus of self-compacting concrete was the same as that for normal concrete as long as their compressive strengths were the same. However, in the study by Jürg Schlumpf
7
[Schlumpf, 2004], the elastic modulus of self-compacting concrete was reported to be 20% lower than that of a normal concrete with similar strength. In addition, the findings from the study by J.M.Chi [Chi, 2003] also indicated that the aggregate fraction in concrete had a considerable effect on the elastic modulus of concrete. Effects of Coarse Aggregate Type on Elastic Modulus Coarse aggregate type is another very important factor affecting the elastic modulus of hardened concrete. Different types of aggregate can have quite distinct effects on elastic modulus. Even different course aggregates of the same type but from different locations can have substantially different properties. The reported findings by F.P.Zhou, F.D.Lydon and B.I.G.Barr [Zhou et al, 1995] show that the coarse aggregate type has a considerable influence on the elastic modulus of concrete. In their study, the effects of expanded clay, sintered fly ash, limestone, gravel, glass and steel aggregate on the elastic modulus of concrete were investigated. Figure 2-4 shows the plot of elastic modulus versus compressive strength of concretes made with different aggregate types. In addition, the study results reported by J.J.Shideler [Shideler, 1957] on concrete mixtures using gravel and expanded clay as aggregate also indicate the same conclusion as reported by F.P.Zhou, F.D.Lydon and B.I.G.Barr [Zhou et al, 1995].
8
Figure 2-4 Static modulus of elasticity of concrete made with gravel aggregate and expanded clay, and tested at different ages up to one year [J.J.Shideler, 1957] Effects of Mix Design on Elastic Modulus Normally, the compressive strength of concrete is the only mechanical property to be considered in the mix design of a concrete. The elastic modulus of concrete is normally predicted by the equation recommended by ACI 318-89. According to the ACI prediction equation, a high compressive strength will give a high predicted elastic modulus. However, from Figure 2-4, it can be seen that a concrete with a higher compressive strength does not necessarily give a higher elastic modulus than a concrete with a lower compressive strength. For example, the elastic modulus of mixture C with a compressive strength of 8,000 psi is similar to that of mixture B with a compressive strength of 5,000 psi. Thus, not only the design strength but also the mix ingredients will have a great influence on the elastic modulus of the concrete.
9
2.2.4 Models for Predicting Elastic Modulus of Concrete As mentioned in the literature about the factors affecting elastic modulus of concrete, for a given type of aggregate, although the modulus of elasticity of concrete will increase with the strength of concrete, the factors that affect the modulus of elasticity of concrete do not always have a corresponding effect on the strength of concrete. Thus, there is no universal specification that is possibly applied to relate compressive strength to elastic modulus of concrete. But, it is still helpful to use models to predict the elastic modulus of concrete. The following sections review a few models for prediction of elastic modulus of concrete. Model recommended by Florida LRFD Guidelines [2002] According to this specification, in the absence of more precise data, the modulus of elasticity for concretes with unit weights between 0.090 and 0.155 kcf, can be estimated from the following formula:
E c = 33000 ⋅ w1c .5 ⋅
f c'
Where Ec – Elastic modulus in ksi wc -unit weight of concrete (kcf)
f c' -compressive strength of concrete (ksi) Prediction equations recommended by ACI 209
10
[Equation 2.1]
The prediction equations recommended by ACI for estimating the elastic modulus of concrete are given as follows: E c = 57000 f c'
[Equation 2.2]
Where
E c – Elastic modulus (psi) f c' -compressive strength of concrete (psi) This following equation recommended by ACI 318-89 (revised 1992) for structural calculation is applicable to normal weight concrete: E c = 3.32 f c' + 6.9
[Equation 2.3]
Where
E c – Elastic modulus (GPa) f c' -compressive strength of concrete (MPa) The following equation given by ACI 363R-92 is applicable for predicting elastic modulus of concretes with compressive strength up to 83 MPa (12000 psi) E c = 3.65 f c'
[Equation 2.4]
Where
E c – Elastic modulus (GPa) f c' -compressive strength of concrete (MPa) CEB-FIP Model (1990)
11
CEB-FIP Model (COMITE EURO-INTERNATIONAL DU BETON) Code (1990) also offers the following model for prediction of time-dependent modulus of elasticity. The equation is given as follows:
⎛ ⎛ ⎛ ⎛ 28 ⎞ 0.5 ⎞ ⎞ ⎞ ⎜ ⎟⎟ ⎟ ⎟ ⎟ E ci (t ) = ⎜ exp⎜ s ⋅ ⎜1 − ⎜⎜ ⎜ ⎜ ⎟ ⎟ ⎟⎟ t /t ⎜ ⎝ ⎝ ⎝ 1 ⎠ ⎠⎠⎠ ⎝
0.5
⋅ E ci
[Equation 2.5]
Where s - A coefficient depending on the type of cement; s = 0.20 for rapid hardening high strength cements, 0.25 for normal and rapid hardening cements, and 0.38 for slow hardening cements. t - Age of concrete (days). t1 - 1 day Eci = Modulus of elasticity of concrete at an age of 28 days.
2.3 Shrinkage of Concrete 2.3.1 Definition of Shrinkage of Concrete According to the mechanisms of concrete shrinkage, shrinkage of concrete consists of plastic shrinkage, autogenous shrinkage (a process known as self-desiccation), drying shrinkage, and carbonation shrinkage. Autogenous shrinkage is the consequence of withdrawal of water from the capillary pores by the anhydrous cement particles. Most of the autogenous shrinkage will take place at the early age of hydration of cement. However, for concrete mixtures with a very low W/C ratio, this procedure may last longer if moisture is available. Plastic shrinkage and drying shrinkage are caused by
12
withdrawal of water from concrete under the condition of humidity gradient between the interior of concrete and air. These are the two main factors contributing to cracking of concrete at early age. Carbonation shrinkage is caused by carbonation of calcium hydroxide in the concrete. Thus, carbonation shrinkage normally takes place on the surface of concrete members. 2.3.2 Significance of Studying Shrinkage of Concrete Shrinkage of concrete is a very important property of concrete to be evaluated. Excessive shrinkage of concrete is connected to cracking of concrete, even failure. At the early age of concrete, due to the low strength of concrete, stresses due to drying shrinkage can cause cracking in the concrete. Shrinkage cracking in concrete can subsequently lead to premature failure of the concrete structure. Cracking in concrete can also lead to increased corrosion rate of steel reinforcement in the concrete structure. The rate at which corrosion occurs and the time to initiate corrosion is significantly influenced by the cracks in the concrete, which increase the permeability of the concrete. For marine concrete or concrete structures close to the coastal region, the penetration of aggressive ions through cracks into the interior of concrete is a very critical factor in causing the corrosion of steel reinforcement. In addition, for prestressed concrete elements, not only does the shrinkageinduced cracking speed up the corrosion of reinforcement, shrinkage deformation is also one of the main factors contributing to prestress loss. 2.3.3 Effect of Coarse Aggregate on Shrinkage of Concrete An increase in volume of aggregate in concrete will usually lead to a decrease in cement content, which would lead to reduced shrinkage for the concrete. However, a
13
reduction in cement content does not necessarily cause a reduction in the strength of the concrete. Thus, it is possible to design a concrete with low cement content and low shrinkage without sacrifice of strength. The following sections will review the influence of aggregate content, aggregate type and aggregate size on shrinkage of concrete. Effect of Coarse Aggregate Content on Concrete Shrinkage The contribution of coarse aggregate to decrease shrinkage of concrete is attributed to the decrease of cement paste volume in the concrete mix. Figure 2-5 shows the influence of coarse aggregate content on the shrinkage of concrete mixtures with the same curing temperature, relative humidity, and wind velocity.
Figure 2-5. Shrinkage of concrete with different cement contents (at a curing temperature of 68oF, 50% relative humidity and wind velocity of 2.25 mph) [R.L’Hermite, 1960] From Figure 2-5, we can see that, at the early age of concrete, the shrinkage strain of the concrete with a cement content of 850 lb/yd3 (typical cement content for flowable
14
concrete) is almost three times higher than that of concrete mixtures with a cement content of 340 lb/yd3. Figure 2-6 shows the influence of aggregate content in concrete on the ratio of the shrinkage of concrete to the shrinkage of cement paste. The shrinkage ratio increases significantly as the aggregate content decreases. The possible reason to explain the effects of coarse aggregate content on shrinkage strain of concrete is shown in Figure 2-7. For the lean concrete mixture with a high coarse aggregate content, the coarse aggregate particles will have point-to-point contacts or even face-to-face contacts with each other. So a concrete with such an aggregate structure will be very effective in resisting stresses caused by cement paste shrinkage. The coarse aggregate particles cannot be pushed more closely under the action of interior stress cause by shrinkage.
Figure 2-6. Influence of aggregate content in concrete on the ratio of the shrinkage of concrete to the shrinkage of cement paste [G.Pichett, 1956]
15
CA Mortar
a. Lean concrete
b. Rich concrete
Figure 2-7. Effect of coarse aggregate content on the shrinkage of concrete However, for the rich concrete mixture, there are greater distances between the coarse aggregate particles. This condition gives the concrete less resistance to movement caused by shrinkage. Effects of Coarse Aggregate Type on Concrete Shrinkage The skeleton of coarse aggregate in a concrete can restrain the shrinkage of the cement matrix. If the skeleton of coarse aggregate in the concrete is stiffer, the shrinkage strain of concrete will be less. The elastic modulus of the aggregate determines the extent of restraining action to the shrinkage of concrete. For example, the shrinkage of a concrete made with a steel aggregate will be lower than the one made with a normal aggregate. Similarly, the shrinkage of a concrete made with expanded shale aggregate will be higher than the one made with a normal aggregate. As shown in Figure 2-8, the study by G.E.Troxell, J.M.Raphael and R.E.Davis [Troxell et al, 1958] shows that, for a fixed mix proportion, there is a considerable variation in the shrinkage strain of the resulting concrete batched with coarse aggregate of different types. This phenomenon is due very likely to the difference in modulus of
16
elasticity among aggregates of different types. Generally speaking, the elastic property of aggregate determines the degree of restraint to the cement matrix. This conclusion has also been confirmed by T.W. Reichard [Reichard, 1964]. A normal natural aggregate is usually not subject to shrinkage. However, there exist rocks that can shrink up to the same magnitude as the shrinkage of concrete made with non-shrinking aggregate.
Figure 2-8 Shrinkage of concrete of fixed mix proportion but made with different aggregate and stored in air at 70 °F and relative humidity of 50% [G.E.Troxell, J.M.Raphael and R.E.Davis, 1958] Effects of Size and Shape of Coarse Aggregate on Concrete Shrinkage Aggregate size and shape also affect the shrinkage of hardened concrete. The study by J.Bisschop, L.Pel, and J.G.M.van Mier [Bisschop, 2000] indicates that the total length and the depth of micro cracking caused by shrinkage of concrete will increase with larger aggregate size. 2.3.4 Models to Predict Concrete Shrinkage The shrinkage prediction models offered by LRFD Guidelines, CEB-FIP model code (1990) and ACI-209 (1992) are reviewed in the following sections.
17
Prediction equation given by LRFD Guidelines For moist cured concretes devoid of shrinkage-prone aggregate, based on the equation recommended by ACI 209 [1992] the modified prediction formula may be taken as:
ε sh = −k s k h (
t ) ⋅ 0.51 × 10 −3 35.0 + t
[Equation 2.6]
Where εsh – time-dependent shrinkage t -drying time in days k s -size factor; k s = 1.0 for 6×12 inch cylinder k h -humidity factor
CEB-FIP Model for shrinkage strain prediction
In this model, the effects of cement type, ambient relative humidity, compressive strength of concrete, and size effect of specimen on shrinkage strain of concrete are taken into consideration. The total shrinkage strain may be estimated by the following equation:
ε cs (t , t s ) = ε cs 0 ⋅ β s (t − t s )
[Equation 2.7]
Where
ε cs (t, t s ) − Time dependent total shrinkage strain ε cs 0 - Notational shrinkage coefficient β s (t – ts) - Coefficient to describe the development of shrinkage with time ε cs 0 can be estimated by the following equation:
18
⎛ ⎜ ⎝
⎛
⎛ f cm ⎝ f cmo
ε cs 0 = ⎜160 + 10β sc ⎜⎜ 9 − ⎜⎜ ⎝
⎞ ⎞ ⎞⎟ ⎟⎟ ⎟ × 10 −6 β RH ⎟ ⎠ ⎠ ⎟⎠
[Equation 2.8]
Where
β sc - A coefficient which depends on the type of cement: β sc = 4 for slowly hardening cements; 5 for normal or rapid hardening cements; 8 for rapid hardening high strength cements. f cm -The mean compressive strength of concrete at the age of 28 days. f cmo =1 MPa
β RH = −1.55β sRH for 40% ≤ RH < 99% ; β RH = 0.25 for RH ≥ 99% Where
β sRH
⎛ RH = 1 − ⎜⎜ ⎝ RH 0
⎞ ⎟⎟ ⎠
3
RH - The relative humidity of the ambient environment (%). RH 0 -100%
β s (t − t s ) can be estimated by the following equation: ⎛ (t − t s ) ⎜ ⎜ t1 β s (t − t s ) = ⎜ 2 ⎜ ⎛ h⎞ t − ts ⎜ 350 ⋅ ⎜⎜ ⎟⎟ + t1 ⎝ h0 ⎠ ⎝ Where
19
⎞ ⎟ ⎟ ⎟ ⎟ ⎟ ⎠
0.5
[Equation 2.9]
h=
2 Ac - The notational size of member (in mm), where Ac is the cross-sectional area u
(mm2) and u is the perimeter (mm) of the member in contact with the atmosphere. h0 -100 mm t1 -1 day
Prediction Model Recommended by ACI-209 Report [1992]
The concrete shrinkage prediction model recommended by ACI-209 (1992) is shown by the following equation:
(ε sh )t
=
t (ε sh )u 35 + t
[Equation 2.10]
Where
(ε sh )t
- Time dependent shrinkage strain
(ε sh )u - Ultimate shrinkage strain t - Time in days If there is no available shrinkage data from the concrete to be evaluated, the ultimate shrinkage strain, (ε sh )u , can be assumed to be the following:
(ε sh )u
= 780 × 10-6 × γsh
[Equation 2.11]
where γsh - a product of all the applicable correction factors for the testing conditions other than the standard condition; γsh = 1 under standard testing condition. γsh is obtained by multiplying the ultimate shrinkage strain under the standard condition by the appropriate correction factors as described in the following:
20
(1) Correction factors for the effect of initial moist curing The correction factor is equal to 1.0 for concrete cylinders moist cured for 7 days, and 0.93 for that moist cured for 14 days. (2) Correction factor for the effect of ambient relative humidity The following formulas are given for use in obtaining the correction factor for shrinkage test performed under the condition of ambient relative humidity greater than 40%.
γ λ = 1.40 − 0.0102λ , for 40 ≤ λ ≤ 80 γ λ = 3.00 − 0.030λ , for 80 ≤ λ ≤ 100 where
γ λ - Correction factor for the effect of relative humidity λ - Relative humidity (3) Correction factor for the effects of specimen size The correction factor in consideration of the specimen size effect ( γ vs ) is given by the following equation: v s
γ vs = 1.2 exp(−0.12 ⋅ ) where
γ vs - Correction factor for the effects of specimen size v - Volume-surface area ratio of the specimen in inches s
(4) Correction factor for concrete composition
21
Various equations for calculating the correction factors for the effects of the slump of the fresh concrete, aggregate content, cement content and air content of the concrete have also been given in this model.
2.4 Creep of Concrete 2.4.1 Definition of creep of hardened concrete
Figure 2-9 shows a plot of strain versus time for a concrete that was loaded for some time and then unloaded. The permanent strain that remains after the load has been taken off is called the creep strain. The creep strain consists of two main components. The first component is the true or basic creep, which occurs under the conditions of no moisture movement to or from the ambient medium. The second component is the drying creep, which is caused by drying. Normally, the creep strain that is considered in structural design is the sum of basic creep strain and drying creep strain. Due to the difficulty to differentiate delayed elastic strain from creep strain and the convenience to build a numerical model to simulate time-creep strain curve with the delayed elastic deformation included, the total creep strain would usually include both the delayed elastic deformation and permanent creep deformation. The approach is usually taken since the delayed elastic strain is usually very small compared with the total creep strain.
22
Strain
Instantaneous recovery Delayed elastic recovery
Permanent creep
Elastic strain
Time since application of load
Figure 2-9. Typical strain-time plot of concrete under a sustained load and after release of load 2.4.2 Significance of Studying Creep Behavior of Concrete
Creep in concrete can have both positive as well as negative effects on the performance of concrete structures. On the positive side, creep can relieve stress concentrations induced by shrinkage, temperature changes, or the movement of supports. For example, in indeterminate beam with two fixed ends, creep deformation will be very helpful in reducing tensile stress caused by shrinkage and temperature variation. On the other hand, in some concrete structures, creep can do harm to the safety of the structures. Creep can lead to an excessive deflection of structural members, buckling or other serviceability problems, especially in high-rise building, eccentrically loaded columns and long bridges. In mass concrete, creep may be a cause of cracking when a restrained concrete mass undergoes a cycle of temperature change due to the development of heat of hydration and subsequent cooling. For prestressed concrete structures, such as composite bridges, pre-stressed shells, or continuous girders, the desirable creep of concrete would be as low as possible. Heavily pre-stressed members
23
and long members are particularly susceptible to large volume changes. If a pre-stressed member is restrained in position prior to the majority of the volume change has taken place, the pre-stressed members will exert excessive forces on its connections and supporting structures that could cause a structural failure. 2.4.3 Effect of Aggregate on Creep of Hardened Concrete
Aggregates play an important role in creep of concrete. Coarse aggregate reduces creep deformation by reducing the cement paste content and restraining the cement paste against contraction. Generally, concretes made with an aggregate, which is hard and dense and have low absorption and high modulus of elasticity, are desirable when low creep strain is needed. K. M. Alexander, G. M. Bruere and I. Ivanusec studied the influence of 23 aggregate types on creep deformation of concrete [Alexander et al, 1980]. Creep tests were conducted in a controlled environment at 23 °C and 60 % relative humidity. Creep tests were conducted for six months after a 28-day water cured period in lime-saturated water to allow for minimal effects of hydration. Strains were measured using longitudinal gages on two opposite faces of the prism with a gage length of 100 mm (4 in). The conclusion shows that aggregates with a lower absorption will produce concrete with a lower creep deformation. It was further determined that the aggregate with a high elastic modulus will produce low creep values. T.M.Collins [Collins, 1989] examined the creep property of high strength concrete. Creep tests were conducted according to ASTM C 512. The results demonstrated that a concrete with a larger aggregate size and lower paste content would provide a lower creep strain. Also as shown in Figure 2-10, the study by G.E.Troxell,
24
J.M.Raphael, and R.E.Davis [Troxell et al, 1958] indicates that the creep strains of the concrete mixtures with different types of aggregate will behave differently. The highest creep value is obtained from the concrete made with sandstone aggregate, and the lowest creep value is obtained from the concrete made with limestone. Rüsch et al [Rüsch, 1963] found an even greater difference between the creep strains of concretes made with different aggregates. After 18 months under the load at a relative humidity of 65%, the maximum creep strain of the concrete made with sandstone was five times higher than the minimum creep strain of the concrete made with basalt. In addition, the conclusion on the effect of coarse aggregate content on creep of concrete is also confirmed by the tests on lightweight aggregate concrete. The study by Mehmet Geso lu, Turan Özturan and Erhan Güneyisi [Geso lu et al, 2004] shows that concretes containing higher lightweight coarse aggregate content had a lower creep strain at all W/C.
Figure 2-10. Creep of concrete of fixed mix proportion but with different aggregate (loaded at the age of 28 days, and stored in air at 70 oF and relative humidity of 50 %) [G.E.Troxell, J.M.Raphael, and R.E.Davis, 1958]
25
Creep tests done by Hua, C. [Hua, 1995] on pure hardened cement pastes and on a reference concrete (made with the same paste) also show that creep is reduced by the presence of aggregate. Creep of cement paste is the main source of the total creep strain of concrete. Thus, decreasing the cementitious content of concrete is an effective measure to reduce creep strains in concrete. 2.4.4 Models to Predict Creep Strain of Concrete
Regardless of which creep models, either rheological model or numerical model, are used for predicting the relationship between creep strain and time, none of them can give us an accurate prediction. The complicated effects of concrete ingredients as well as the environmental conditions on creep behavior make the satisfying prediction nearly unapproachable. Even though some models were well-established and proper to predict creep behavior of some concretes, they only can be applied to the concretes with the given mix-proportions as well as raw materials. However, when creep data are not available for specific concrete and there is no condition to perform creep test, prediction equations can be used to get some estimates of the creep strains. Three models for prediction of creep strain of concrete are reviewed in the following sections. Equation given by LRFD Guidelines (FDOT, 2002)
This method of determining creep is taken from Collins and Mitchell [1991]. This method based on the commendation of ACI Committee 209 is modified by additional recently published data. According to this method, the creep coefficient may be taken as:
26
(t − t1 ) H ⎞ −0.118 ⎛ ϕ (t , t1 ) = 3.5k c k f ⎜1.58 − ⋅ ⎟t1 0.6 120 ⎠ 10.0 + (t − t1 ) ⎝ 0.6
[Equation 2.12]
Where kf =
1 ⎛ f c' ⎞ 0.67 + ⎜⎜ ⎟⎟ ⎝ 9 ⎠
H -relative humidity (%) k 0 -factor for the effect of the volume to surface ratio k f -factor for the effect of concrete strength t -maturity of concrete (day) t1 -age of concrete when load is initially applied (day)
C.E.B-F.I.P Model Code (1990)
In this model, the creep strain can be predicted by the following equation:
ε cr (t , t 0 ) =
σ c (t 0 ) E ci
⋅ φ 28 (t , t 0 )
[Equation 2.13]
Where
ε cr (t , t 0 ) - Creep strain at time t σ c (t 0 ) -Applied stress φ 28 (t , t 0 ) - Creep coefficient E ci - Modulus of elasticity at the age of 28 days
The modulus of elasticity can be estimated by the following equation:
27
1
f + ∆f 3 E ci = α E ⋅ 10 ⋅ ( ck ) f cmo 4
[Equation 2.14]
where f ck - Characteristic strength of concrete (in MPa)
∆f = 8MPa f cmo = 10MPa
α E = 2.15 × 10 4 MPa The creep coefficient φ 28 (t , t 0 ) can be calculated as follows:
φ 28 (t , t 0 ) = φ0 ⋅ β c (t − t 0 )
[Equation 2.15]
Where
φ 0 - Notational creep coefficient. β c - Coefficient to describe the development of creep with time after loading t - Age of concrete in days t 0 - Age of concrete when loaded in days The notational creep coefficient can be estimated as follows:
28
φ 0 = φ RH ⋅ β ( f cm ) ⋅ β (t 0 ) φ RH = 1 + β ( f cm ) = β (t 0 ) =
1 − RH / RH 0 0.46 ⋅ (h / h0 )1 / 3 5.3 f cm / f cmo
1 0.1 + (t 0 / t1 ) 0.2
Where f cm = f ck + ∆f , h - Notational size of the member (in mm) = 2 Ac / u . Ac - Cross-sectional area (in mm2) u - Perimeter of the member in contact with the atmosphere (in mm)
h0 - 100 mm.
RH - Relative humidity of the ambient environment (in %). RH 0 - 100% t1 - 1 day. ⎡ (t − t 0 ) / t1 ⎤ β (t − t 0 ) = ⎢ ⎥ ⎣ β H + (t − t 0 ) / t1 ⎦
βH
⎡ ⎛ RH = 150 ⋅ ⎢1 + ⎜⎜1.2 ⋅ RH 0 ⎢⎣ ⎝
⎞ ⎟⎟ ⎠
18
0.3
⎤ h ⎥ ⋅ + 250 ≤ 1500 ⎥⎦ h0
Model of ACI 209 [ACI 209 Committee, 1992]
In the ACI 209 (1992) model, the creep coefficient is estimated as follows:
29
(t − t 0 ) 0.6 φ 28 (t , t 0 ) = φ ∞ (t 0 ) ⋅ 10 + (t − t 0 ) 0.6
[Equation 2.16]
Where
φ 28 (t , t 0 ) - Creep coefficient at time t φ ∞ (t 0 ) - Ultimate creep coefficient to - Time of loading The ultimate creep coefficient can be expressed as:
φ ∞ (t 0 ) = γ c ⋅ φ ∞
[Equation 2.17]
The constant φ ∞ = 2.35 is recommended. The correction factors γ c consist of the following terms:
γ c = γ la ⋅ γ RH ⋅ γ at ⋅ γ s ⋅ γ ρ ⋅ γ a Where
γ la - Correction factor for loading age. For loading ages later than 7 days and moist cured concrete, γ la = 1.25 ⋅ (t 0 ) −0.118 . For loading ages later than 1-3 days and
steam cured concrete, γ la = 1.13 ⋅ (t 0 ) −0.094
γ RH - Correction factor ambient relative humidity. For ambient relative humidity greater than 40%, γ RH = 1.27 − 0.0067 ⋅ RH . (RH is the ambient relative humidity in %)
γ s - Correction factor for slump of fresh concrete. γ s = 0.82 + 0.00264 ⋅ S l in mm)
30
( S l is slump
γ ρ - Correction factor for fine to total aggregate ratio. γ ρ = 0.88 + 0.0024 ⋅ ρ a ( ρ a is fine to total aggregate ratio)
γ a - Correction factor for air content. γ a = 0.46 + 0.09 ⋅ a a
( a a is air content)
γ at - Correction factor for thickness of member. When the average thickness or volume to surface ratio of a structural member differs from 150 mm or 38 mm, respectively, two methods are offered for estimating the factor of member size γ at : (1) average-thickness method For an average thickness of a member smaller than 150 mm, the factors are given by ACI-209 Report. For an average thickness of a member larger than 150 mm and up to about 300 to 380 mm, the correction factor for thickness is given as:
γ at = 1.14 − 0.00092 ⋅ ha
During the first year after loading
γ at = 1.10 − 0.00067 ⋅ ha
For ultimate values
Where ha = Average thickness of a member in mm.
(2) volume-surface ratio method
γ at =
v − 0.0213⋅( ) ⎤ 2 ⎡ s ⋅ ⎢1 + 1.13 ⋅ e ⎥ 3 ⎣ ⎦
Where
v = Volume to surface ratio in mm. s
31
Chapter 3 DESIGN OF CREEP TEST APPARATUS
3.1 Introduction The creep test apparatus was designed, and twelve creep test apparatuses were constructed and set up in the laboratory for use in performing the creep tests in this study. This chapter describes the design of the creep test apparatus, and its auxiliary tools, which include a gage-point positioning guide for positioning gage points on a creep test specimen, and an alignment frame for aligning the specimens in a vertical direction when they are cemented together with an epoxy.
3.2 Creep Test Apparatus 3.2.1 The Design
The design for the creep test apparatus is shown in Figure 3-1. In each test frame, three 6"×12" cylindrical specimens are placed on top of one another and cemented together by an epoxy and tested under the same load. The load is applied by means of a hydraulic jack (with a maximum capacity of 200,000 lbs) and monitored by a load cell with a digital readout indicating the load applied. When the desired load is reached, the nuts on the threaded rods are turned so that they are snugly pressing against the plate underneath the hydraulic jack so as to hold the plate in that position and thus holding the applied load. After the nuts are positioned properly to hold the applied load, the jack and the load cell can be removed from the test frame and used to set the load on another test frame.
32
2in 1in
Load cell Hydraulic jack
2in 1in
10in
Circular steel plate ∅1.125in Gauge 1
1
1in
Circular steel plate
36in
Concrete cylinder
8.25in 1in
Springs 18in 12in ∅1.25in
33
12in
18in
Figure 3-1. Creep Test Apparatus
The springs in the creep frame help to maintain the load that is applied to the concrete specimens, as the concrete specimens creep under load. Up to 9 sets of springs can be used in this test frame. Figure 3-2 shows the positions of the springs in the test frame. Each set of springs consists of a smaller spring fitting inside a larger spring. The reason for using up to 9 sets of springs instead of using a smaller number of springs is mainly due to cost consideration. With this design, standard railroad springs, which are much less expensive than custom-made springs, can be used. This design also has the advantage that when a smaller load is applied, a smaller number of springs can be used so as to maintain the applied load better. 3.2.2 Maximum Capacity of the Creep Apparatus
The spring constant of the larger spring, kl, is 9822 lbf/in, while the spring constant of the smaller spring, ks, is 3314 lbf/in. The maximum travel distance, S, for both springs is 1.625 in. If all nine sets of springs are used, the maximum load, Cmax, that the springs can hold can be calculated to be: Cmax = 9 × (kl + ks) × S = 1.92 × 10⁵ lbf
[Equation 3.1]
Thus, the maximum capacity of this creep apparatus is 1.92 X 10⁵ lbf . The maximum stress, σmax that can be applied to the 6"×12" cylindrical concrete specimens in the creep frame can be calculated to be: σmax = Cmax /(π × 32) = 6795 psi
[Equation 3.2]
In consideration that the concrete test specimens may be loaded up to 50% of its ultimate compressive strength in the creep test, this creep apparatus can be used to test concretes with a maximum ultimate compressive strength of 13,590 psi.
34
Outside ∅2.94in
Outside ∅5.50in
Large spring
6in
Small spring
12in
6in 12in
Figure 3-2. Positions of springs on the steel plate
35
3.2.3 Load Relaxation due to Creep of Concrete
As the concrete specimens creep under the sustained load in the creep frame, the load applied on concrete will be reduced. The load relaxation due to the creep deformation of the concrete specimens can be calculated by multiplying the total creep deformation by the total spring constant of the springs, as follows: Load Relaxation = (Total Spring Constant) × (Creep Deformation) = (Total Spring Constant) × (Creep Strain) × 3 × 12 in. When all nine sets of springs are used, the total spring constant is equal to 118,224 lbf/in. Table 3-1 presents the load relaxation of the creep frame for various values of creep strains for the case when all nine sets of springs are used. The % load relaxation for an assumed load of 150,000 lbf was also calculated and shown in the table. Table 3-1 Load relaxation in the creep apparatus due to creep strain of concrete Creep strain Load relaxation (lbs) % of 150,000 lbs
0.5×10⁻⁵ 210 0.14
1.0×10⁻⁴ 420 0.28
5.0×10⁻⁴ 2100 1.4
1.0×10⁻³ 4200 2.8
2.0×10⁻³ 8400 5.6
As seen from Table 3-1, re-adjustment of load is necessary to maintain the load constant on the concrete specimens if the creep strain of the concrete specimens is very high. 3.2.4 Stresses in the Steel Rods of the Creep Apparatus
When the concrete specimens are loaded in the creep frame, each of the four steel rods will carry one quarter of total load. The steel rods are 1.125 in. in diameter and are made of a high-strength alloy steel with a yield strength of 105,000 psi. If the concrete
36
specimens were loaded up to the maximum capacity of the creep apparatus of 192,000 lbf, the maximum stress in the steel rods would be equal to: 192,000 / (4 × 0.56252 ×π) = 48,300 psi This maximum possible stress in the steel rod is less than half of the yield strength of the steel of 105,000 psi. 3.2.5 Circular Steel Plates
As the concrete specimens are loaded in the creep frame, the rectangular steel plates, which are at the top and bottom of the test specimens, are deflected slightly. To keep the loading surfaces flat and the test specimens vertical when the load is applied, two 1-inch thick circular steel plates with a diameter of 6 inches are placed on the top and bottom of the stack of concrete test specimens, as shown in Figure 3-1.
3.3 Gage-Point Positioning Guide Three pairs of gage points with a gage distance of 10 inches are to be placed in each test concrete specimen. A mechanical strain gage (formerly known as Whittemore gage) is to be used to measure the change in distance between the gage points, which is the creep of the concrete specimen during the creep test. A gage-point positioning guide, as shown in Figure 3-3, was designed for use in positioning the gauge-points on the plastic cylinder mold. The guide can be placed around a 6"×12" cylinder mold. By tightening the six screws on the guide, the precise locations for the three pairs of gage points, with a gage distance of 10 inches, can be marked conveniently on the mold. Figure 3-4 shows the picture of gauge-position guide. Figure 3-5 shows a picture with the plastic cylinder mold inside the gauge-position guide.
37
Φ6.05”
120o
120o
120o
10”
Figure 3-3. Gage-point positioning guide
38
Figure 3-4. Gauge-position guide
39
Figure 3-5. Plastic cylinder mold inside gauge-position guide
40
3.4 Alignment Frame An alignment frame was designed and constructed to be used to align the concrete specimens in a vertical direction when they are placed in the test frame and cemented together with an epoxy. Figure 3-6 shows the design of the alignment frame. The alignment frame consists of one piece of angle steel and one piece of channel steel with three pieces of 0.5"×2"×10" steel plates welded on them respectively. They are connected together by using 6 steel rods. The use of the alignment frame is described in Chapter 4.
41
4.00in 4.00in
Φ0.5in
12.00in
2.00in
Figure 3-6. Schematics of the alignment frame
12.00in
2.00in
12.00in
42
0.19in
3.00in
0.19in Φ0.5in 5.00in 8.00in
1.75in
1.5in
0.5in 10.00in 0.5in
Φ0.5in
Chapter 4 EXPERIMENTAL PROGRAMS
4.1 Introduction This chapter describes the mix proportions and the mix ingredients of the concrete mixtures evaluated in this study. The method of preparation of the concrete mixtures, fabrication of the test specimens and testing procedures used in this study are also presented.
4.2 Concrete Mixtures Evaluated 4.2.1 Mix Proportions
Typical Class II, IV, V and VI concrete mixtures made with normal-weight and lightweight aggregates used in Florida were selected to be evaluated for their mechanical properties, including compressive strength, splitting tensile strength, modulus of elasticity, shrinkage behavior and creep characteristics. Because of time constraint, only ten mixtures were investigated. Two different types of coarse aggregates produced in Florida, including a normal-weight limestone aggregate and a lightweight aggregate, were used in this study. The mix proportions for the ten mixtures tested are presented in Table 4-1.
43
Table 4-1. Mix proportions of the ten concrete mixtures evaluated Admixtures No. of Mix
W/C
Cement (lbs/yd3)
Fly ash (lbs/yd3)
Flyash Flyash + Cement
Slag (lbs/yd3)
Slag Slag+ Cement
Water (lbs/yd3)
FA (lbs/yd3)
CA (lbs/yd3)
Mix-1
0.24
799.9
200.1
20%
---
---
236.0
931.4
1678.7
Mix-2
0.31
602.1
149.9
20%
---
---
235.3
952
1238.6
Mix-3
0.33
656.1
143.9
20%
---
---
265.6
905.3
1740
44
Mix-4
0.33
400
---
---
400
50%
262
1062
1750
Mix-5
0.41
494
123
20%
---
----
254
1175
1747
Mix-6
0.39
282
---
---
423
60%
275
853
1300
Mix-7
0.36
380
---
---
380
50%
270
1049
1736
Mix-8
0.41
197
---
---
461
70%
267
1121
1750
Mix-9
0.44
306
---
---
306
50%
269
1206
1710
Mix10
0.37
600
152
20%
---
---
278
1000
1774
Note: AE-air entraining admixture
AE 7.5 OZ 9.6 OZ 12.0 OZ 6.0 OZ 0.5 OZ 8.8 OZ 1.9 OZ 4.6 OZ 3.1 OZ 2.0 OZ
WRDA /ADVA (WRDA60)30OZ (ADVA120)60OZ (WRDA64) -30OZ (WRDA60) -30OZ (WRDA60)24OZ (ADVA120)48OZ (WRDA60)33.4OZ (WRDA64)31.7OZ (ADVA120) -38OZ (WRDA60)32.9OZ (WRDA60)30.6OZ (WRDA60) -56OZ
4.2.2 Mix Ingredients
The mix ingredients used in producing the concrete mixtures are described as follows: Water
Potable water is used as mixing water for production of the concrete mixtures. Cement
Type-I Portland cement from CEMEX Company was used. The physical and chemical properties of the cement used are shown in Table 4-2 and Table 4-3. Fly ash
The fly ash used in this study was provided by Boral Company. The physical and chemical properties of the fly ash used are shown in Table 4-4. Slag
The slag used in this study was provided by Lafarge Company. Its physical and chemical properties are shown in Table 4-5. Fine aggregate
The fine aggregate used was silica sand from Goldhead. The physical properties of the fine aggregate are shown in Table 4-6. The gradation of the fine aggregate is shown in Figure 4-1. The fine aggregate was oven-dried before it was mixed with the other mix ingredients in the production of the concrete mixtures. Coarse aggregates
Two different coarse aggregates were used in this study. One was a normal weight Miami Oolite. The other coarse aggregate was a lightweight aggregate called Stalite. The physical properties of these two coarse aggregates are displayed in Table 4-7. The
45
gradation of the Miami Oolite used is shown in Figure 4-2. The gradation of the Stalite lightweight aggregate is shown in Figure 4-3. The coarse aggregates were soaked in water for at least 48 hours and then drained off the excess water before they were mixed with the other mix ingredients in the production of the concrete mixtures. Air-entraining admixture
The air-entraining admixture used was Darex AEA from W.R. Grace & Co. Darex AEA is a liquid admixture for use as an air-entraining admixture, providing freeze thaw durability. It contains a catalyst for more rapid and complete hydration of Portland cement. As it imparts workability into the mix, Darex AEA is particularly effective with slag, lightweight, or manufactured aggregates which tend to produce harsh concrete. Water-reducing admixture
The water-reducing admixture used included WRDA60, WRDA64, and ADVA120 from W.R.Grace & Co. WRDA 60 is a polymer based aqueous solution of complex organic compounds producing a concrete with lower water content (typically 8-10% reduction), improved workability and higher strengths. It can be used in ready mix, job site and concrete paver plants for normal and lightweight concrete. It also can be used in block, precast and prestress work. In addition, it offers significant advantages over single component water reducers and performs especially well in warm and hot weather climates to maintain slump and workability in high ambient temperatures. WRDA 64 is a polymer based aqueous solution of organic compounds producing a concrete with lower water content (typically 8-10% reduction), greater plasticity and
46
higher strength. WRDA 64 performs especially well in concrete containing fly ash and other pozzolans.
4.3 Preparation of Concrete Specimens The concrete mixtures used in this study were produced in the laboratory using a 27cubic feet pan mixer. A picture of the mixer used is shown in Figure 4-4. Thirteen (13) cubic feet of fresh concrete was produce per batch. Fifty Eight (58) 6"×12" cylindrical specimens were made from each batch of concrete. The following procedures were followed: (1)
Measure out the coarse aggregate and fine aggregate, and two thirds of the water and the air-entraining admixture. Place them into the mixer and mix for 1 minute.
(2)
Measure out the cement, mineral admixtures, high-range water reducer and the rest of the water. Place them into the mixer and mix for three minutes, followed by a 2-minute rest. After a 2-minute rest, another 3minute mixing will follow.
(3)
Perform a slump test (ASTM C143) to determine whether or not the target slump has been reached. If the target slump is not satisfied, add some more water and/or water-reducing admixture to adjust slump of the fresh concrete. Re-mix the fresh concrete for two more minutes. Then, perform another slump test to check if the target slump has been reached. Repeat this procedure until the target slump is achieved.
47
Table 4-2. Physical properties of Type I cement Loss on Ignition (%) 1.5%
Insoluble Residue (%) 0.48%
Setting Time (min) 125/205
Fineness (m2/kg) 402.00
48
Compressive Strength at 3 days (psi) 2400 psi
Compressive Strength at 7days (psi) 2930 psi
Fe2O3 3.3%
C2S 13.8%
Table 4-3. Chemical ingredients of Type I cement Ingredients (%)
SiO2 20.3%
Al2O3 4.8%
CaO 63.9%
SO3 3.1%
Na2O-K2O 0.51%
MgO 2.0%
C3A 7%
C3S 59%
C4AF+C2F 15.8%
Table 4-4. Physical and chemical properties of fly ash SO3 (%) 0.3
Oxide of Si, Fe, Al (%) 84
Fineness (%) (ASTM C430) 32
Strength(7d) (ASTM C109) N/A
Strength (28d) (ASTM C109) (%) 78
Loss on Ignition (%) (ASTM C311) 4.3
% of Water (ASTM C-618) 102
Table 4-5. Physical and chemical properties of slag SO3 (%) 1.7%
Oxide of Si, Fe, Al N/A
Fineness (%) (ASTM C430) 4
Strength(7d) (%) (ASTM C109) 92%
Strength (28d) (ASTM C109) (%) 129
Loss on Ignition (%) (ASTM C311) N/A
% of water (ASTM C-618) N/A
Table 4-6. Physical properties of fine aggregate 49
Fineness Modulus 2.30
SSD Specific Gravity 2.644
Apparent Specific Gravity 2.664
Bulk Specific Gravity 2.631
Absorption 0.5%
Table 4-7. Physical properties of coarse aggregates Aggregate Miami Oolite Stalite
SSD Specific Gravity 2.431 1.55
Apparent Specific Gravity 2.541 -
Bulk Specific Gravity 2.360 -
Absorption 3.03% 6.6%
100
50
Cumulative percent passing (%)
90 80 70 60 50 40 30 20 10 0 #4
#8
#16
#30
#50
Size of sieve Figure 4-1. Gradation of Goldhead sand
#100
#200
100
51
Cumulative percent passing (%)
90 80 70 60 50 40 30 20 10 0 1.5"
1"
0.5"
4# Size of sieve
Figure 4-2. Gradation of Miami Oolite coarse aggregate
8#
200#
100
52
Cumulative percent passing (%)
90 80 70 60 50 40 30 20 10 0 1"
0.75"
0.5"
0.375"
Size of seive Figure 4-3. Gradation of stalite lightweight aggregate
#4
Figure 4-4. Concrete mixer used in this study
53
(4)
After the mixing procedure is completed, place the fresh concrete into 6"×12" plastic cylinder molds. If the slump of the fresh concrete is less
than 7 inches, fill each cylinder mold to one third of its height, and place the mold on a vibrating table for 45 seconds. Then fill the mold to another one third of its height, and place the mold on the vibrating table for 45 seconds. Then fill the mold fully, and place the mold on the vibrating table for 45 seconds. If the slump is more than 7 inches, fill each cylinder mold in three layers, and rod each layers manually 25 times, as specified in ASTM C31. (5)
Finish the surface of each concrete specimen with a trowel. Cover the top of the cylinder with a plastic sheet to keep moisture from evaporating.
(6)
Allow the concrete to cure in the cylinder molds for 24 hours before demolding. For concretes with very low compressive strength at 24 hours, allow another 24 hours of curing in the mold before demolding.
(7)
Place the demolded concrete specimens in the standard moist curing room for the specified curing times until testing.
4.4 Curing Conditions for Concrete Specimens The concrete specimens for compressive strength test, splitting tensile strength test, and elastic modulus test were cured in the standard moist room until the age to be tested. Two different curing conditions were applied to the concrete specimens for
54
shrinkage and creep tests. The first one is to cure the concrete specimens for 7 days in the moist room and followed by room condition for another 7 day. The second one is to cure the concrete specimens for 14 days in the moist room and followed by room condition for another 14 days.
4.5 Tests on Fresh Concrete and Properties of fresh concrete The tests to be run on fresh concrete are shown in Table 4-8. Table 4-8. The testing program on fresh concrete Test Test Standard
ASTM
Air Content ASTM
C143
C 173
Slump
Unit Weight
Setting Time
Temperature
ASTM
ASTM
ASTM
C138
C403/C 403M
C 1064
They are described as follows: Slump test
Slump test was performed in accordance with ASTM C143 standard. The slump value was used to evaluate the consistency of fresh concrete. Air content test
Air content test was performed in accordance with ASTM C 173 standard. The volumetric method was employed for this test. Unit weight test
The procedure of ASTM C138 standard was followed in running the unit weight test. This test was carried out to verify the density of concrete mixtures for quality control. Setting time test
55
ASTM C403/C 403M standard was followed to perform the setting time test. The mortar specimen for the setting time test was obtained by wet-sieving the selected portion of fresh concrete through a 4.75mm sieve. The Proctor penetration probe was employed for running this test. In this test, the initial setting time is determined when the penetration resistance equals 500 psi, and the final setting time is determined when the penetration resistance reaches 4000 psi. Temperature test
Temperature of the fresh concrete was determined in accordance with ASTM C 1064 standard. This test was used to ensure that the temperature of the fresh concrete was within the normal range, and that there was no unexpected condition in the fresh concrete. A digital thermometer was used to monitor the temperature of the concrete. Properties of fresh concrete
The properties of the fresh concrete for each of the ten mixtures are presented in Table 4-9. Table 4-9. Properties of fresh concrete Mix Number
Slump (in)
Air Content (%)
Unit Weight (lbs/yd3)
Initial
Final
mix-1
9.75
1.25
145.52
7h 0min
8h 50min
81
mix-2
2.5
3.0
117.7
5h 35min
7h 20min
80
mix-3 mix-4
4.25 9.0
4.5 3.75
137.7 141.6
-----
-----
73 78
mix-5
2.0
2.50
143.9
4h 55min
7h 15min
76
mix-6 mix-7
2.75 5.50
5.25 2.25
109.3 141.4
7h 45min 3h 10min
10h 0min 4h 55min
78 81
mix-8
5.75
5.5
138.0
---
---
79
mix-9
3.00
3.75
140.36
---
---
76
mix-10
3.00
2.0
143.8
---
---
74
Setting Time
56
Mixture Temperature (oF)
4.6 Tests on Hardened Concrete The tests to be run on the hardened concrete specimens are given in Table 4-10. Table 4-10. The testing program on hardened concrete Test
Compressive Strength
Test
ASTM
Splitting Tensile Strength ASTM
Standard
C 39
C 496
Elastic Modulus
Shrinkage
Creep
ASTM
Described
Described
C 469
in report
in report
These tests are described as follows: Compressive strength test
Compressive strength test is a routine test to evaluate the mechanical property of concrete. The test results can be used as a basis for quality control of concrete proportioning, mixing, and placing operations. The test procedure of ASTM C 39 standard was followed. For each concrete mixture, three replicate 6"×12" cylindrical specimens were tested for their compressive strength at the age of 3, 7, 14, 28, 56, and 91 days, with a total of 18 specimens tested. Before testing, the concrete cylinders were either sawed or ground at the ends in order to keep the two end surfaces even so as to support the load uniformly. The compressive strength of the test specimen is calculated by dividing the maximum load attained from the test by the cross-sectional area of the specimen, as shown by the following equation:
fi =
pi 4 pi = 2 π ⋅r π ⋅ D2
[Equation 4.1]
Where
57
f i − Ultimate compressive strength of cylinder i , psi; pi − Ultimate compressive axial load applied to cylinder i , lbs; D − Diameter of cylinder specimen, in. The average value of compressive strength from three cylinders will be taken as the compressive strength of the concrete. Splitting tensile strength test
The testing procedure of ASTM C 496 standard was followed in running the splitting tensile strength test. The concrete cylinders with the same dimension as that used for compressive strength test were employed for the split tensile strength test. The same curing conditions as those for the compressive strength test were used for the splitting tensile strength test. Three replicate specimens were tested at each of the curing times, which were 3, 7, 14, 28, 56, and 91 days. A total of 18 specimens per concrete mixture were tested for splitting tensile strength. Before testing, four lines were drawn on the sides of each specimen to mark the edges of the loaded plane. The marked lines were used to help align the test specimen before the load was applied. Figure 4-5 shows the loading configuration for this test.
12" 6"
Figure 4-5 Loading configuration for splitting tensile test
58
The splitting tensile strength of a cylinder specimen can be calculated by the following equation: Ti =
2 pi π ⋅l ⋅ D
[Equation 4.2]
Where T − Split tensile strength of cylinder i , psi; pi − Maximum applied load to break cylinder i , lbf. l − Length of cylinder, in;
D − Diameter of cylinder, in. The splitting tensile strength of concrete will take the average value of splitting tensile strengths of three cylinders. Due to the sensitivity and susceptibility of the splitting tensile strength to the effects of internal flaws, such as voids, the results of some splitting tensile strength tests may be unusually low and may need to be discarded. For this reason, five extra concrete cylinders were prepared for use in repeating this test if needed. Elastic modulus test
The testing procedure of ASTM C 469 standard was followed to determine the elastic modulus of the concrete specimens. In this method, the chord modulus of elasticity of concrete cylinders is determined when a compressive load is applied on a concrete cylinder in longitudinal direction. Figure 4-6 shows the equipment used to perform elastic modulus test. A compressometer equipped with a linear variable differential transformer (LVDT) was used to measure the deformation of the concrete cylinder during a compression test. The load and deformation data were recorded by
59
means of a computer data acquisition system. Throughout the test, the ambient temperature and relative humidity were maintained at 73 ºF and 100%, respectively.
Figure 4-6. Test set-up for performing the elastic modulus test Before performing the compressive strength test, two of three concrete cylinders used to perform compressive strength test were evaluated in the elastic modulus test. Prior to the test for modulus of elasticity, one of the three concrete cylinders was broken first to determine the compressive strength of concrete in accordance with ASTM C39 standard. Then, 40% of ultimate compressive strength of concrete specimen was applied on the concrete cylinders to perform the elastic modulus test. The cylinders for the modulus of elasticity test were loaded and unloaded three times. The data from the first load cycle were disregarded. The average value from the last two times was recorded as
60
the elastic modulus of the concrete. The elastic moduli of concrete at the ages of 3, 7, 14, 28, 56, and 91 days were evaluated. Shrinkage test
For each concrete mixture, six 6"×12" concrete cylinders were made to evaluate its shrinkage behavior. The cylinders were cured under the two different conditions. Three cylinders were cured for 7 days in the standard moist room, and then followed by a room condition curing for another 7 days. Another three cylinders were cured for 14 days in the moist room, and then cured for another 14 days in room condition. Three pairs of gauge points, which were spaced 10 inches apart, were placed on each of concrete cylinder. A gauge-point guide (as shown in Figure 3-4) was used to position the gauge points on the plastic cylinder mold before the concrete was placed. Figure 4-7 shows a picture of the concrete cylinders with the gauge points attached on them after the molds have been removed. A Whittemore gauge (as shown in Figure 4-8) was used to measure the change in the distance between the gage points as the concrete cylinder shrinks. The Whittemore gauge has a resolution of 0.0005 in. Three sets of measurements were taken from each specimen. A total of nine sets of measurements were taken from the three replicate specimens for each concrete mixture. Measurements were taken every day in the first week, and then once a week up to three months. The original distances between the gauges were measured immediately after the plastic mold was removed. The shrinkage measurement was taken as soon as
61
Figure 4-7. Concrete cylinders with gauge point installed on them the cylinders were brought out of the moist room. The shrinkage test was run under the conditions of the temperature of 73 ºF and 75% relative humidity. The shrinkage strain was taken as the average of the nine readings from the three replicate cylinders, and can be expressed as follows:
ε sh =
1 9 (l i − l 0 ) ∑ 9 i =1 l 0
[Equation 4.3]
Where li − Measured distance between ith pair of gage points l 0 − Original distance between ith pair of gage points measured immediately after demolding.
62
Figure 4-8. Whittemore gauge
Creep test
The preparation of specimens for the creep test was the same as that for the shrinkage test specimens, which was described in the previous section. Each creep test specimen contained three pairs of gage points, which were placed 10 inches apart from each other. For each concrete mixture, twelve 6"×12" cylinders were made to evaluate its creep behavior. Two curing conditions and two load levels were used. The two curing conditions were the same as those used on the specimens for the shrinkage test, as described in the previous section. The two load levels used include (1) 40% of the ultimate compressive strength of concrete at the loading age, and (2) 50% of the ultimate
63
compressive strength of concrete at the loading age. Three replicate specimens were used for each combination of curing condition and load level. Three replicate specimens were to be loaded in one creep apparatus. The following test procedures were followed: (1) For each set of three specimens to be loaded in a creep frame, cap one end of two specimens with sulfur. (2) Using the alignment frame, stack the three replicate specimens vertically on top of one another, with the ends with the sulfur capping at the top and the bottom of the stack. Cement the specimens together at the interface with a high strength and high modulus Epoxy, Sikadur 32 or 33. The Sikadur 32 or 33 epoxy was prepared by mixing a Part A (resin) with Part B (hardener). Apply the mixture within 15 minutes. A minimum of 24 hours is needed for curing of the epoxy before the specimens can be loaded in the creep apparatus. Steps (1) & (2) must be done one day before the specimens are to be loaded in the creep frame. (3) Put the stack of three concrete specimens into the creep frame and adjust creep frame and concrete specimen to make sure the specimens are centered and vertical. (4) Set up hydraulic jack and load cell in the creep frame, and check the position of hydraulic jack to make sure that it is in line with concrete specimens in order to avoid loading the concrete specimens eccentrically. (5) Apply the load through the hydraulic jack up to the target load. This should be done with a minimal amount of time in order to obtain a more accurate
64
instantaneous deformation of the concrete. Otherwise, substantial early creep deformation may take place before the initial reading can be taken. (6) After the target load is reached, tighten the four nuts on the top of the steel plate that is below the hydraulic jack uniformly to hold the load on the specimens. (7) Take initial readings with the Whittemore gage immediately after loading. Then take the measurement every day in the first week, and then once a week till 91 days. (8) Due to the load relaxation caused by shrinkage and creep deformation of the specimens, the load applied on specimens has to be adjusted in order to maintain the load as constant as possible. Adjust the load once a day in the first week, and then once a week in the first month, and then every month. The creep strain was calculated by subtracting the shrinkage strain from the the total strain as follows: T T 9 lS −lS 1 9 li − l 0(i ) i 0(i ) −∑ ε C = ε T − ε S = (∑ T ) S 9 i =1 l 0 (i ) l 0(i ) i =1
[Equation 4.4]
Where
ε C − Creep strain of concrete ε T − The sum of creep strain and shrinkage strain
ε S − Shrinkage strain of concrete l Ti − The measurement taken from the i th pair of gage points for creep test
l T0 ( i ) − The initial length of the i th pair of gage points for creep test
65
l iS − The measurement taken from the i th pair of gage points for shrinkage test
l 0S( i ) − The initial length of the i th pair of gage points for shrinkage test
i − No. of pair of gage points from 1 to 9 The creep coefficient is calculated by taking the ratio of creep strain of the concrete at the testing age to the computed elastic strain of the concrete at the same curing age. It can be expressed as follows: C cr =
εC εE
[Equation 4.5]
Where C cr − Creep coefficient
ε C − Creep strain of concrete ε E − Elastic strain of concrete
66
Chapter 5 RESULTS OF STRENGTH AND ELASTIC MODULUS TESTS
5.1 Introduction This chapter presents the analysis of the results of compressive strength, splitting tensile strength and elastic modulus tests on the ten concretes mixes evaluated in this study. The relationships among these three mechanical properties were also evaluated and presented in this chapter.
5. 2 Results of Compressive Strength Tests The average compressive strengths at various curing times of the ten concrete mixes evaluated are displayed in Table 5-1. The individual compressive strength values are shown in Table A-1 in Appendix A. Figure 5-1 shows the compressive strength development with time for the four concrete mixes containing 20 % fly ash. It can be seen that these fly ash mixes continue to grow in compressive strength up to 91 days. Mix 1, with a W/C of 0.24, has a compressive strength of about 12,400 psi at 91 days. The other three fly ash mixes with a W/C of 0.37 to 0.41 were close to each other in compressive strength, and have a compressive strength of 9,100 to 9,900 psi at 91 days. Figure 5-2 shows the compressive strength development with time for the four concrete mixes containing ground blast furnace slag as an additive. Three mixes contain
67
50% slag while one contains 70 % slag. It can be seen that strength development levels off after about 28 days. The two mixes containing 50 % slag and with a W/C of 0.33 and 0.36 (Mix 4 & Mix 7) have a compressive strength of 10,200 to 10,800 psi at 91 days. The two mixes with a W/C of 0.41 and 0.44 (Mix 8 and Mix 9) have a compressive strength of 8,200 to 8,700 psi at 91 days. Mix 8 with 70% slag gives a slightly lower compressive strength than Mix 9 with 50% slag, even though its W/C is lower. This can be explained by the higher slag and lower cement content of Mix 8. Figure 5-3 shows the compressive strength development with time for the two mixes using the lightweight aggregate Stalite. In comparison with the plots on Figures 51 and 5-2, it can be seen that the lightweight concretes have a relatively lower compressive strength as compared with the normal weight concretes with similar w/c and mineral additives. Mix 2, with a lightweight aggregate, a W/C of 0.36 and 20% fly ash, has a compressive strength of around 8,100 psi at 91 days, as compared with 9,100 to 9,900 psi for normal weight concretes with similar w/c and mineral additive. Mix 6, with a lightweight aggregate, W/C of 0.39 and 60% slag has a compressive strength of around 7,300 psi at 91 days, as compared with 8,200 to 8,700 psi for normal-weight concretes with similar W/C and mineral additive.
68
Table 5-1. Compressive strengths of the ten concrete mixtures evaluated (psi) Mix Number
69
mix-1 mix-2 mix-3 mix-4 mix-5 mix-6 mix-7 mix-8 mix-9 mix-10
3 N/A 3717 5700 6373 4879 1927 6203 2380 3177 5243
7 10314 4963 6746 8637 6073 3543 8580 5277 5693 6713
Age of Testing (days) 14 28 11087 11562 5995 6827 7487 7917 9475 10117 7183 7940 5063 6183 9613 10233 6747 7637 6940 7930 7853 8650
56 12068 7342 8663 10247 8810 7067 10527 8203 8317 9317
91 12401 8101 9083 10248 9310 7313 10787 8210 8663 9923
13000
70
Compressive strength (psi)
12000 11000 10000 9000 8000 Mix-1-W/C=0.24-20% Fly ash
7000
Mix-3-W/C=0.37-20% Fly ash
6000
Mix-5-W/C=0.41-20% Fly ash Mix-10-W/C=0.37-20% Fly ash
5000 4000 0
10
20
30
40
50
60
70
80
90
Age of testing (days) Figure 5-1. Development of compressive strength of concretes with fly ash as mineral additive
100
12000
71
Compressive strengh (psi)
10000
8000
6000 Mix-4-W/C=0.33-50% slag Mix-7-W/C=0.36-50% slag
4000
Mix-8-W/C=0.41-70% slag Mix-9-W/C=0.44-50% slag
2000
0 0
10
20
30
40
50
60
70
80
Age of testing (days)
Figure 5-2. Development of compressive strength of concretes with slag as mineral additive
90
100
9000
72
Compressive strength (psi)
8000 7000 6000 5000 Mix-2-W/C=0.31-20% Fly ash
4000
Mix-6-W/C=0.39-50% Slag
3000 2000 1000 0
10
20
30
40
50
60
70
80
90
Age of testing (days)
Figure 5-3. Development of compressive stength of lightweight aggregate concrete with time
100
5.3 Results of Splitting Tensile Strength Tests The average splitting tensile strengths at various curing times of the ten concrete mixes evaluated are displayed in Table 5-2. The individual splitting tensile strength values are shown in Table A-2 in Appendix A. Figure 5-4 shows the splitting tensile strength development with time for the four concrete mixes containing 20 % fly ash. It can be seen that these fly ash mixes continue to grow in splitting tensile strength up to 91 days. Mix 1, with a w/c ratio of 0.24, has a splitting tensile strength of 960 psi at 91 days. The other three fly ash mixes with a W/C of 0.37 to 0.41 have a splitting tensile strength of 730 to 840 psi at 91 days. Figure 5-5 shows the splitting tensile strength development with time for the four concrete mixes containing slag as additives. It can be seen that strength development slows down considerably after 28 days. The two mixes containing 50% slag and with a W/C of 0.33 and 0.36 (Mix 4 & Mix 7) have a splitting tensile strength of 750 to 800 psi at 91 days. The two mixes with a W/C of 0.41 and 0.44 (Mix 8 and Mix 9) have a splitting tensile strength of 640 to 680 psi at 91 days. Figure 5-6 shows the splitting tensile strength development with time for the two mixes using the lightweight aggregate Stalite. In comparison with the plots on Figures 54 and 5-5, it can be seen that the lightweight concretes have a relatively lower splitting tensile strength as compared with the normal-weight concretes with similar w/c and mineral additives. Mix 2, with a lightweight aggregate, W/C of 0.36 and 20% fly ash, has a splitting tensile strength of around 590 psi at 91 days. Mix 6, with a lightweight aggregate, W/C of 0.39 and 60% slag has a splitting tensile strength of around 610 psi at 91 days.
73
Table 5-2. Splitting tensile strengths of the ten concrete mixtures evaluated (psi) Mix Number
74
mix-1 mix-2 mix-3 mix-4 mix-5 mix-6 mix-7 mix-8 mix-9 mix-10
3 N/A 395 438 464 515 250 593 296 352 426
7 659 480 498 619 519 349 689 469 527 533
Age of Testing (days) 14 28 786 829 493 518 615 678 648 689 618 634 469 500 696 697 570 591 596 598 570 676
56 919 531 723 736 714 555 719 653 638 736
91 960 588 735 746 761 612 802 681 644 842
75
Splitting tensile strength (psi).
1000 900 800
700 600
Mix-1-W/C=0.24-20% Fly ash Mix-3-W/C=0.37-20% Fly ash Mix-5-W/C=0.41-20% Fly ash
500
Mix-10-W/C=0.37-20% Fly ash
400 0
10
20
30
40
50
60
70
80
Age of testing (days) Figure 5-4. Splitting tensile strength of normal weight concretes with fly ash as mineral additive
90
100
850
76
Splitting tensile strength (psi)
750
650
550 Mix-4-W/C=0.33-50% Slag Mix-7-W/C=0.36-50% Slag
450
Mix-8-W/C=0.41-70% Slag Mix-9-W/C=0.44-50% Slag
350
250 0
10
20
30
40 50 60 Age of testing (days)
70
80
90
Figure 5-5. Splitting tensile strength of normal weight concretes with slag as mineral additive
100
650
77
Splitting tensile stress (psi)
600 550 500 450
Mix-2-W/C=0.36-20% fly ash Mix-6-W/C=0.39-60% slag
400 350 300 250 200 0
10
20
30
40
50
60
70
80
90
Age of testing (days)
Figure 5-6. Development of splitting tensile strength of lightweight aggregate concrete with time
100
5.4 Results of Elastic Modulus Tests
The average elastic modulus values at various curing times of the ten concrete mixes evaluated are displayed in Table 5-3. The individual elastic modulus values are shown in Table A-3 in Appendix A. Figure 5-7 shows the elastic modulus development with time for the four concrete mixes containing 20 % fly ash. It can be seen that these fly ash mixes continue to grow in elastic modulus up to 91 days. Mix 1, with a W/C of 0.24, has an elastic modulus of 6.3 × 10⁶ psi at 91 days. The other three fly ash mixes with a W/C of 0.37 to 0.41 have an elastic modulus 5.0 to 5.5 × 10⁶ psi at 91 days. Figure 5-8 shows the elastic modulus development with time for the four concrete mixes containing slag as additives. It can be seen that the increase in elastic modulus slows down considerably after 28 days. The two mixes containing 50 % slag and with a W/C of 0.33 and 0.36 (Mix 4 & Mix 7) have an elastic modulus of 5.6 to 5.8 × 10⁶ psi at 91 days. The two mixes with a W/C of 0.41 and 0.44 (Mix 8 and Mix 9) have an elastic modulus of 4.9 to 5.2 × 10⁶ psi at 91 days. Figure 5-9 shows the elastic modulus development with time for the two mixes using the lightweight aggregate Stalite. In comparison with the normal-weight concretes, the lightweight concretes have a substantially lower elastic modulus. Mix 2, with a lightweight aggregate, W/C of 0.36 and 20% fly ash, has an elastic modulus of 3.5 × 10⁶ psi at 91 days. Mix 6, with lightweight aggregate, W/C of 0.39 and 60% slag has an elastic modulus of 3.3 × 10⁶ psi at 91 days.
78
Table 5-3. Elastic moduli of the ten concrete mixtures evaluated (×106psi)
79
Mix Number mix-1 mix-2 mix-3 mix-4 mix-5 mix-6 mix-7 mix-8 mix-9 mix-10
3 N/A 2.71 3.99 4.38 4.19 2.03 4.66 3.36 3.52 4.10
7 5.38 2.96 4.26 5.04 4.53 2.29 5.20 4.27 4.41 4.45
Age of Testing (days) 14 28 5.52 5.70 3.15 3.28 4.51 4.65 5.35 5.42 4.87 5.02 2.65 2.94 5.53 5.64 4.60 4.73 4.80 4.80 4.68 5.01
56 5.94 3.46 4.78 5.61 5.18 3.20 5.73 4.83 5.19 5.43
91 6.29 3.52 4.98 5.62 5.51 3.33 5.83 4.87 5.22 5.45
6.50E+06
80
Elastic modulus (psi)
6.00E+06
5.50E+06
5.00E+06
4.50E+06
Mix-1-W/C=0.24 Mix-3-W/C=0.37 Mix-5-W/C=0.41
4.00E+06
Mix-10-W/C=0.37
3.50E+06 0
10
20
30
40
50
60
70
80
90
Age of testing (days)
Figure 5-7. Elastic modulus of the normal weight concrete with fly ash as mineral additive
100
6.00E+06
81
Elastic modlus (psi)
5.50E+06
5.00E+06
4.50E+06 Mix-4-W/C=0.33 Mix-7-W/C=0.36
4.00E+06
Mix-8-W/C=0.41 Mix-9-W/C=0.44
3.50E+06
3.00E+06 0
10
20
30
40 50 60 Age of testing (days)
70
80
Figure 5-8. Elastic modulus of normal weight concrete with slag as mineral additive
90
100
4.00E+06
82
Elastic modulus (psi)
3.50E+06
3.00E+06 Mix-2-W/C=0.36-20% Fly ash Mix-6-W/C=0.39-60% Slag
2.50E+06
2.00E+06
1.50E+06 0
10
20
30
40 50 60 Age of testing (days)
70
80
Figure 5-9. Development of elastic modulus of lightweight aggregate concrete with time
90
100
5.5 Relationship between Compressive Strength and Splitting Tensile Strength
The compressive strengths of the normal-weight concretes evaluated in this study (as tabulated in Table A-1) were plotted against the corresponding splitting tensile strengths (as tabulated in Table A-2) for all curing conditions in Figure 5-10. Regression analyses to establish empirical relationship between compressive strength and splitting tensile strengths were performed using the following equations: f ct = A ⋅
f c'
[Equation 5.1]
( )
f ct = f c'
where fct
B
[Equation 5.2]
= splitting tensile strength (psi)
fc’
= compressive strength (psi)
A, B
= coefficients
The ACI Code 318 uses Equation 5.1 for estimation of splitting tensile strength of lightweight concrete, where the coefficient A is equal to 6.7 [ACI, 1983]. The investigation by Carino and Lew [Carino et al, 1982] determined that the coefficient A was approximately 6.49. They suggested that Equation 5.2 was better than Equation 5.1 in the estimation of splitting tensile strength from compressive strength. The coefficient B was determined to be 0.73 in their investigation. The results of the regression analyses are summarized in Table 5-4. The coefficient A (7.08) is slightly higher than both the values suggested by ACI (6.7) and the value by Carino and Lew (6.49). The coefficient B (0.72) is about the same as that suggested by Carino and Lew (0.73). These two developed regression equations are also plotted on Figure 5-10.
83
Table 5-4. Regression coefficients for equation relating compressive strength to splitting tensile strength Equation ACI Code f ct = A ⋅
f c'
A = 6 .7 Carino and Lew model
f ct = ( f c' )
B
Curing condition
Coefficient A or B
Standard Error
Moist curing
7.08
0.76
Moist curing
0.72
0.015
B = 0.73
84
1000 Modified ACI Code
900
85
Splitting tensile strength (psi)
Modified Carino and Lew
800 700 600 500 400 300 200 100 0 0
2000
4000
6000 8000 10000 Compressive strength (psi)
12000
14000
Figure 5-10. Relationship of compressive to splitting tensile strength for all curing conditions
16000
5.6 Relationship between Compressive Strength and Elastic Modulus
Regression analyses were performed to establish empirical relationships between the compressive strength and elastic modulus of the normal-weight concretes evaluated in this study using an equation of the following form: E = A ⋅ w1.5 ⋅
where E
f c'
[Equation 5.3]
= elastic modulus (psi)
fc’
= compressive strength (psi)
w
= density of concrete (pci)
A
= coefficient
ACI Code 318 [ACI, 1983] suggested a value of 33 for coefficient A to be used for the above equation. Table 5-5 summarizes the results of the regression analysis. It can be seen that the determined values for coefficient A for the various combinations of conditions are fairly close to the ACI suggested value of 33. The different curing times appear to have no significant effect on the coefficient of the regression equations. The regression equations for the fly ash concretes are also fairly close to those for the slag concretes. Figure 5-11 shows the plot of compressive strength versus elastic modulus of the concrete at 28 days, while Figure 5-12 shows a similar plot for the curing time of 91 days. Figure 5-13 shows the plot of compressive strength versus elastic modulus of concrete for all curing conditions.
86
Table 5-5. Regression coefficients for equations relating compressive strength to modulus of elasticity Equation
Curing Condition
additives
28-d moist curing
E = A ⋅ w1.5 ⋅
f c'
A = 33.00 Given by ACI 318-95
91-d moist curing
All curing conditions
87
Coefficient A Standard Error
Fly ash
31.61
1.81
Slag
32.80
0.72
Combined
32.21
1.35
Fly ash
32.35
0.98
Slag
33.31
0.54
Combined
32.83
0.77
Fly ash
32.17
1.55
Slag
33.54
2.29
Combined
33.02
1.93
7.00E+06 measurement
6.00E+06
combined concrete with fly ash
88
Elastic modulus (psi)
concrete with slag
5.00E+06 4.00E+06 3.00E+06 2.00E+06 1.00E+06 0.00E+00 0
2000
4000
6000 8000 Compressive strength (psi)
10000
12000
Figure 5-11. Relation between elastic modulus and compressive strength at the age of 28 days
14000
7.00E+06 measurement
6.00E+06
Concrete with fly ash
89
Elastic modulus (psi)
Concrete with slag
5.00E+06
Combined
4.00E+06 3.00E+06 2.00E+06 1.00E+06 0.00E+00 0
2000
4000
6000
8000
10000
12000
Compressive strength (psi) Figure 5-12. Relationship between compressive strength and elastic modulus at 91 days
14000
8.00E+06 Concrete with fly ash
7.00E+06
Concrete with slag
90
Elastic modulus (psi)
Combined
6.00E+06 5.00E+06 4.00E+06 3.00E+06 2.00E+06 1.00E+06 0.00E+00 0
2000
4000
6000
8000
10000
12000
14000
16000
18000
Compressive strength (psi) Figure 5-13. Relationship of compressive strength to elastic modulus for all curing conditions
Chapter 6 RESULTS OF SHRINKAGE AND CREEP TESTS
6.1 Introduction The test procedures and methods of computation for the shrinkage and creep strains and parameters have been presented in Chapter 4. This chapter presents the results of shrinkage measurements and creep tests on the ten concrete mixes evaluated in this study.
6.2 Results of Shrinkage Measurement Table 6-1 presents the measured shrinkage strains at the various ages for the ten concrete mixes evaluated in this study. One group of concrete specimens were moistcured for 7 days and then air-dried in the laboratory for the rest of the time. Another group of specimens were moist-cured for 14 days and then air-dried for the rest of the time. Figures 6-1 and 6-2 show the plots of shrinkage strains with time for the concretes using 20 % fly ash, with moist curing times of 7 and 14 days, respectively. It can be observed that the fly ash concretes with 14-day moist curing have lower shrinkage strains than those with 7-day moist curing. For example, for Mix 3, which has a w/c of 37 and 20 % fly ash, the shrinkage strain at 91 days is 0.00028 for the 14-day moist cured concrete and 0.00037 for the 7-day moist cured concrete. The shrinkage strains can also be noted to generally increase as the w/c increases.
91
Figures 6-3 and 6-4 present the plots of shrinkage strains with time for the concretes using 50 to 70 % slag, with moist curing times of 7 and 14 days, respectively. Unlike the fly ash concretes, the slag concretes with 14-day moist curing do not have significantly lower shrinkage strains than those with 7-day moist curing. When compared with Figures 6-1 and 6-2, it can be noted that the slag concretes have substantially lower shrinkage than the fly ash concretes of comparable w/c. For example, Mix 8, which has 70% slag and a w/c of 0.41, has a shrinkage strain of 0.00020 at 91 days for the 14-day moist cured specimens, while Mix 5, which has 20 % fly ash and a w/c of 0.41, has a shrinkage strain of 0.00032 at the same curing condition. Figures 6-5 and 6-6 present the plots of shrinkage strains with time for the two lightweight concretes with 7-day and 14-day moist curing, respectively. Mix 2, a lightweight concrete using 20 % fly ash, appears to have similar shrinkage as Mix 6, a lightweight concrete using 60 % slag. The longer moist curing period is also seen to reduce the shrinkage of the lightweight concretes. When compared with the normalweight concretes, these two lightweight concretes appear to have relatively higher shrinkage. For example, Mix 2, which has a lightweight aggregate, 20% fly ash and a w/c of 0.36, has a shrinkage strain of 0.00037 at 91 days for the 14-day moist cured specimens, while Mix 3, which has a normal-weight aggregate, 20% fly ash and a w/c of 0.37, has a shrinkage strain of 0.00028 at the same curing condition.
92
Table 6-1. Shrinkage strains of the ten concrete mixtures evaluated Mix Number Mix-1 Mix-2 Mix-3 Mix-4 93
Mix-5 Mix-6 Mix-7 Mix-8 Mix-9 Mix-10
Curing condition 7-day moist cure 14-day moist cure 7-day moist cure 14-day moist cure 7-day moist cure 14-day moist cure 7-day moist cure 14-day moist cure 7-day moist cure 14-day moist cure 7-day moist cure 14-day moist cure 7-day moist cure 14-day moist cure 7-day moist cure 14-day moist cure 7-day moist cure 14-day moist cure 7-day moist cure 14-day moist cure
3 -0.000070 -0.000031 -0.000087 -0.000062 -0.000027 -0.000038 -0.000037 -0.000089 0.000052 0.000041 0.000189 0.000105 0.000035 0.000033 0.000044 0.000076 0.000062 0.000083 N/A 0.000063
7 -0.000007 0.000007 -0.000103 -0.000063 -0.000039 -0.000061 -0.000043 -0.000099 0.000103 0.000066 0.000211 0.000129 0.000068 0.000051 0.000072 0.000089 0.000094 0.000108 N/A 0.000082
Age of testing (days) 14 28 0.000050 0.000100 0.000041 0.000079 0.000046 0.000191 -0.000022 0.000207 0.000142 0.000211 -0.00003 0.000127 0.000052 0.000120 -0.000027 0.000030 0.000157 0.000241 0.000127 0.000207 0.000253 0.000331 0.000158 0.000214 0.000112 0.000190 0.000071 0.000110 0.000111 0.000148 0.000106 0.000141 0.000108 0.000142 0.000129 0.000158 N/A N/A 0.000112 0.000151
56 0.000167 0.000146 0.000363 0.000343 0.000301 0.000219 0.000206 0.000099 0.000316 0.000264 0.000427 0.000309 0.000235 0.000137 0.000191 0.000174 0.000190 0.000183 N/A 0.000202
91 0.000202 0.000191 0.000469 0.000367 0.000371 0.000279 0.000236 0.000141 0.000334 0.000318 0.000459 0.000364 0.000262 0.000169 0.000218 0.000199 0.000226 0.000207 N/A 0.000260
4.00E-04 3.50E-04 3.00E-04
94
Shrinkage strain,
2.50E-04 2.00E-04 1.50E-04 1.00E-04
Mix-1-W/C=0.24
5.00E-05
Mix-5-W/C=0.41
Mix-3-W/C=0.37
0.00E+00 -5.00E-05 -1.00E-04
0
10
20
30
40
50
60
70
80
90
Age of testing (days)
Figure 6-1. Development of shrinkage strain of concretes with 20% fly ash (7-day moist curing)
100
3.50E-04 3.00E-04
95
Shrinkage strain.
2.50E-04 2.00E-04 1.50E-04 Mix-1-W/C=0.24
1.00E-04
Mix-3-W/C=0.37 Mix-5-W/C=0.41 Mix-10-W/C=0.37
5.00E-05 0.00E+00 0
10
20
30
40
50
60
70
80
90
-5.00E-05 -1.00E-04 Age of testing (days) Figure 6-2. Development of shrinkage strain of concrete with 20% fly ash (14-day moist curing)
100
3.00E-04 2.50E-04
96
Shrinkage strain.
2.00E-04 1.50E-04 1.00E-04
Mix-4-W/C=0.33-50% slag Mix-7-W/C=0.36-50% slag
5.00E-05
Mix-8-W/C=0.41-70% slag Mix-9-W/C=0.44-50% slag
0.00E+00 0
10
20
30
40
50
60
70
80
-5.00E-05 -1.00E-04 -1.50E-04 Age of testing (days) Figure 6-3. Development of shrinkage strain of concrete with slag (7-day moist curing)
90
100
2.50E-04 2.00E-04
97
Shrinkage strain.
1.50E-04 Mix-4-W/C=0.33-50% slag
1.00E-04
Mix-7-W/C=0.36-50% slag Mix-8-W/C=0.41-70% slag Mix-9-W/C=0.44-50% slag
5.00E-05 0.00E+00 0
10
20
30
40
50
60
70
80
-5.00E-05 -1.00E-04 Age of testing (days) Figure 6-4. Development of shrinkage strain of concrete with slag (14-day moist curing)
90
100
5.00E-04 4.00E-04
98
Shrinkage strain.
3.00E-04
Mix-2-W/C=0.36-20% fly ash Mix-6-W/C=0.39-60% slag
2.00E-04 1.00E-04 0.00E+00 0
10
20
30
40
50
60
70
80
-1.00E-04 -2.00E-04 Age of testing (days) Figure 6-5. Development of shrinkage strain of lightweight concrete (7-day moist curing)
90
100
4.00E-04 3.50E-04
99
Shrinkage strain.
3.00E-04 2.50E-04
Mix-2-W/C=0.36-20% fly ash Mix-6-W/C=0.39-60% slag
2.00E-04 1.50E-04 1.00E-04 5.00E-05 0.00E+00 -5.00E-05
0
10
20
30
40
50
60
70
80
-1.00E-04 Age of testing (days) Figure 6-6. Development of shrinkage strains of lightweight concete (14-day moist curing)
90
100
6.3 Results of Creep Tests Table 6-2 presents the measured and calculated results from the creep tests on the ten concrete mixes evaluated in this study. The results presented include the total strain, shrinkage strain, creep strain, elastic strain and creep coefficient at various loading ages. And the development of creep strain with time for each of ten mixtures is presented in Appendix B. The shrinkage strain is the additional shrinkage strain experienced by a test specimen after it has been loaded in the creep frame. It is obtained by subtracting the measured shrinkage strain at the start of the creep test from the total measured shrinkage strain at the specified age. The creep strain is obtained by subtracting the shrinkage strain from the total strain measured from the test specimen. The elastic strain is obtained by dividing the applied stress by the elastic modulus of the concrete at that time. The creep coefficient is the ratio of the creep strain to the elastic strain. The concrete creep test specimens from each concrete mix were loaded at two different curing times (14 and 28 days) and at two load levels (40 and 50% of ultimate strength). Figures 6-7 through 6-10 show the plots of creep coefficient versus loading time for the concretes with 20 % fly ash for the four combinations of curing times and load levels. Figures 6-11 through 6-14 show similar plots of creep coefficient for the concretes with 50 or 70 % slag. Figures 6-15 through 6-18 show similar plots for the lightweight concretes. The following observations can be made from these data: (1) The creep coefficient is generally lower for a concrete with a lower w/c.
100
(2) The creep coefficient of a concrete with slag is generally lower than that for a concrete with fly ash, for comparable w/c. (3) The creep coefficients of lightweight concretes are substantially lower than those of normal-weight concretes. (4) The creep coefficient does not vary linearly with load level. As the load increases from 40% to 50% of ultimate load, the creep coefficient increases more than proportionally. For example, for Mix 8 (with 70 % slag and w/c of 0.41) loaded at 14 days, the creep coefficient was 1.374 at 40 % load level, while it was 2.242 at 50 % load level. The creep coefficient increased by 63 % while the applied load increased by 10 %. (5) With the exception of Mix 1 with a low w/c of 0.24, the creep coefficients of the other nine concrete mixes appeared to continue to increase significantly beyond 91 days. (6) Three of the ten concrete mixes (Mixes 8, 9 and 10) had creep coefficients exceeding the value of 2.0 at 91 days. At least two other concrete mixes (Mixes 3 and 5) had predicted creep coefficients exceeding 2.0 at one year.
101
Table 6-2. Measured and calculated results from creep tests No. of Mix
Curing condition
Load level
40% 7-day moist cure 102
50%
Mix-1
40% 14-day moist cure 50%
strain Total Shrinkage Creep Elastic Creep coefficient Total Shrinkage Creep Elastic Creep coefficient Total Shrinkage Creep Elastic Creep coefficient Total Shrinkage Creep Elastic Creep coefficient
Age of testing (days) 14 28 0.000464 0.000571 0.000102 0.000150 0.000362 0.000421 0.000804 0.000804
3 0.000242 0.000036 0.000206 0.000804
7 0.000352 0.000053 0.000299 0.000804
56 0.000703 0.000178 0.000523 0.000804
91 0.000777 0.000210 0.000567 0.000804
0.256
0.372
0.450
0.524
0.653
0.705
0.000224 0.000026 0.000198 0.000804
0.000308 0.000053 0.000256 0.000804
0.000467 0.000102 0.000365 0.000804
0.000598 0.000150 0.000448 0.000804
0.000738 0.000178 0.000560 0.000804
0.000809 0.000210 0.000599 0.000804
0.246
0.318
0.454
0.558
0.696
0.745
0.000165 0.000036 0.000129 0.000811
0.000212 0.000038 0.000174 0.000811
0.000294 0.000070 0.000224 0.000811
0.000397 0.000097 0.000300 0.000811
0.000527 0.000137 0.000390 0.000811
0.000591 0.000154 0.000437 0.000811
0.16
0.21
0.28
0.37
0.48
0.54
N/A N/A N/A N/A
N/A N/A N/A N/A
N/A N/A N/A N/A
N/A N/A N/A N/A
N/A N/A N/A N/A
N/A N/A N/A N/A
N/A
N/A
N/A
N/A
N/A
N/A
Continued
40% 7-day moist cure
103
50% Mix-2
40% 14-day moist cure 50%
Total Shrinkage Creep Elastic Creep coefficient Total Shrinkage Creep Elastic Creep coefficient Total Shrinkage Creep Elastic Creep coefficient Total Shrinkage Creep Elastic Creep coefficient
0.000336 0.000060 0.000276 0.000761
0.000451 0.000094 0.000357 0.000761
0.000614 0.000144 0.000470 0.000761
0.000803 0.000273 0.000530 0.000761
0.000988 0.000407 0.000581 0.000761
0.001062 0.000423 0.000639 0.000761
0.362
0.469
0.618
0.697
0.763
0.839
0.000326 0.000060 0.000266 0.000761
0.000464 0.000094 0.000372 0.000761
0.000630 0.000134 0.000496 0.000761
0.000845 0.000273 0.000572 0.000761
0.001058 0.000407 0.000651 0.000761
0.001154 0.000423 0.000731 0.000761
0.349
0.489
0.652
0.751
0.855
0.960
0.000250 0.000056 0.000194 0.000833
0.000355 0.000085 0.00027 0.000833
0.000496 0.000123 0.000373 0.000833
0.000633 0.000184 0.000449 0.000833
0.000793 0.000228 0.000565 0.000833
0.000898 0.000243 0.000655 0.000833
0.233
0.324
0.448
0.539
0.679
0.788
0.000330 0.000056 0.000274 0.000833
0.000479 0.000085 0.000394 0.000833
0.000652 0.000123 0.000529 0.000833
0.000798 0.000184 0.000614 0.000833
0.001008 0.000228 0.000780 0.000833
0.001126 0.000243 0.000883 0.000833
0.329
0.473
0.635
0.738
0.937
1.061
Continued
40% 7-day moist cure 50% 104 Mix-3
40% 14-day moist cure 50%
Total Shrinkage Creep Elastic Creep coefficient Total Shrinkage Creep Elastic Creep coefficient Total Shrinkage Creep Elastic Creep coefficient Total Shrinkage Creep Elastic Creep coefficient
0.000271 0.000038 0.000233 0.000640
0.000488 0.000042 0.000446 0.000640
0.000560 0.000048 0.000512 0.000640
0.000800 0.000100 0.000700 0.000640
0.001000 0.000184 0.000816 0.000640
0.001111 0.000232 0.000879 0.000640
0.364
0.697
0.800
1.094
1.275
1.374
0.000352 0.000038 0.000314 0.000640
0.000645 0.000042 0.000603 0.000640
0.000767 0.000048 0.000719 0.000640
0.001043 0.000100 0.000943 0.000640
0.001328 0.000184 0.001144 0.000640
0.001441 0.000232 0.001209 0.000640
0.491
0.942
1.123
1.474
1.787
1.889
0.000367 0.000092 0.000275 0.000680
0.000495 0.000021 0.000474 0.000680
0.000565 0.000032 0.000533 0.000680
0.000697 0.000072 0.000625 0.000680
0.000845 0.000123 0.000722 0.000680
0.001019 0.000138 0.000881 0.000680
0.405
0.697
0.784
0.919
1.0618
1.296
0.000462 0.000092 0.000370 0.000680
0.000643 0.000021 0.000622 0.000680
0.000782 0.000032 0.000750 0.000680
0.000958 0.000072 0.000886 0.000680
0.001161 0.000123 0.001038 0.000680
0.001351 0.000138 0.001213 0.000680
0.544
0.915
1.103
1.303
1.527
1.784
Continued
40% 7-day moist cure 50% 105 Mix-4
40% 14-day moist cure 50%
Total Shrinkage Creep Elastic Creep coefficient Total Shrinkage Creep Elastic Creep coefficient Total Shrinkage Creep Elastic Creep coefficient Total Shrinkage Creep Elastic Creep coefficient
0.000213 0.000079 0.000136 0.000710
0.000282 0.000084 0.000198 0.000710
0.000361 0.000131 0.00023 0.000710
0.000488 0.00017 0.000318 0.000710
0.000684 0.000228 0.000456 0.000710
0.000830 0.000274 0.000556 0.000710
0.1912
0.280
0.325
0.448
0.645
0.784
0.000253 0.000079 0.000176 0.000710
0.000371 0.000084 0.000287 0.000710
0.000501 0.000131 0.00037 0.000710
0.000677 0.000170 0.000507 0.000710
0.000924 0.000228 0.000696 0.000710
0.001046 0.000274 0.000772 0.000710
0.248
0.405
0.522
0.715
0.982
1.088
0.000162 0.00007 0.000092 0.000763
0.000204 0.000084 0.000120 0.000763
0.000288 0.000109 0.000179 0.000763
0.000436 0.000144 0.000292 0.000763
0.000666 0.000210 0.000456 0.000763
0.000796 0.000230 0.000566 0.000763
0.121
0.157
0.235
0.383
0.598
0.742
0.000217 0.000070 0.000147 0.000763
0.000249 0.000084 0.000165 0.000763
0.000348 0.000109 0.000239 0.000763
0.000489 0.000144 0.000345 0.000763
0.000720 0.000210 0.000510 0.000763
0.000836 0.000230 0.000606 0.000763
0.192
0.216
0.313
0.452
0.668
0.794
Continued
40% 7-day moist cure
106
50% Mix-5
40% 14-day moist cure 50%
Total Shrinkage Creep Elastic Creep coefficient Total Shrinkage Creep Elastic Creep coefficient Total Shrinkage Creep Elastic Creep coefficient Total Shrinkage Creep Elastic Creep coefficient
0.000302 0.000061 0.000241 0.000590
0.000456 0.000113 0.000342 0.000590
0.000570 0.000167 0.000403 0.000590
0.000901 0.000251 0.000650 0.000590
0.001106 0.000326 0.000780 0.000590
0.001236 0.000364 0.000872 0.000590
0.409
0.580
0.683
1.101
1.320
1.476
0.000466 0.000061 0.000405 0.000590
0.000626 0.000113 0.000512 0.000590
0.000792 0.000167 0.000626 0.000590
0.001040 0.000251 0.000789 0.000590
0.001329 0.000326 0.001003 0.000590
0.001469 0.000364 0.001105 0.000590
0.685
0.867
1.059
1.336
1.698
1.871
0.000321 0.000036 0.000285 0.000632
0.000424 0.000041 0.000383 0.000632
N/A N/A N/A N/A
0.000713 0.000123 0.000590 0.000632
0.000910 0.000176 0.000734 0.000632
0.001093 0.000196 0.000897 0.000632
0.451
0.606
N/A
0.934
1.161
1.419
0.000571 0.000036 0.000535 0.000632
0.00077 0.000041 0.000729 0.000632
N/A N/A N/A N/A
0.001041 0.000123 0.000918 0.000632
0.001221 0.000176 0.001045 0.000632
0.00133 0.000196 0.001134 0.000632
0.847
1.153
N/A
1.453
1.653
1.794
Continued
40% 7-day moist cure
107
50% Mix-6
40% 14-day moist cure 50%
Total Shrinkage Creep Elastic Creep coefficient Total Shrinkage Creep Elastic Creep coefficient Total Shrinkage Creep Elastic Creep coefficient Total Shrinkage Creep Elastic Creep coefficient
0.000229 0.000172 5.69E-05 0.000751
0.000400 0.000211 0.000189 0.000751
0.000521 0.000253 0.000268 0.000751
0.000686 0.000331 0.000355 0.000751
N/A N/A N/A N/A
0.000997 0.000459 0.000538 0.000751
0.076
0.252
0.357
0.473
N/A
0.717
0.000421 0.000172 0.000249 0.000751
0.000609 0.000211 0.000398 0.000751
0.000768 0.000253 0.000515 0.000751
0.000942 0.000331 0.000611 0.000751
N/A N/A N/A N/A
0.001277 0.000459 0.000818 0.000751
0.332
0.531
0.686
0.815
N/A
1.090
0.000293 0.000105 0.000188 0.000802
0.000360 0.000129 0.000231 0.000802
0.000506 0.000158 0.000348 0.000802
0.000649 0.000214 0.000435 0.000802
0.000883 0.000318 0.000565 0.000802
0.001028 0.000364 0.000664 0.000802
0.235
0.289
0.434
0.544
0.707
0.830
0.000297 0.000105 0.000192 0.000802
0.000356 0.000129 0.000227 0.000802
0.000442 0.000158 0.000284 0.000802
0.000558 0.000214 0.000344 0.000802
0.000773 0.000318 0.000455 0.000802
0.000931 0.000364 0.000567 0.000802
0.240
0.283
0.355
0.430
0.569
0.709
Continued
40% 7-day moist cure
108
50% Mix-7
40% 14-day moist cure 50%
Total Shrinkage Creep Elastic Creep coefficient Total Shrinkage Creep Elastic Creep coefficient Total Shrinkage Creep Elastic Creep coefficient Total Shrinkage Creep Elastic Creep coefficient
0.000159 0.000032 0.000127 0.000681
0.000283 0.000058 0.000225 0.000681
0.000328 0.000075 0.000253 0.000681
0.000419 0.000135 0.000284 0.000681
0.000554 0.000187 0.000367 0.000681
0.000664 0.000202 0.000462 0.000681
0.187
0.331
0.372
0.417
0.540
0.680
0.000203 0.000032 0.000171 0.000681
0.000351 0.000052 0.000299 0.000681
0.000449 0.000095 0.000354 0.000681
0.000559 0.000145 0.000414 0.000681
0.000661 0.000187 0.000474 0.000681
0.000767 0.000202 0.000565 0.000681
0.252
0.440
0.520
0.609
0.697
0.830
0.000163 0.000010 0.000154 0.000720
0.000252 0.000026 0.000226 0.000720
0.000301 0.000039 0.000262 0.000720
0.000368 0.000052 0.000316 0.000720
0.000460 0.000073 0.000387 0.000720
0.000617 0.000103 0.000514 0.000720
0.214
0.314
0.364
0.438
0.537
0.713
0.000236 0.000010 0.000226 0.000720
0.000330 0.000026 0.000304 0.000720
0.000450 0.000039 0.000411 0.000720
0.000546 0.000052 0.000493 0.000720
0.000662 0.000073 0.000589 0.000720
0.000836 0.000103 0.000733 0.000720
0.314
0.422
0.571
0.685
0.818
1.017
Continued
40% 7-day moist cure
109
50% Mix-8
40% 14-day moist cure 50%
Total Shrinkage Creep Elastic Creep coefficient Total Shrinkage Creep Elastic Creep coefficient Total Shrinkage Creep Elastic Creep coefficient Total Shrinkage Creep Elastic Creep coefficient
0.000344 0.000060 0.000284 0.000413
0.000391 0.000072 0.000319 0.000413
0.000444 0.000110 0.000334 0.000413
0.000511 0.000148 0.000363 0.000413
0.000616 0.000191 0.000425 0.000413
0.000756 0.000218 0.000538 0.000413
0.626
0.711
0.808
0.929
1.119
1.374
0.000493 0.000060 0.000433 0.000413
0.000573 0.000072 0.000501 0.000413
0.000661 0.000110 0.000551 0.000413
0.000779 0.000148 0.000631 0.000413
0.001031 0.000191 0.000840 0.000413
0.001233 0.000218 0.001015 0.000413
0.896
1.042
1.203
1.416
1.875
2.242
0.000183 0.000066 0.000117 0.000422
0.000281 0.000089 0.000192 0.000422
0.000323 0.000106 0.000217 0.000422
0.000427 0.000141 0.000286 0.000422
0.000580 0.000174 0.000406 0.000422
0.000776 0.000199 0.000577 0.000422
0.291
0.446
0.513
0.677
0.921
1.231
0.000257 0.000066 0.000191 0.000422
0.000314 0.000089 0.000225 0.000422
0.000430 0.000106 0.000324 0.000422
0.000557 0.000141 0.000416 0.000422
0.000743 0.000174 0.000569 0.000422
0.000989 0.000199 0.000790 0.000422
0.407
0.499
0.683
0.884
1.180
1.570
Continued
40% 7-day moist cure
110
50% Mix-9
40% 14-day moist cure 50%
Total Shrinkage Creep Elastic Creep coefficient Total Shrinkage Creep Elastic Creep coefficient Total Shrinkage Creep Elastic Creep coefficient Total Shrinkage Creep Elastic Creep coefficient
0.000217 0.000023 0.000194 0.000550
0.000331 0.000030 0.000301 0.000550
0.000443 0.000036 0.000407 0.000550
0.000569 0.000073 0.000496 0.000550
0.000820 0.000118 0.000702 0.000550
0.001046 0.000167 0.000879 0.000550
0.352
0.547
0.741
0.902
1.2762
1.597
0.000443 0.000023 0.000420 0.000550
0.000539 0.000030 0.000509 0.000550
0.000647 0.000036 0.000611 0.000550
0.000834 0.000073 0.000761 0.000550
0.001133 0.000118 0.001015 0.000550
0.001349 0.000167 0.001182 0.000550
0.764
0.925
1.110
1.384
1.846
2.149
0.000243 0.000009 0.000235 0.000640
0.000312 0.000011 0.000301 0.000640
0.000402 0.000017 0.000385 0.000640
0.000579 0.000026 0.000553 0.000640
0.000867 0.000043 0.000824 0.000640
0.001059 0.000063 0.000996 0.000640
0.367
0.471
0.602
0.864
1.287
1.556
0.000369 0.000009 0.000360 0.000640
0.000453 0.000011 0.000442 0.000640
0.000557 0.000017 0.000540 0.000640
0.000726 0.000026 0.000700 0.000640
0.001128 0.000043 0.001085 0.000640
0.001336 0.000063 0.001273 0.000640
0.563
0.691
0.843
1.093
1.695
1.988
Continued
40% 7-day moist cure 50% 111 Mix-10
40% 14-day moist cure 50%
Total Shrinkage Creep Elastic Creep coefficient Total Shrinkage Creep Elastic Creep coefficient Total Shrinkage Creep Elastic Creep coefficient Total Shrinkage Creep Elastic Creep coefficient
0.000568 0.000073 0.000495 0.000670
0.000709 0.000102 0.000607 0.000670
0.000837 0.000122 0.000715 0.000670
0.001171 0.000168 0.001003 0.000670
0.001359 0.000202 0.001157 0.000670
0.001531 0.000250 0.001281 0.000670
0.738
0.906
1.0667
1.497
1.727
1.912
0.000900 0.000073 0.000827 0.000670
0.001158 0.000102 0.001056 0.000670
0.001306 0.000122 0.001184 0.000670
0.001674 0.000170 0.001504 0.000670
0.001853 0.000202 0.001651 0.000670
0.001942 0.000250 0.001692 0.000670
1.234
1.576
1.767
2.245
2.465
2.526
0.000843 0.000062 0.000781 0.000680
0.001000 0.000102 0.000898 0.000680
0.001211 0.000128 0.001083 0.000680
0.001274 0.000151 0.001123 0.000680
0.001484 0.00021 0.001274 0.000680
0.001637 0.00026 0.001377 0.000680
1.149
1.321
1.593
1.652
1.874
2.025
0.000910 0.000062 0.000848 0.000680
0.001196 0.000102 0.001094 0.000680
0.001526 0.000128 0.001398 0.000680
0.001782 0.000151 0.001631 0.000680
0.001933 0.000202 0.001731 0.000680
0.002213 0.00026 0.001953 0.000680
1.247
1.608
2.055
2.399
2.546
2.873
2.50 Mix-1-W/C=0.24
2.00
Mix-3-W/C=0.37 Mix-5-W/C=0.41
112
Creep coefficient
Mix-10-W/C=0.37
1.50
1.00
0.50
0.00 0
10
20
30
40
50
60
70
80
90
Age of testing (days)
Figure 6-7. Creep coefficient of concrete with 20% fly ash (7-day moist curing, 40% load level)
100
3.00 Mix-1-W/C=0.24 Mix-3-W/C=0.37
2.50
Mix-5-W/C=0.41
113
Creep coefficient
Mix-10-W/C=0.37
2.00 1.50 1.00 0.50 0.00 0
10
20
30
40
50
60
70
80
90
Age of testing (days) Figure 6-8. Creep coefficient of concrete with 20% fly ash (7-day moist curing, 50% load level)
100
2.50 Mix-1-W/C=0.24 Mix-3-W/C=0.37
2.00
Mix-5-W/C=0.41
114
Creep coefficient
Mix-10-W/C=0.37
1.50
1.00
0.50
0.00 0
10
20
30
40
50
60
70
80
90
Age of testing (days) Figure 6-9. Creep coefficient of concrete with 20% fly ash (14-day moist curing, 40% load level)
100
3.50 3.00
115
Creep coefficient
2.50 2.00 1.50 Mix-3-W/C=0.37
1.00
Mix-5-W/C=0.41 Mix-10-W/C=0.37
0.50 0.00 0
10
20
30
40 50 60 70 80 90 Age of testing (days) Figure 6-10. Creep coefficient of concrete with fly ash (14-day moist curing, 50% load level)
100
1.80 1.60
Mix-4-W/C=0.33-50% slag Mix-7-W/C=0.36-50% slag Mix-8-W/C=0.41-70% slag
1.40
116
Creep coefficient
Mix-9-W/C=0.44-50% slag
1.20 1.00 0.80 0.60 0.40 0.20 0.00 0
10
20
30
40
50
60
70
80
Age of testing (days) Figure 6-11. Creep coefficient of concretes with slag (7-day moist curing, 40% load level)
90
100
2.50 Mix-4-W/C=0.33-50% slag Mix-7-W/C=0.36-50% slag
2.00
Mix-8-W/C=0.41-70% slag
117
Creep coefficient
Mix-9-W/C=0.44-50% slag
1.50
1.00
0.50
0.00 0
10
20
30
40 50 60 Age of testing (days)
70
80
Figure 6-12. Creep coefficient of concrete with slag (7-day moist curing, 50% load level)
90
100
1.80 Mix-4-W/C=0.33-50% slag
1.60
Mix-7-W/C=0.36-50% slag Mix-8-W/C=0.41-70% slag
118
Creep coefficient
1.40
Mix-9-W/C=0.44-50% slag
1.20 1.00 0.80 0.60 0.40 0.20 0.00 0
10
20
30
40
50
60
70
80
90
Age of testing (days) Figure 6-13. Creep coefficient of concrete with slag (14-day moist curing, 40% load level)
100
2.50 Mix-4-W/C=0.33-50% slag Mix-7-W/C=0.36-50% slag Mix-8-W/C=0.41-70% slag
119
Creep coeffiicent
2.00
Mix-9-W/C=0.44-50% slag
1.50
1.00
0.50
0.00 0
10
20
30
40
50
60
70
80
90
Age of testing (days) Figure 6-14. Creep coefficient of concrete with slag (14-day moist curing, 50% load level)
100
0.9 0.8
120
Creep coefficient
0.7 0.6 0.5 0.4 Mix-2-W/C=0.36-20% fly ash Mix-6-W/C=0.39-60% slag
0.3 0.2 0.1 0 0
10
20
30
40 50 60 Age of testing (days)
70
80
90
Figure 6-15. Creep coefficient of lightweight concretes (7-day moist curing, 40% load level)
100
1.20
121
Creep coefficient
1.00 0.80 Mix-2-W/C=0.36-20% fly ash
0.60
Mix-6-W/C=0.39-60% slag
0.40 0.20 0.00 0
10
20
30
40
50
60
70
80
90
Age of testing (days) Figure 6-16. Creep coefficient of lightweight concretes (7-day moist curing, 50% load level)
100
0.9 0.8
122
Creep coefficient
0.7 0.6 0.5 0.4
Mix-2-W/C=0.33-20% fly ash Mix-6-W/C=0.39-60% slag
0.3 0.2 0.1 0 0
10
20
30
40
50
60
70
80
90
Age of testing (days) Figure 6-17. Creep coefficient of lightweight concete (14-day moist curing, 40% load level)
100
1.20
123
Creep coefficient
1.00 0.80
0.60 Mix-2-W/C=0.36-20% fly ash
0.40
Mix-6-W/C=0.39-60% slag
0.20
0.00 0
10
20
30
40
50
60
70
80
90
Age of testing (days) Figure 6-18. Creep coefficient of lightweight concetes (14-day moist curing, 50% load level)
100
Chapter 7 SUMMARY AND RECOMMENDATIONS
7.1 Design and Construction of Creep Apparatuses The creep test apparatus was designed, and twelve creep test apparatuses were constructed and set up in the laboratory for use in performing the creep tests in this study. In each test frame, three 6"×12" cylindrical specimens can be placed on top of one another and cemented together by an epoxy and tested under the same load. The maximum capacity of each creep apparatus is 1.92 × 10⁵ lbf. The maximum stress that can be applied to the 6"×12" cylindrical concrete specimens in the creep frame is 6795 psi. Three pairs of gage points with a gage distance of 10 inches are to be placed in each test concrete specimen. A mechanical strain gage (formerly known as Whittemore gage) is to be used to measure the change in distance between the gage points, which is the creep of the concrete specimen during the creep test. The creep test apparatus was evaluated to be working satisfactorily. An effective procedure for the creep test using this apparatus was developed and documented.
7.2 Findings from the Research Testing Program Ten typical Florida concrete mixes were evaluated in the research testing program for their compressive strength, splitting tensile strength, elastic modulus, shrinkage and
124
creep characteristics. Eight of the ten concrete mixes used a Miami Oolite as the coarse aggregate, while two concrete mixes used a lightweight aggregate Stalite. Four normalweight concretes and one lightweight concrete used 20 % fly ash, while the other four normal-weight concretes and one lightweight concrete used 50 to 70 % slag. Tests were run on the concrete specimens up to an age of 91 days. Major findings from the tests on these ten concrete mixes are summarized as follows: On Strength and Elastic Modulus
1. The compressive strength, splitting tensile strength and elastic modulus of the normal-weight concretes with 20 % fly ash continue to increase significantly beyond 28 days, while those of the normal-weight concretes with 50 to 70 % slag level off considerably beyond 28 days. 2. The lightweight concretes have considerably lower compressive strength, splitting tensile strength and elastic modulus than those of the normal-weight concretes with similar w/c and mineral additive. 3. The empirical relationships between compressive strength (fc’) in psi and splitting tensile strength ( fct) in psi for the normal-weight concretes evaluated in this study are as follows: f ct = 7.08 ⋅
f c'
[Equation 7.1]
( )
f ct = f c'
0.72
[Equation 7.2]
Equation 7.2 was found to fit the data slightly better than Equation 7.1.
125
4. The empirical relationships between compressive strength (fc’) in psi, density (w) in pci, and elastic modulus (E) in psi for the normal-weight concretes evaluated in this study are as follows: For 28-day curing,
E = 32.2 ⋅ w1.5 ⋅
f c'
[Equation 7.3]
For 91-day curing,
E = 32.8 ⋅ w1.5 ⋅
f c'
[Equation 7.4]
For all curing conditions, E = 33.0 ⋅ w1.5 ⋅
f c'
[Equation 7.5]
On Drying Shrinkage
5. For the normal-weight concretes containing 20 % fly ash, the drying shrinkage decreases as w/c decreases, and as the moist curing time increases from 7 days to 14 days. 6. For the normal-weight concretes containing 50 to 70 % slag, the drying shrinkage does not change significantly as the moist curing time increases from 7 days to 14 days. 7. The normal-weight concretes containing 20 % fly ash have a significantly higher drying shrinkage than the concretes containing 50 to 70 % slag of comparable w/c. 8. For the two lightweight concretes evaluated, the drying shrinkage decreases significantly as the moist curing time increases from 7 days to 14 days. 9. The lightweight concretes have a significantly higher drying shrinkage than the normal-weight concretes.
126
On Creep Characteristics
10. The creep coefficient is generally lower for a concrete with a lower w/c. 11. The creep coefficient of a concrete with slag is generally lower than that for a concrete with fly ash, for comparable w/c. 12. The creep coefficients of lightweight concretes are substantially lower than those of normal-weight concretes. 13. The creep coefficient does not vary linearly with load level. As the load increases from 40 to 50 % of ultimate load, the creep coefficient increases more than proportionally. 14. With the exception of Mix 1 with a low w/c of 0.24, the creep coefficients of the other nine concrete mixes appeared to continue to increase significantly beyond 91 days. 15. Three of the ten concrete mixes evaluated had creep coefficients exceeding the value of 2.0 at 91 days. At least two other concrete mixes had predicted creep coefficients exceeding 2.0 at one year.
7.3 Recommendations While this study has generated valuable data and determined general trends on the compressive strength, splitting tensile strength, elastic modulus, drying shrinkage strains and creep coefficient of typical Florida structural concretes made with normal weight and lightweight aggregates, it must be noted that this study was limited in scope due to the constraint of time and budget. Due to the time constraint, no replicate batch of the
127
concrete mixes in the testing program was tested. There is a need to test the replicates of these concrete mixes to establish reliability of the findings and to evaluate the variability of the test results. The creep tests in this study were run only up to 91 days. However, the creep test results from this study indicate that most of concretes still continued to creep considerably at 91 days. There is a need to extend the creep tests beyond 91 days, and preferably to one year, so that the ultimate creep coefficient can be determined more reliably. Due to the limited scope of this study as described above, the concrete properties as determined from this study should not be recommended for use in structural designs yet at this point. It is recommended that further testing be conducted in the following areas: Replicate batches of the ten concrete mixes evaluated in this study should be
tested to establish reliability of the findings and to evaluate the variability of the test results. The creep tests should be run up to one year, instead of 91 days. Structural concretes using other Florida coarse aggregates should also be
evaluated. The effects of the type and amount of mineral admixtures (fly ash, slag and
silica fume), and other admixtures should be evaluated.
128
REFERENCE AASHTO, 2001. AASHTO LRFD Bridge Construction Specifications-2001 Interim Revisions, American Association of State Highway and Transportation Officials, Washington, D.C. ACI Committee 209, 1993. Prediction of Creep, Shrinkage, and Temperature Effects in Concrete Structures (ACI 209R-92), ACI Manual of Concrete Practice, American Concrete Institute, Detroit, MI, Part 1, pp.47. ACI 318-83, 1983. Building Code Requirements for reinforced concrete, American Concrete Institute, Detroit, Michigan, November 1983. Alexander, M. G.and Addis, B. J., 1992. “Properties of High Strength Concrete Influenced by Aggregates and Interfacial Bond. Bond in Concrete”: From Research to Practice. Proceedings of the CEB International Conference held at Riga Technical University, Riga, Latvia, Oct. 15-17, Vol.2, Topics 3-7, pp.4-19 to 4-26. Acker Paul, Ulm Franz-Josef, 2001. “Creep and Shrinkage of Concrete: Physical Origins and Practical Measurements”, Nuclear Engineering and Design 203, pp.143–158. Bažant, Z.P., Hauggaard A.B., Baweja S., Ulm Franz-Josef., 1997. “MicroprestressSolidification Theory for Concrete Creep I: Aging and Drying Effects, Journal of Engineering Mechanics”, Vol. 123, No. 11, November 1997, pp.1188-1194. Bažant, Z.P., 2001. “Prediction of concrete creep and shrinkage: past, present and future”, Nuclear Engineering and Design, 203 (2001), pp.27–38. Branson, Dan E. and Christiason, M.L., Time Dependent Concrete Properties Related to Designing-strength and Elasticity properties, Creep and Shrinkage, , ACI, Publication SP-27, pp.257-278. Bisschop, J. and Van Mier, J.G.M., 2000. “Effect of Aggregates on Drying Shrinkage Micro-cracking in Cement-based Materials”, UEF conference, Mt-Tremblant, Canada, August, 2000, (Con. Sc. Techn). CEB-FIP, 1990. Model Code for Concrete Structures, first draft, Bulletin d’ information No.195, Comité-Euro-International Du Béton-Fédération Internationale De La Précontrainte, Paris, 1990.
129
Carino, N.J., and H.S.Lew, 1982. “Re-examination of the Relation Between Splitting Tensile and Compressive Strength of Normal Weight Concrete”, Journal of American Concrete Institute, Vol.79, No.3, May-June 1982, pp.214-219. Collins, T. M., 1989. “Proportioning High-Strength Concrete to Control Creep and Shrinkage”. ACI Materials Journal, Nov-Dec, Vol. 86, No. 6, pp.576-580. Chi, J.M., Huang, R., Yang, C.C., Chang, J.J., 2003. “Effect of aggregate properties on the strength and stiffness of lightweight concrete”, Cement & Concrete Composites, 25 (2003), pp.197–205. FDOT, 2002. Structural Design Guidelines for Load and Resistance Factor Design, Structural Design Office, Tallahassee, Florida. FHWA, 1994. An Analysis of Transfer and Development Lengths for Pre-tensioned Concrete Structures, Report No. FHWA-RD-94-049, December 1994. Gesog¢lu Mehmet, Zturan Turan*, Güneyisi Erhan, 2004. “Shrinkage cracking of lightweight concrete made with cold-bonded fly ash aggregates”, Cement and Concrete Research 34 (2004), pp.1121-1130. Hermite, R.L’, 1960. “Volume changes of concrete”, Proc. 4th int. symp. On the Chemistry of cement, Washington DC, pp.659-694. Holm, Thomas. A., 2001. lightweight aggregate concrete, STP 169C, ASTM, pp.522~531. Hua, C., Acker, P., Ehrlacher, A., 1995. "Analysis and modeling of the autogenous shrinkage of hardening cement paste-I. Modeling at macroscopic scale", Cement and Concrete Research, Vol.25, No7 (1995), pp.1457-1468. Keeton, John R., Roll Frederic and Meyers, B.L., “Effects of Concrete Constituents, Environment, and Stress on the Creep and Shrinkage of Concrete”, ACI Committee 209, subcommittee 1, , Publication SP-27, pp.1-23. Li, Jianyong*, Yao, Yan, 2001. “A study on creep and drying shrinkage of high performance concrete”, Cement and Concrete Research 31 (2001), pp.1203-1206. Neville, A.M., 1996. Properties of Concrete (Fourth and Final Edition), John Wiley & Sons, Inc, New York. Neville , A.M., 1965. Properties of Concrete (First Edition), John Wiley & Sons, Inc, New York.
130
Neville, A.M., 1957. Non-elastic Deformations in Concrete Structures, J. New Zealand Inst. E., 12, pp.114-120. Phillieo, R.E., Summary of Symposium on Designing for Effects of Shrinkage, Creep and Temperature, , ACI, Publication SP-27, pp.247-253. Paulson, K. A., Nilson, A. H., Hover, K. C, 1991. “Long Term Deflection of HighStrength Concrete Beams”, ACI Materials Journal, Mar-Apr 1991, Vol. 88, No. 2, pp. 197-206. Persson Bertil, 2001. “A comparison between mechanical properties of self-compacting concrete and the corresponding properties of normal concrete”, Cement and Concrete Research, 31 (2001), pp.193 –198. Pichett, G., 1956. “Effect of aggregate on shrinkage of concrete and hypothesis concerning shrinkage”, J. Amer. Concr. Inst., 52, pp.581-590. Roberts, John.Thomas., 1951. The Elastic Properties of Concrete and Their Effects on Design, A Thesis for Master Degree, University of Florida, August, 1951. Rüsch, H., Kordina, K. and Hilsdorf, H., 1963. “Der einfluss des mineralogischen Charakters der Zuschläge auf das Kriechen von Beton”, Deutscher Ausschuss für Stahlbeton, No. 146, pp.19-133. Russell, H. G., Larson, S. C, 1989. “Thirteen Years of Deformations in Water Tower Place”, ACI Structural Journal, Mar-Apr 1989, Vol. 86, No. 2, pp.182-191. Roll Frederic, Effects of Differential Shrinkage and Creep on A Composite Steelconcrete Structure, , Publication SP-27, American Concrete Institute, pp.187-214. Reichard, T.W., 1964. “Creep and drying shrinkage of lightweight and normal weight concretes”, Nat. Bur. Stand. Monograph, 74, Washington DC, March, 1964. Shideler, J.J., 1957. “Lightweight aggregate concrete for structural use”, J. Amer. Concr. Inst., 54, pp.299-328. Schlumpf Jürg, 2004. “Self-compacting concrete structures in Switzerland”, Tunnelling and Underground Space Technology, 19 (2004) 480.
131
Stock, A.F., Hannant, D.J. and Williams, R.I.T., 1979. “The effect of aggregate concentration upon the strength and modulus of elasticity of concrete”, Mag. Concr. Res., 31, No. 109, pp.225-234. Troxell, G.E., Raphael, J.M. and Davis, R.E., 1958. “Long-time creep and shrinkage tests of plain and reinforced concrete”, Proc. ASTM., 58, pp.1101-1120. Thomas, Jeffrey J. and Jennings, Hamlin M., 2001. Chemical Aging and the Colloidal Structure of the C-S-H Gel: Implication for Creep and Shrinkage, Creep, Shrinkage and Durability Mechanics of Concrete and Other Quasi-brittle Materials edited by F,-J. Ulm, Z.P. Bažant and F.H. Wittmann. (2001), pp.33-38. Zia, P., Leming, M.L., Ahmad, S.H. 1991. High-Performance Concrete: A State-of-theArt Report. Strategic Highway Research Program, National Research Council, Washington, D. C., (SHRP-C/FR-91-103; PB92-130087), pp.251. Zia, P., Ahmad, S.H., Leming, M.L., Schemmel, J.J., Elliott, R.P. 1993. “Mechanical Behavior of High Performance Concretes”, Volume 5: Very High Strength Concrete. Strategic Highway Research Program, National Research Council, Washington, D. C., xi, (SHRP-C-365), pp.101. Zhou, F.P., Lydon, F.D. and Barr, B.I.G., 1995. “Effect of coarse aggregate on elastic modulus and compressive strength of high performance concrete”, Cement and Concrete Research, Vol. 25, No. 1, pp.177-186.
132
Appendix A
Table A-1. Results of compressive strength tests (psi) No. of mix mix-1 mix-2 mix-3 mix-4 mix-5 mix-6 mix-7 mix-8 mix-9 mix-10
1
3 2
3
N/A 3620 5630 6260 4770 1980 6120 2320 3220 5230
N/A 3910 5710 6330 4920 1830 6380 2410 3100 5200
N/A 3620 5760 6530 4950 1970 6110 2410 3210 5300
1
7 2
3
1
10274 5130 6620 8410 6230 3530 8530 5200 5640 6770
10345 4770 6880 8630 5950 3520 8570 5340 5610 6560
10342 5000 6740 8870 6050 3580 8640 5290 5830 6810
11042 5810 7570 9360 7140 5020 9490 6270 7040 7970
Age of Testing (days) 14 28 2 3 1 2 11484 6080 7470 9550 7340 5020 9260 7090 6750 7780
10734 6040 7430 9510 7070 5150 10090 6880 7030 7810
11480 6030 7870 10290 7560 6070 10200 7410 7940 8730
11630 6700 7990 10300 8140 5910 10150 7830 8010 8580
3
1
56 2
3
1
91 2
3
11580 6870 7890 10160 8120 6570 10350 6760 7840 8640
12200 7160 8590 10070 8990 7010 10750 8250 8620 9390
12040 7360 8590 9980 8820 7120 10460 8180 8260 9260
11970 7510 8810 10300 8620 7070 10370 8180 8070 9300
11700 8320 9110 10260 9460 7350 10720 8030 8960 9560
12600 7880 8900 10480 9030 7410 10920 8280 8460 10060
12900 8100 9110 10000 9440 7180 10720 8320 8570 10150
133
Table A-2. Results of splitting tensile strength tests (psi) Mix Number
134
mix-1 mix-2 mix-3 mix-4 mix-5 mix-6 mix-7 mix-8 mix-9 mix-10
1
3 2
3
N/A
N/A
N/A
295 451
398 428
426 549 259 601 310 347 358
Age of Testing (days) 14 28 2 3 1 2
1
7 2
3
1
3
1
56 2
1
91 2
3
708
610
N/A
824
826
N/A
421 529
490 486
616 562
542 685
469 669
544 680
878 573 809
960 492 709
N/A
470 479
809 493 585
N/A
392 434
761 643 700
3
1024
943
913
529 652
594 727
551 817
675 660
553 450 223 560 317 306
468 547 267 617 262 463
573 507 346 625 500 520
618 575 341 704 432 536
754 475 361 736 474 524
656 656 451 626 559 599
618 590 488 772 486 589
585 650 468 690 664 600
819 595 472 770 688 560
645 658 475 705 525 594
774 602 553 616 660 640
648 763 602 663 612 587
695 662 564 697 701 619
737 718 600 786 646 709 789
633 709 614 755 735 619 857
755 775 601 798 634 660 836
681 799 623 854 675 652 832
410
512
527
516
556
660
502
548
658
728
640
698
721
Table A-3. Results of elastic modulus tests (×106psi) Mix Number
135
mix-1 mix-2 mix-3 mix-4 mix-5 mix-6 mix-7 mix-8 mix-9 mix-10
3 1 N/A 2.75 3.99 4.40 4.16 2.01 4.86 3.24 3.54 3.99
7 2 N/A 2.67 3.98 4.37 4.21 2.05 4.46 3.28 3.51 4.22
1 5.43 2.99 4.23 4.96 4.55 2.28 5.15 4.35 4.57 4.47
2 5.32 2.92 4.28 5.12 4.51 2.30 5.25 4.18 4.36 4.43
1 5.52 3.12 4.59 5.37 4.88 2.58 5.46 4.67 4.89 4.68
Age of Testing (days) 14 28 2 1 5.52 5.68 3.18 3.32 4.44 4.70 5.32 5.43 4.86 5.02 2.72 2.91 5.60 5.56 4.52 4.75 4.71 4.85 N/A 5.02
56 2 5.71 3.25 4.61 5.42 5.02 2.98 5.72 4.71 4.86 5.00
1 5.94 3.46 4.77 5.68 5.17 3.19 5.77 4.72 5.11 5.34
91 2 5.94 3.46 4.80 5.53 5.19 3.22 5.69 4.94 5.27 5.53
1 6.31 3.53 4.91 5.66 5.46 3.28 5.81 4.86 5.10 5.45
2 6.27 3.50 5.05 5.59 5.56 3.38 5.85 4.89 5.34 5.45
Appendix B Plots of Shrinkage Strain, Creep Strain and Creep Coefficient
2.50E-04 2.00E-04
136
Shrinkage strain.
1.50E-04 1.00E-04 7-day moist curing 14-day moist curing
5.00E-05 0.00E+00 0
7
14
21
28
35
42
49
56
63
70
77
-5.00E-05 -1.00E-04 Age of testing (days) Figure B-1. Development of shrinkage strain of Mix-1 with time
84
91
98
105
7.00E-04 6.00E-04
137
Creep strain
5.00E-04 4.00E-04 3.00E-04 40% ultimate strength at 14 days 40% ultimate strength at 28 days
2.00E-04
45% ultimate strength at 14 days
1.00E-04 0.00E+00 0
7
14
21
28
35
42
49
56
63
70
77
Age of testing (days)
Figure B-2. Comprison of creep strains of Mix-1 at different curing ages
84
91
98
0.8 0.7
138
Creep coefficient
0.6 0.5 0.4 MIX-1-Curing-1-40% load level
0.3
MIX-1-Curing-1-50% load level MIX-1-Curing-2-40% load level
0.2 0.1 0 0
7
14
21
28
35
42
49
56
63
70
Age of testing (days)
Figure B-3. Development of creep coefficient of Mix-1 with time
77
84
91
98
5.00E-04 4.00E-04
139
Shrinkage strain.
3.00E-04 2.00E-04
7-day moist curing 14-day moist curing
1.00E-04 0.00E+00 0
7
14
21
28
35
42
49
56
63
70
77
-1.00E-04 -2.00E-04 Age of testing (days) Figure B-4. Comparison of shrinkage strains of Mix-2 with different curing conditions
84
91
98
1.00E-03 9.00E-04 8.00E-04
140
Creep strain
7.00E-04 6.00E-04 5.00E-04 40%-14-day curing
4.00E-04
50%-14-day curing 40%-28-day curing
3.00E-04
50%-28-day curing
2.00E-04 1.00E-04 0.00E+00 0
7
14
21
28
35
42 49 56 Age of testing (days)
63
70
77
Figure B-5. Comparison among creep strains of Mix-2 at different curing age
84
91
98
1.20
141
Creep coefficient
1.00
0.80
0.60 40%-28-day curing 50%-28-day curing 40%-14-day curing
0.40
50%-14-day curing
0.20
0.00 0
7
14
21
28
35
42
49
56
63
70
Age of testing (days)
Figure B-6. Development of creep coefficient of Mix-2 with time
77
84
91
98
4.00E-04 3.50E-04 3.00E-04
142
Shrinkage strain.
2.50E-04 2.00E-04
7-day moist curing 14-day moist curing
1.50E-04 1.00E-04 5.00E-05 0.00E+00 -5.00E-05 -1.00E-04
0
7
14
21
28
35
42
49
56
63
70
77
84
91
98
Age of testing (days) Figure B-7. Comparison of shrinkage strains of Mix-3 under the different curing conditions
105
1.40E-03 1.20E-03
143
Creep strain
1.00E-03 8.00E-04 6.00E-04
40% ultimate strength at 14 days 40% ultimate strength at 28 days 50% ultimate strength at 14 days
4.00E-04
50% ultimate strength at 28 days
2.00E-04 0.00E+00 0
10
20
30
40
50
60
70
80
Age of testing (days)
Figure B-8. Comparison of creep strains of Mix-3 at various ages
90
100
2.00 1.80
144
Creep coefficient
1.60 1.40 1.20 1.00 40%-14-day curing
0.80
50%-14-day curing 40%-28-day curing
0.60
50%-28-day curing
0.40 0.20 0.00 0
7
14
21
28
35
42 49 56 Age of testing (days)
63
70
Figure B-9. Development of creep coefficient of Mix-3 with time
77
84
91
98
3.00E-04 2.50E-04
145
Shrinkage strain.
2.00E-04 1.50E-04 1.00E-04 14-day moist curing
5.00E-05
7-day moist curing
0.00E+00 0
7
14
21
28
35
42
49
56
63
70
77
84
91
-5.00E-05 -1.00E-04 -1.50E-04 Age of testing (days) Figure B-10. Comparison of shrinkage strains of Mix-4 under the different curing conditions
98
8.00E-04 7.00E-04
146
Creep strain
6.00E-04 5.00E-04 4.00E-04
40%-14-day curing 50%-14-day curing
3.00E-04
40%-28-day curing 50%-28-day curing
2.00E-04 1.00E-04 0.00E+00 0
7
14
21
28
35
42
49
56
63
70
77
84
91
Age of testing (days)
Figure B-11. Comparison of Creep Strains of Mix-4 with different curing and loading conditions
98
1.20
147
Creep coefficient
1.00
0.80
0.60 40%-14-day curing
0.40
50%-14-day curing 40%-28-day curing 50%-28-day curing
0.20
0.00 0
7
14
21
28
35
42
49
56
63
70
77
Age of testing (days)
Figure B-12. Development of creep coefficient of Mix-4 with time
84
91
98
4.00E-04 3.50E-04
148
Shrinkage strain.
3.00E-04 2.50E-04 2.00E-04 7-day moist curing
1.50E-04
14-day moist curing
1.00E-04 5.00E-05 0.00E+00 0
7
14
21
28
35
42
49
56
63
70
77
84
-5.00E-05 Age of testing (days) Figure B-13. Comparison of shrinkage strains of Mix-5 under the different curing conditions
91
98
1.20E-03
1.00E-03
149
Creep strain
8.00E-04
6.00E-04 40%-14-day curing 50%-14-day curing
4.00E-04
40%-28-day curing 50%-28-day curing
2.00E-04
0.00E+00 0
10
20
30
40 50 60 Age of testing (days)
70
80
90
100
Figure B-14. Comparison of creep strain of Mix-5 under different curing and loading conditions
2.00 1.80
150
Creep coefficient
1.60 1.40 1.20 1.00 MIX-5-14-day curing-40% load level
0.80
MIX-5-14-day curing-50% load level MIX-5-28-day curing-40% load level
0.60
MIX-5-28-day curing-50% load level
0.40 0.20 0.00 0
7
14
21
28
35
42
49 56 63 70 77 Time (days) Figure B-15. Development of creep coefficient of Mix-5 with time
84
91
98
5.00E-04 4.50E-04 4.00E-04
151
Shrinkage strain
3.50E-04 3.00E-04 2.50E-04 2.00E-04
7-day moist curing 14-day moist curing
1.50E-04 1.00E-04 5.00E-05 0.00E+00 0
7
14
21
28
35
42
49 56 Time (days)
63
70
77
84
Figure B-16. Comparison of shrinkage strains of Mix-6 under the different curing conditions
91
98
9.00E-04 8.00E-04 7.00E-04
152
Creep strain
6.00E-04 5.00E-04 4.00E-04 3.00E-04
40%-14-day curing 50%-14-day curing
2.00E-04
40%-28-day curing 50%-28-day curing
1.00E-04 0.00E+00 0
7
14
21
28
35
42
49 56 Time (days)
63
70
77
84
91
Figure B-17. Comparison of creep strain of Mix-6 under different curing and loading conditions
98
1.20
153
Creep coefficient
1.00
0.80
0.60 40%-28-day curing
0.40
50%-28-day curing 40%-14-day curing 50%-14-day curing
0.20
0.00 0
7
14
21
28
35
42
49 56 Time (days)
63
70
77
Figure B-18. Development of creep coefficient of Mix-6 with time
84
91
98
3.00E-04
154
Shrinkage strain
2.50E-04
2.00E-04
1.50E-04
1.00E-04 7-day moist curing 14-day moist curing
5.00E-05
0.00E+00 0
7
14
21
28
35
42
49 56 Time (days)
63
70
77
84
Figure B-19. Comparison of shrinkage strains of Mix-7 under the different curing conditions
91
98
8.00E-04 7.00E-04
155
Creep strain
6.00E-04 5.00E-04 4.00E-04 3.00E-04
40%-28-day curing 50%-28-day curing
2.00E-04
40%-14-day curing 50%-14-day curing
1.00E-04 0.00E+00 0
7
14
21
28
35
42
49 56 Time (days)
63
70
77
84
91
98
Figure B-20. Comparison of creep strains of Mix-7 under different curing and loading conditions
1.20
156
Creep coefficient
1.00
0.80
0.60 40%-14-day curing
0.40
50%-14-day curing 40%-28-day curing 50%-28-day curing
0.20
0.00 0
7
14
21
28
35
42
49 56 Time (days)
63
70
77
Figure B-21. Development of creep coefficient of Mix-7 with time
84
91
98
2.50E-04 2.25E-04 2.00E-04
157
Shrinkage strain
1.75E-04 1.50E-04 1.25E-04 7-day moist curing
1.00E-04
14-day moist curing
7.50E-05 5.00E-05 2.50E-05 0.00E+00 0
7
14
21
28
35
42 49 56 Age of testing (days)
63
70
77
84
91
Figure B-22. Comparison between shrinkage strains of Mix-8 under different curing conditions
98
1.40E-03 1.20E-03
158
Creep strain
1.00E-03 8.00E-04 6.00E-04 4.00E-04
40%-14-day curing 50%-14-day curing 40%-28-day curing
2.00E-04
50%-28-day curing
0.00E+00 0
7
14
21
28
35
42 49 56 Age of testing (days)
63
70
77
84
91
Figure B-23. Comparison of creep strains of Mix-8 under different curing and loading conditions
98
2.50
159
Creep Coefficient
2.00
1.50
1.00
40%-14-day curing
0.50
50%-14-day curing 40%-28-day curing 50%-28-day curing
0.00 0
7
14
21
28
35
42
49 56 Time (days)
63
70
Figure B-24. Development of creep coefficient of Mix-8 with time
77
84
91
98
2.50E-04
160
Shrinkage strain.
2.00E-04
1.50E-04 7-day moist curing 14-day moist curing
1.00E-04
5.00E-05
0.00E+00 0
7
14
21
28
35
42
49 56 Time (days)
63
70
77
84
91
Figure B-25. Comparison of shrinkage strains of Mix-9 under different curing conditions
98
1.60E-03 1.40E-03
161
Creep strain
1.20E-03 1.00E-03 8.00E-04 40%-14-day curing
6.00E-04
50%-14-day curing 40%-28-day curing
4.00E-04
50%-28-day curing
2.00E-04 0.00E+00 0
7
14
21
28
35
42
49
56
63 70 77 Time (days)
84
91
98
105 112 119 126 133
Figure B-26. Comparison of creep strains of Mix-9 under different curing and loading conditions
2.70 2.40
162
Creep coefficient
2.10 1.80 1.50 1.20 40%-14-day curing 50%-14-day curing
0.90
40%-28-day curing 50%-28-day curing
0.60 0.30 0.00 0
7
14
21
28
35
42
49
56
63 70 77 Time (days)
84
91
98
105 112 119 126 133
Figure B-27. Development of creep coefficient of Mix-9 with time
3.00E-04
163
Shrinkage strain
2.50E-04
2.00E-04
1.50E-04
1.00E-04
5.00E-05
0.00E+00 0
7
14
21
28
35
42
49 56 Time (days)
63
70
Figure B-28. Development of shrinkage strain of Mix-10 with time
77
84
91
98
2.00E-03 1.80E-03 1.60E-03
164
Creep strain
1.40E-03 1.20E-03 1.00E-03 8.00E-04
40%-14-day curing
6.00E-04
40%-28-day curing
50%-14-day curing 50%-28-day curing
4.00E-04 2.00E-04 0.00E+00 0
7
14
21
28
35
42
49
56
63
70
77
84
Time (days)
Figure B-29. Creep strains of Mix-10 under different curing and loading conditions
91
98
3.00
165
Creep coefficient
2.50
2.00
1.50 40%-14-day curing 50%-14-day curing
1.00
40%-28-day curing 50%-28-day curing
0.50
0.00 0
7
14
21
28
35
42
49 56 Time (days)
63
70
Figure B-30. Development of creep coefficient of Mix-10 with time
77
84
91
98