Dec 6, 2013 ... doi:10.5194/hess-17-4897-2013. © Author(s) 2013. .... other unfiltered sample
was placed in 50mL round amber glass sample bottles for ...
Hydrology and Earth System Sciences
Open Access
Hydrol. Earth Syst. Sci., 17, 4897–4906, 2013 www.hydrol-earth-syst-sci.net/17/4897/2013/ doi:10.5194/hess-17-4897-2013 © Author(s) 2013. CC Attribution 3.0 License.
Statistical analysis to characterize transport of nutrients in groundwater near an abandoned feedlot P. Gbolo and P. Gerla Harold Hamm School of Geology and Geological Engineering, University of North Dakota, Grand Forks, ND, USA Correspondence to: P. Gbolo (
[email protected]) Received: 10 December 2012 – Published in Hydrol. Earth Syst. Sci. Discuss.: 31 January 2013 Revised: 22 October 2013 – Accepted: 1 November 2013 – Published: 6 December 2013
Abstract. Surface water from a lagoon and groundwater samples from 17 wells within and near an abandoned feedlot in northwestern Minnesota, USA, were analyzed for carbon, nutrients, and field parameters. The feedlot is surrounded by wetlands that act as receptors of nutrients from the feedlot. Q- and R-mode multivariate analyses performed on total carbon (TC), inorganic carbon (IC), total organic carbon (TOC), nitrite-nitrogen (NO2 -N), nitrate-nitrogen (NO3 -N), ammonium-nitrogen (NH4 -N), soluble or dissolved reactive phosphorus (DRP), and total phosphorus (TP) indicated three groups of the chemical species, which reflected variability in groundwater chemistry. Factor analysis indicated approximately 82% of the variability in factor 1 was caused by TC, IC, TOC, and DRP, while in factor 2 approximately 79 % of the variability was caused by NO2 -N, NO3 -N, and TP. In factor 3, only NH4 -N contributed 31 % of the variability. Groundwater isotope and spatial distribution analysis indicated reduced nitrate concentration from the source to the wetlands, with variation in NO2 -N, NO3 -N, and NH4 -N concentrations attributed to the plant nutrient uptake, high rate of denitrification and/or the dissimilatory nitrate reduction to ammonium. This study indicated the value of multivariate analyses in characterizing variability in groundwater quality.
1
Introduction
Large feedlots have boosted the economies in parts of the USA (Duncan et al., 1997) by creating jobs, food, and increasing the economic potential of corn and other cereal markets. Mismanagement of these agricultural facilities, however, has resulted in excessive nutrients, phosphorus and nitrogen, in soil, water, and air (Mielke and Ellis, 1976; Ol-
son and Paterson, 2005). Most of the problems associated with feedlot pollution are from manure mismanagement, resulting in large concentrations of ammonia, odorous compounds, and nutrients (USEPA, 1999) in air, soil, surface water, and groundwater. Excessive nutrients in surface water and groundwater have been a major concern throughout the world (Tappin, 2002). Large feedlots, when operated within a small and restricted area, have been termed concentrated animal feeding operations (CAFOs), terminology coined in 1976 by the US Environmental Protection Agency (USEPA). There are different criteria for the definition of a CAFO, but they depend mostly on the type and number of animals reared within the facility (USEPA, 2003). Confined or concentrated animals receive nutrient-rich feed, which enables faster growth and greater health, thereby creating elevated concentrations of nutrients in their excreta (Jongbloed and Lenis, 1998). CAFOs or feedlot operations in the past did not require the use of a liner on the soil surfaces, but accumulated manure acted as an impervious layer preventing the infiltration of urea and other waste from the livestock into the subsurface. During storm-water runoff when the feedlot is operational or abandoned, natural processes such as weathering and erosion result in the transport of nutrients into soils, surface water (Burwell et al., 1974; Gilley and Risse, 2000), and groundwater. These nutrients can accumulate in nearby wetlands (Hopkinson, 1992; Ciria et al., 2005), be sequestered in soils (Craft, 2007), sorbed on biomass (Stewart et al., 1990; Ciria et al., 2005), or transported in streams. Excessive amounts of the nutrients, especially phosphorus, create conditions favorable for eutrophication, which reduces the concentration of dissolved oxygen in surface water (Paine et al., 1976; Scott et al., 1998; Wyngaard et al., 2011).
Published by Copernicus Publications on behalf of the European Geosciences Union.
FIGURES P. Gbolo and P. Gerla: Nutrients in groundwater near an abandoned feedlot
4898
Researchers have used multivariate statistics to understand the groundwater pollution and to reduce the complexity of large data sets better (Vega et al., 1998; Zhang et al., 2009). Multivariate analysis is widely applied to understand environmental pollution problems better (Carpenter et al., 1998; Anazawa and Ohmori, 2005; Boruvka et al., 2005; Yidana et al., 2008) and has been used to differentiate between anthropogenic and geogenic sources of trace elements (Boruvka et al., 2005; Zhou et al., 2008; Krishna et al., 2010). Application of multivariate statistical analysis in groundwater and surface water geochemistry within and near feedlots can help determine the transport and fate of nutrients. Multivariate analysis is used in the simultaneous comparison of several waterquality parameters or chemical species. Most often, the multivariate statistics used for geochemical data analysis include cluster analysis, principal component analysis, factor analysis, and discriminant analysis. In this manuscript, multivariate statistical techniques, including cluster and factor analysis, are used to analyze groundwater data obtained from a feedlot abandoned in 2000. At the feedlot, which operated from 1970 until 2000 and contained an average of 1500 animal units, an ongoing study has focused on the nutrient budget and movement of phosphorus within the local groundwater system. The objectives of this paper are to (1) characterize the relationship between nutrient concentration and groundwater movement, and (2) determine the major contributing nutrient to groundwater contamination within the study area. 2 2.1
Materials and methods Study area
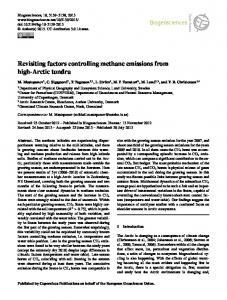
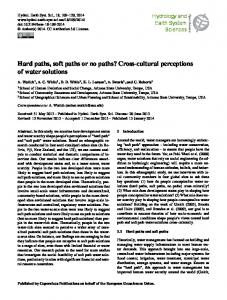
The former Crookston Cattle Company feedlot (47◦ 43.60 N, 96◦ 19.20 W) comprises the study area, which lies 25 km southeast of the city of Crookston in northwestern Minnesota, USA (Fig. 1). It lies along a sandy beach that developed approximately 12 000 yr ago on the eastern margin of glacial Lake Agassiz. The feedlot, which contained as many as 1500 cattle during its operation from 1970 to 2000, is surrounded on the northwest and southeast by wetlands. The feedlot covers approximately 0.13 km2 (13 ha) within the Glacial Ridge National Wildlife Refuge. The boundary of the study area is defined by the extent of the cattle pens within the area. The climate in the area is typical mid-continental, with hot summers and cold winters. The annual precipitation ranges from 480 to 600 mm, with June being the wettest month. Approximately 60 % of the annual precipitation occurs between May and September. The average temperature recorded in Crookston is 10.3 ◦ C, with cold temperatures recorded between November and April. The coldest month is January with temperatures ranging from −20 to −9 ◦ C, and the warmest is July with temperature ranging from 14 to 27 ◦ C.
Hydrol. Earth Syst. Sci., 17, 4897–4906, 2013
Figure 1. Map of the study area showing the sampled wells and the wetland areas.
Fig. 1. Map of the study area showing the sampled wells and the wetland areas.
The study area has approximately 2 m of relief and an average elevation of 332 m above m.s.l. Geologically, the area is characterized by Quaternary Red Lake Falls Formation (carbonate-rich glacial till) that immediately under1 lies beach ridges in the vicinity (Harris et al., 1974). The beach ridge is made up of sand and sandy gravel or gravelly sand lithologies ranging from 3.0 to 3.4 m thick. It is underlain by till and bounded laterally by wetlands, thus comprising a comparatively simple hydrogeological system. Wetland soils consist of 2 m of organic-rich clay and sandyclay soils, and are dominated by graminoids, including reed canary grass (Phalaris arundinacea), smooth brome (Bromus inermis), and hybrid cattail (Typha spp.). The variably drained Sandberg–Radium–Syrene–Strathcona soil series association that underlies much of the site consists of loamy sand and loamy and sandy glaciolacustrine deposits (USDA, 2012). The feedlot site was selected because of its coarse sandy soils that provide good drainage. Currently, there is a longterm, ongoing study focusing on the nutrient budget and groundwater nutrient transport at the site. 2.2
Sampling collection and analysis
Groundwater samples were collected during the fall of 2010 and summer of 2013 for chemical analyses, and water levels were monitored to characterize groundwater flow. In the fall of 2010, groundwater samples were collected from six shallow wells (DVPT, FLE, FLW, NWW, SPN, and SPS), two surface water pits (SGN and SGS), an excavated lagoon (POND) used in the past for manure disposal, and US Geological Survey monitoring well G8 (Minnesota unique well number 620668) (MDH, 2007). During summer 2013, groundwater samples were collected from most of the wells already noted, but additionally included a surface water pit (DUG), six shallow wells (PGN, NO3, BRW, SWW, PGB, www.hydrol-earth-syst-sci.net/17/4897/2013/
P. Gbolo and P. Gerla: Nutrients in groundwater near an abandoned feedlot
4899
(model Vcsn). Stable oxygen and nitrogen isotopes in nitrate were analyzed at the University of Nebraska-Lincoln Water Science Center using a Micromass Optima dual inlet isotope ratio mass spectrometer. Laboratory quality assurance and quality control ensured acceptable analytical accuracy and precision, which included using duplicate samples and reagent blanks in the analysis, and matrix spike analysis. The overall analytical recovery was between 80 and 120 % when compared to the certified standard concentration. 2.3
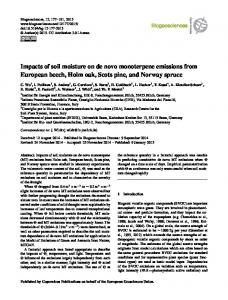
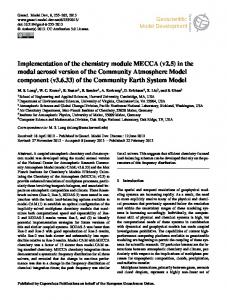
Fig.2.2.Potentiometric Potentiometric mapthe showing the lateral flow of wetlands groundwater Figure map showing lateral flow of groundwater toward in the northwest southeast (fall 2010). towardand wetlands in the northwest and southeast (fall 2010).
and NO6), and three deeper monitoring wells (MW2, MW3, and MW4) screened and sealed in the underlying till (Fig. 1). Sample points were located using a GPS receiver and the relative elevation determined with a laser level. The horizontal location was within 2 m and relative vertical elevation within 0.015 m. During fall 2010, groundwater levels in the 2 wells were measured using an electronic water level probe and a meter stick at surface water sites. These data were used to map the relative elevation of the water table (Fig. 2). Groundwater samples were collected with dedicated bailers after the wells had been thoroughly purged and allowed to recover. Three samples were collected at each site. One of the samples was used immediately for measuring field parameters, while the other two were bottled and transported for laboratory analyses. Temperature (T ), pH, and electrical conductivity (EC) were measured using calibrated meters in the field as soon as the sample was retrieved. With the other two samples, one was filtered through a disposable 0.45 µm filter membrane and placed in a sterilized 250 mL high-density polypropylene bottle while the other unfiltered sample was placed in 50 mL round amber glass sample bottles for chemical analyses. The samples were transported in an ice-filled ice chest to the laboratory and immediately refrigerated. Chemical analyses of the water samples were done at the University of North Dakota’s Environmental Analytical Research Laboratory. The filtered samples were analyzed for nutrients, which included total phosphorus (TP), soluble or dissolved reactive phosphorus (DRP), nitrate-nitrogen (NO3 -N), nitrite-nitrogen (NO2 N), and ammonium-nitrogen (NH4 -N). NO3 -N and NO2 -N were measured using ion chromatography (Dionex DX-120) while TP, DRP, and NH4 -N were measured using a HACH DR/2010 spectrophotometer. The unfiltered samples were analyzed for total carbon (TC), inorganic carbon (IC), and total organic carbon (TOC) using Shimadzu TOC analyzer www.hydrol-earth-syst-sci.net/17/4897/2013/
Multivariate statistical techniques
The multivariate analyses done in this study include cluster analysis (Q- and R-mode) and factor analysis (R-mode). These statistical analyses were performed on the samples collected in 2013 using Systat 12 software (Systat Software, Inc., Chicago, IL, USA). The chemical species analyzed using the multivariate statistical technique included TC, IC, TOC, DRP, TP, NO3 -N, NO2 -N, and NH4 -N. These chemical species were chosen for the multivariate analysis because they cause or relate closely to surface and groundwater pollution in the study area. Pearson’s correlation coefficient was used to determine the relationship between the chemical species and the field parameters. 2.3.1
Cluster analysis
Cluster analysis is an empirical analysis or a multivariate technique used to identify homogeneous groups of objects (Davis, 2002), or it shows similarities (or dissimilarities) between objects graphically, with each cluster showing homogeneity within a multiple variable. Cluster analysis is done to minimize within-group variation and maximize betweengroup variation (Fernandez, 2002). In this study, Q- and Rmode hierarchical clustering analyses with complete linkage using Euclidean distance as the similarity measure were used to generate dendrograms. Complete linkage was used because it is less susceptible to noise and outliers. With the Q-mode, the relationship between the sampled locations was plotted, while with the R-mode the relationship between the chemical species was plotted. With the cluster analysis, the chemical species were transformed and standardized to reduce the variance, eliminate responses that may bias the cluster results, and also fulfill the requirements of optimal multivariate analyses. The data were log-transformed and then standardized using z score (Eq. 1): z=
x−µ , σ
(1)
where x, µ, and σ are each raw datum, mean, and standard deviation of the data set, respectively. 2.3.2
Factor analysis
Factor analysis examines the pattern of correlations (or covariances) between observed measures (DeCoster, 1998). Hydrol. Earth Syst. Sci., 17, 4897–4906, 2013
4900
P. Gbolo and P. Gerla: Nutrients in groundwater near an abandoned feedlot
Table 1. Location, water level, and concentration of the physical and chemical species of the water at each sample location, along with descriptive statistics. Well BRW DUG DVPT FLE FLW G8 MW2 MW3 MW4 NO3 NO6 NWW PGB PGN POND SPN SWW VWP
E (UTM)
N (UTM)
WL
Temp
pH
EC
TC
IC
TOC
NO2 -N
NO3 -N
NH4 -N
DRP
TP
701 104 700 819 700 892 701 118 700 816 701 304 701 087 700 941 700 800 700 864 701 231 700 776 701 218 700 918 700 958 700 962 701 185 701 156
5 289 603 5 289 772 5 289 498 5 289 716 5 289 429 5 289 722 5 289 747 5 289 471 5 289 451 5 289 412 5 289 599 5 289 574 5 289 651 5 289 686 5 289 464 5 289 612 5 289 496 5 289 561
* 330.75 331.68 331.61 331.68 331.62 * * * * * 330.85 * * 331.12 331.66 * 331.12
18.9 19.5 18.9 18.5 18.4 18.4 12.2 15.4 17.8 18.0 18.0 18.3 18.4 18.7 19.9 19.2 18.3 18.9
7.58 8.00 7.65 7.50 7.48 7.20 7.61 7.40 7.50 8.04 7.64 7.60 7.36 7.38 7.18 7.88 7.88 7.43
872 969 720 386 448 832 534 920 460 888 587 1554 640 413 1328 312 854 984
111 144 48 55 61 90 75 112 48 133 94 219 102 86 151 45 198 95
95 89 43 44 51 56 64 91 46 102 78 178 86 76 109 36 187 88
16 55 5 10 10 34 12 21 2 31 16 40 15 10 42 9 11 7
0.2 ND 0.1 0.6 1.2 < 0.1 0.1 1.4 ND 0.3 ND < 0.1 0.1 0.1 0.1 0.1 < 0.1 0.1
14.4 0.1 5.2 12.6 11.6 1.9 ND 3.6 < 0.1 10.2 < 0.1 < 0.1 3.1 7.9 0.1 2.3 ND 2.2
0.06 0.07 0.01 0.26 0.08 0.03 1.36 0.25 0.11 0.01 0.30 0.00 0.56 0.05 0.84 0.10 0.60 0.01
0.09 0.02 0.02 0.03 0.04 0.01 < 0.01 0.03 ND 0.02 0.24 0.01 0.04 0.05 0.02 < 0.01 0.26 0.02
0.47 0.49 0.05 0.40 0.52 0.15 0.05 0.06 ND 0.05 0.48 0.16 0.18 0.06 0.06 0.01 0.40 0.04
NO3 -N 0.1 14.4 4.2 4.9
NH4 -N 0.01 1.36 0.26 0.36
DRP 0.01 0.49 0.09 0.13
TP 0.01 0.52 0.17 0.19
Descriptive statistics of the water level and concentration of the physical and chemical species measured. Minimum Maximum Mean Standard deviation
WL 330.75 331.68 331.34 0.38
Temp 12.2 19.9 18.1 1.7
pH 7.18 8.04 7.57 0.25
EC 312 1554 761 331
TC 45 219 104 50
IC 36 187 84 42
TOC 2 55 19 15
NO2 -N 0.1 1.4 0.2 0.4
The chemical species, which include TC (total carbon), IC (inorganic carbon), TOC (total organic carbon), NO2 -N (nitrite-nitrogen), NO3 -N (nitrate-nitrogen), NH4 -N (ammonium-nitrogen), DRP (soluble or dissolved reactive phosphorus), and TP (total phosphorus), are in mg L−1 , while field parameters, including EC (electrical conductivity), T (temperature) and pH, are in units of µS cm−1 , ◦ C, and standard units, respectively. Water level (WL), E (easting UTM), and N (northing UTM) are in meters. Datum: NAD 1983 and zone 14. ND represents non-detected and < indicates below detection limit. * indicates the wells have not been surveyed yet. TC, IC, and TOC have a detection limit of 1 mg L−1 ; NO2 -N and NO3 -N have a detection limit of 0.1 mg L−1 ; and NH4 -N, DRP, and TP have a detection limit of 0.01 mg L−1 .
This type of analysis reduces a set of intercorrelated data into compact or smaller latent variables called factors. Factor analysis is used to explore patterns in the data and reduce the number of variables. The variables used in the analysis produce different variances called eigenvalues. Often, factor analysis and principal component analysis are thought to be identical, but the major difference between principal component analysis and the factor analysis relates to random error in the variance observed in the data. There have been different views and rules concerning the sample size used in factor analysis, but MacCallum et al. (1999) and Hogarty et al. (2005) suggest that when the communalities in factor analysis increase, the effect of small sample sizes on the quality of the factor solution will be reduced. As long as the communality is high, the number of expected factors is relatively small, and the model error is low, then less emphasis needs to be placed on the magnitude of the sample size (Preacher and MacCallum, 2002). The results reported here use factor analysis to determine the main cause of variation in the hydrochemistry and compare the results of the factor to that of the cluster analysis.
Hydrol. Earth Syst. Sci., 17, 4897–4906, 2013
With the factor analysis, R-mode factor analysis was done using varimax rotation, which is an orthogonal rotation of the factor axes. As noted, it was carried out to provide more interpretable results, enhance variation in the factors obtained, and support the results obtained in the R-mode hierarchical cluster analysis. Three factor score estimates were generated, but only the two that gave the best estimates of the individual latent factors were plotted. 3 3.1
Results and discussion Groundwater movement
The groundwater elevations measured within the wells ranged from 330.40 to 331.68 m (Table 1). The groundwater elevations from each of the wells, which very closely reveal the water table, were contoured using the minimum curvature gridding algorithm in Golden Software Surfer 10 (Golden Software, Inc., Golden, CO, USA). This provided a good fit to the water table surface when compared to other gridding algorithms; results were used in conjunction with www.hydrol-earth-syst-sci.net/17/4897/2013/
P. Gbolo and P. Gerla: Nutrients in groundwater near an abandoned feedlot
4901
Table 2. Pearson’s correlation coefficient between the chemical species, physical parameters, and water level.
pH EC TC IC TOC NO2 -N NO3 -N NH4 -N DRP TP WL
pH
EC
TC
IC
TOC
NO2 -N
NO3 -N
NH4 -N
DRP
TP
1 −0.07 0.19 0.19 0.11 −0.17 0.01 −0.15 0.45 0.01 −0.21
1 0.82 0.72 0.70 −0.16 −0.31 −0.02 0.08 −0.14 −0.80
1 0.96 0.63 −0.21 −0.31 0.10 0.35 0.08 −0.87
1.00 0.40 −0.20 −0.27 0.12 0.27 0.15 −0.82
1 −0.15 −0.25 −0.03 0.40 −0.17 −0.75
1 0.47 −0.10 −0.23 0.27 0.48
1 −0.40 −0.24 0.45 0.65
1 0.01 −0.05 −0.11
0.16 −0.55
1 0.40
WL
EC, TC, IC, TOC, NO2 -N, NO3 -N, NH4 -N, DRP, TP, and WL represent electrical conductivity, total carbon, inorganic carbon, total organic carbon, nitrite-nitrogen, nitrate-nitrogen, ammonium-nitrogen, soluble or dissolved reactive phosphorus, total phosphorus, and water level, respectively. The italic values indicate significant correlation (p < 0.05).
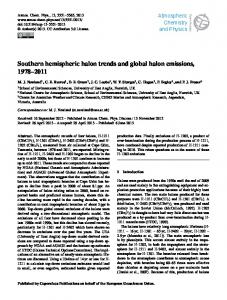
Figure 3. Total phosphorus (TP) concentrations (summer 2013).
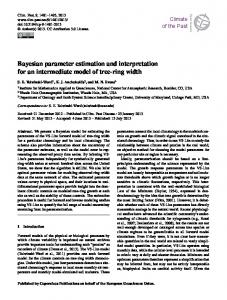
Figure 4. Nitrate-nitrogen concentrations (summer 2013).
Fig. 3. Total phosphorus (TP) concentrations (summer 2013).
Fig. 4. Nitrate-nitrogen concentrations (summer 2013).
aerial imagery to estimate patterns of shallow groundwater flow. Based on the conceptual flow model produced and not unexpectedly, groundwater appears to be preferentially recharged near the center of the feedlot (beach ridge) and flows a few tens or hundreds3 of meters before being discharged into the nearby wetlands that lie to the northwest and southeast (Fig. 2). The highest water level of 331.68 m was recorded coincidentally in wells FLE and FLW, while the lowest water level of 330.40 m was observed for surface water at DUG. The pond (POND) had a generally constant head value of 331.12 m. The untarred road in the northeastern part of the area where well G8 roughly is lies along a groundwater flow divide, suggesting that the ridge creates a zone of local recharge (Fig. 2). The water table contours roughly parallel the orientation of the beach ridge; flow lines are perpendicular.
A slug test performed on well DVPT gave a hydraulic conductivity of 24 m day−1 when analyzed using the Hvorslev method (Hvorslev, 1951). This well is screened in well-sorted sand that extends to the surface where infiltration of precipitation occurs easily. Groundwater flow occurs away from the main axis of the ridge and4is at least partially discharged along the margins of the ridge, where the POND, well NWW, SWW, and DUG sample points are located. The groundwater rise beneath the ridge had a maximum relief of about 0.30 m during the time of the study in 2010.
www.hydrol-earth-syst-sci.net/17/4897/2013/
3.2
Groundwater chemistry
The water level elevations obtained in each well, which were used to approximate the patterns of groundwater flow (Fig. 2), correlated significantly with the spatial distribution of the chemical species, except for pH and ammonium, which showed a different pattern (Table 2). Pearson’s Hydrol. Earth Syst. Sci., 17, 4897–4906, 2013
4902
P. Gbolo and P. Gerla: Nutrients in groundwater near an abandoned feedlot
5. Dendrogramshowing showing thethe Q-mode clustering of the groundwater data Fig. Figure 5. Dendrogram Q-mode clustering of the groundwater data.
product-moment correlation coefficient was used in showing the relationship between the chemical species using Systat 12 software (Systat Software, Inc., Chicago, IL, USA). Water levels showed a significant negative correlation with EC (r = −0.80, p < 0.0001), TC (r = −0.87, p < 0.0001), IC (r = −0.82, p < 0.0001), and TOC (r = −0.75, p < 0.001). Water level also showed a significant relationship with the nutrients: NO2 -N (r = 0.48, p < 0.05), NO3 -N (r = 0.65, p < 0.01), TP (r = 0.40, p < 0.05), and DRP (r = −0.55, p < 0.01). Surveyed wells with high water level had high concentration of both nitrate and nitrite. NO3 -N showed a significant and positive relationship with NO2 -N (r = 0.47, p < 0.05), but a negative relationship with NH4 -N (r = −0.40, p < 0.05). The significant relationship between these species could be as a result of formation from the same source (degradation of manure or organic material). Although there is no significant relationship between ammonia and nitrite, the relationship between the nitrate and nitrite, and nitrate and ammonium is mediated by various bacteria and the dissolution of the chemical species. This relationship forms part of the nitrogen cycle with organic carbon acting as an electron donor. NO3 -N also showed a significant relationship with TP (r = 0.45, p < 0.05), which could be attributed to the degradation of organic material (manure). This is suggested by the significant relationship between TOC and DRP (r = 0.45, p < 0.05). Slightly basic pH was measured for water samples throughout the feedlot site. pH showed a significant relationship with DRP (r = 0.45, p < 0.05), which may relate to the effect of high pH on the release of DRP into the water column. The effect of pH on the solubility of P depends on the availability of Fe, Al, and Ca. Anderson (1975) stated that high pH can increase the solubility of P, and this is due to ligand exchange where Fe-bounded P is substituted by OH. Hydrol. Earth Syst. Sci., 17, 4897–4906, 2013
6. Dendrogramshowing showing thethe R-mode clustering of the groundwater data Fig. Figure 6. Dendrogram R-mode clustering of the groundwater data.
According to Gao et al. (2012), elevated pH can result in the upward diffusion of DRP. 3.3 3.3.1
Statistical analysis Descriptive statistics
The measured temperature from the wells varied from 12.2 ◦ C in monitoring well MW2 to 19.9 ◦ C in DUG and the POND. The temperature variation was influenced by the season the samples were taken, depths of the wells, soil temperature, interaction with air temperature, and infiltration of water with different temperature regime during recharge. Monitoring well MW2 had the lowest temperature because it is deep and screened at a depth of 7 m. The highest temperatures were measured in the surface water sites DUG and POND. These are surface water sites that equilibrate with air temperature. Analysis of NH4 -N concentrations ranged from 0.01 mg L−1 in DVPT and VWP to 0.84 mg L−1 in the POND. NO2 -N ranged from 0.1 to 1.4 mg L−1 . Most of the wells had a NO2 -N concentration below 0.2 mg L−1 . DRP had concentrations ranging from 0.01 mg L−1 in NWW and G8 to 0.49 mg L−1 at DUG. DRP concentrations were generally low on the beach, compared to wetlands, apart from DVPT. TP concentrations ranged from 0.01 to 0.52 mg L−1 , with a mean concentration and standard deviation of 0.17 and 0.19 mg L−1 , respectively. The lowest TP concentration was measured from the groundwater sample collected from SPN, with MW4 having a concentration below the detection limit. The highest TP concentration was measured from well FLW. Both the lowest and highest concentrations are associated with the beach ridge. There was no defined pattern in the spatial distribution of TP at the site. The southern wetlands had relatively elevated concentrations www.hydrol-earth-syst-sci.net/17/4897/2013/
P. Gbolo and P. Gerla: Nutrients in groundwater near an abandoned feedlot 2.50 Beach Ridge Intermediate Wetland
2.00
Factor 1 Scores
1.50 1.00 0.50 0.00 -0.50 -1.00 -1.50 -1.50
-1.00
-0.50
0.00
0.50
1.00
1.50
2.00
2.50
Factor 2 Scores Figure 7. Scatter plot of the Factor 1 and 2 Scores from the varimax rotation showing three Fig. 7. Scatterplot of the factor 1 and 2 scores from the varimax clusters.
4903
values obtained for δ 15 NNO3 are consistent with values obtained by Komor and Anderson (1993) in their study of nitrogen isotopic composition of nitrate from a feedlot, where the enriched nitrogen isotope was a result of denitrification and/or dissimilatory nitrate reduction to ammonium. δ 15 NNO3 values greater than +10 ‰ are associated with nitrate obtained from human or animal waste (Seiler, 1996) as compared to the commercial N fertilizer. Enrichment of δ 15 NNO3 and δ 18 O in nitrate within groundwater is an indication of denitrification (Böttcher et al., 1990; Kendall and Aravena, 2000). Well SPN is located within an area where roughly 0.5 m of topsoil was removed (Fig. 1), exposing medium- to finegrained sand. Removal of soils and sparse vegetation likely contributed to the lowest EC, DRP, TP, TC, and IC; the relatively high pH is likely the result of buffering by abundant carbonate fragments in the sand.
rotation showing three clusters.
3.3.2 when compared to the northern wetlands (Fig. 3). This could be attributed to the clay-rich soil in the south as compared to the sandy wetland soils in the north. Soils at the site are generally carbonate-rich and have variable concentrations of iron that may contribute to7 the observed spatial patterns (Fig. 3). NO3 -N concentration ranged from 0.1 mg L−1 in the POND and DUG to 12.6 mg L−1 in FLE, with a mean and standard deviation of 0.2 and 0.4 mg L−1 , respectively. Wells NWW, SWW, and MW2 had concentrations below the detection limit of 0.1 mg L−1 , with no detection in well MW4. Spatial distribution of NO3 concentration indicated the higher concentration is associated with the beach ridge and lower concentrations occurring within the wetlands (Fig. 4). The wetlands are characterized by well-grown hybrid cattails, smooth brome, and reed canary grass, which may have an influence on the low NO3 concentrations in the wetlands. This makes the cattails and the other graminoids good for nutrient reduction within wetlands. Field parameters varied between the beach ridge and the wetlands. The highest EC was measured at well NWW. Carbon analyses indicated higher concentrations in the wetlands as compared to the beach ridge, with SPN having the lowest concentration and NWW having the highest concentration. POND, which was a former waste lagoon, was also characterized by high EC (1328 µS cm−1 ), and NH4 -N, but less NO2 -N and NO3 -N. Elevated NH4 -N and low concentration or non-detection of NO2 -N and NO3 -N in some of the wells could be an indication of denitrification, or dissimilatory nitrate reduction to ammonium. Isotopic analysis of nitrogen and oxygen in dissolved nitrate from wells FLE, FLW, and G8 indicated concentration of heavier isotopes. FLE, FLW and G8 had δ 18 ONO3 values of +30.8, +27.9, and +23.0 ‰, respectively, and δ 15 NNO3 values of +42.22, +29.38, and +33.27 ‰, respectively. The www.hydrol-earth-syst-sci.net/17/4897/2013/
Cluster and factor analyses
Eighteen sampled sites were categorized into three (3) clusters using the Q- and R-mode hierarchical cluster analyses. With the Q-mode analysis, FLW, FLE, SPN, DVPT, and MW4 comprise the first cluster and BRW, MW3, VWP, PGB, NO6, PGN, G8 and MW2 the second cluster, and SWW, NWW, DUG, POND, and NO3 the third cluster (Fig. 5). NWW and SWW had their distance of linkage greater than that of the other clusters. This linkage could be attributed to the relatively high concentration of the TC, IC, and phosphorus. There is a distinct relationship between the clusters and well locations. The first cluster wells fall along the beach ridge (recharge areas) while the third cluster is related to wetland wells (discharge zone). The second cluster wells are associated with the transition zone between the beach ridge and the wetlands. With R-mode hierarchical cluster analysis, the chemical species were grouped based on their concentrations. NH4 -N, DRP, TP, and NO2 -N were grouped together (Fig. 6). Although TC and IC had a relatively higher linkage, they were closely related by TOC and the other nutrients analyzed. Factor analysis of the chemical species was done to examine and detect the pattern of variation among the variables. This analysis was done using varimax rotation, and eigenvalues greater than one were used for the analysis because they contributed over 70 % of the total variance in the data (Table 3). The first, second, and third eigenvalues were used for the factor analysis because they were greater than one and also reflected the greatest heterogeneity in the data distribution. Chemical species with factor loadings greater than 0.50 were considered to be the main cause of variability in the data (Table 4). With the R-mode factor analysis, three main factors were generated that may be the cause of variations in the hydrochemistry. Factor 1 accounted for 82.0 % of the total variation in the data, and this was caused by TC, IC, TOC, and Hydrol. Earth Syst. Sci., 17, 4897–4906, 2013
4904
P. Gbolo and P. Gerla: Nutrients in groundwater near an abandoned feedlot
Table 3. Eigenvalues of the correlation matrices explained by the various factors. Initial eigenvalue obtained
Eigenvalues obtained after rotation
Factor
Eigenvalues
Cumulative variance
Variance (%)
Cumulative variance %
1 2 3 4 5 6 7
2.909 1.706 1.061 0.910 0.727 0.411 0.275
2.909 4.615 5.676 6.586 7.313 7.724 7.999
36.367 21.328 13.264 11.376 9.089 5.138 3.438
36.367 57.695 70.959 82.335 91.424 96.562 100.00
*Eigenvalues
Variance (%)
Cumulative (%)
2.285 1.846 1.085
28.557 23.076 13.562
28.557 51.633 65.195
The italic values are eigenvalues greater than 1, which forms more than 70 % of the variance in the data. * Eigenvalues used for the analysis.
Table 4. Factor loading matrix obtained from the varimax rotation. Chemical species
Factor 1
Factor 2
Factor 3
Communality
TC IC TOC N02 -N N03 -N NH4 -N DRP TP
0.947 0.868 0.721 −0.228 −0.251 −0.016 0.586 0.180
−0.019 0.071 −0.264 0.683 0.776 −0.141 −0.114 0.818
0.162 0.286 −0.267 −0.114 −0.359 0.905 −0.106 0.134
0.923 0.840 0.661 0.531 0.794 0.839 0.368 0.719
Table 5. Factor scores used in plotting the clusters. Location
Well
*F1
*F2
F3
Beach ridge
FLW FLE SPN DVPT MW4 G8
−0.64 −0.83 −1.20 −1.10 −1.23 −0.97
2.27 1.46 −0.84 −0.67 −1.04 −0.72
−0.32 −0.13 −0.43 −0.61 −0.11 −0.72
Intermediate
BRW MW3 VWP PGB NO6 PGN MW2 NO3
0.31 −0.10 −0.40 −0.05 0.33 −0.45 −0.11 0.42
1.62 0.84 −0.51 −0.51 0.24 −0.10 −0.68 0.22
−0.43 −0.12 −0.25 0.55 0.44 −0.55 −0.68 1.78
Wetland
SWW NWW DUG POND
1.74 1.91 1.71 0.66
0.63 −0.23 −1.26 −0.72
−0.15 −1.58 1.11 −0.99
Italic values are values that accounted for the variability within the data.
DRP. This explains the positive correlations between factor 1 and TC, IC, TOC, and DRP. These relationships could be an indication of a similar source (decomposition of manure or organic material). Factor 2 accounted for 79.0 % in the variability of the hydrochemistry. This variation was caused by NO2 -N, NO3 -N, and TP, which had positive high loadings. This explains why NO2 -N, NO3 -N, NO3 -N, and TP are positively correlated with factor 2. This association could also be an indication of a similar source (mineralized organic matter or manure). The variations in factor 1 and 2 could also be due to the relationship between the chemical species and water level in the wells. With factor 1, TC, IC, TOC, and DRP were the main causes of variability, but these species had a significant negative relationship to water level. The decomposition of organic material depends on water level, and this can result in reduced carbon concentration (Tulina et al., 2009). In the presence of moisture or water, available DRP is depleted by plants and other microbes. With factor 2, the variability was caused by NO2 -N, NO3 -N, and TP. These chemical species also had a significant positive relationship with water levels. With factor 3, 39 % of the variability was caused by only NH4 -N, 31 % caused by the other nutrients, and 30 % by the carbons. The nutrients, TC, and IC were not considered because they had factor loadings less than 0.50. Hydrol. Earth Syst. Sci., 17, 4897–4906, 2013
* The two factor score estimates that were plotted in Fig. 7.
The variability caused by NH4 -N was insignificant, and this could be attributed to variable redox processes and biotic activities within and surrounding well screens. In general, the relationships between the chemical species likely indicate a common source (decomposition of manure or organic materials). The fluctuation in the nitrate, nitrite, and ammonium could be related to denitrification and dissimilatory NO3 reduction to NH4 or plant uptake while that of DRP and TP could be due to sorption, desorption, precipitation, or dissolution of P from the water–sediment interface. Apart from well MW3, which showed a relatively high NO3 concentration, analysis of water from the deeper monitoring wells indicated low nitrate concentrations. This well lies within a surface runoff path, and the well is hydrologically connected to the excavated lagoon (POND). This is an www.hydrol-earth-syst-sci.net/17/4897/2013/
P. Gbolo and P. Gerla: Nutrients in groundwater near an abandoned feedlot indication of possible stratification of the pond, with the bottom having high NO3 concentration. The factor analysis sorted the hydrochemical data into three groups, similar to that of the cluster analysis (Table 5 and Fig. 7), which indicates the similarity between the Rmode cluster analysis (Fig. 6) and the R-mode factor analysis (Fig. 7). 4
Conclusions
Results of this study have indicated that multivariate analysis can be a valuable tool in characterizing the distribution of nutrients or contaminants, and can be used in explaining the variability in surface and groundwater chemistry. Multivariate statistics performed on nutrients and carbon at the feedlot and its adjacent wetlands revealed three groups, which were based on the well locations (beach ridge, wetlands, and intermediate positions). Three factors were obtained, and the data analysis suggests variability caused by IC, OC, and DRP in the first factor, NO3 , NO2 , and TP in the second factor, and NH4 in the third factor. This result was consistent with what was obtained in the R-mode hierarchical cluster analysis. Abandoned feedlots and wetlands characterized by high nutrient concentration undergo different biogeochemical processes that result in the reduction of nutrient concentrations. Analyses of nutrients in groundwater system at an abandoned feedlot revealed relatively elevated concentration of NO3 at the source (beach ridge) as compared to the wetland. This could result from the effects of the processes involved in nutrient cycling. The spatial distribution of NO3 was consistent with the pattern of groundwater movement, where the recharge area (beach ridge) had higher NO3 concentrations as compared to the discharge areas (wetlands). The low concentration of NO3 in the wetlands could be attributed to the low water level, the high rate of denitrification, dissimilatory NO3 reduction to NH4 , and NO3 uptake by the graminoids. Careful site selection and natural design of feedlot facilities can help mitigate off-site transport of nutrients. Harvesting and recycling of vegetative biomass rather than burning can aid in reducing nutrient concentrations within nutrientcontaminated areas, especially wetlands. Acknowledgements. The authors of this manuscript acknowledge the Plains and Prairie Potholes Landscape Conservation Cooperative (PPP-LCC), US Geological Survey, U.S. Fish and Wildlife Services, North Dakota View, and Alan Cvancara Graduate Field Research Scholarship program for financial support for this research. The authors express gratitude to the reviewers for their constructive criticism and comments, which significantly improved this manuscript. Edited by: Z. Bargaoui
www.hydrol-earth-syst-sci.net/17/4897/2013/
4905
References Anazawa, K. and Ohmori, H.: The hydrochemistry of surface waters in andesite volcanic area, Norikura volcano, central Japan, Chemosphere, 59, 605–615, 2005. Anderson, J. M.: Influence of pH on release of phosphorus from lake sediments, Arch. Hydrobiol., 76, 411–419, 1975. Boruvka, L., Vecek, O., and Jehlicka, J.: Principal component analysis as a tool to indicate the origin of potentially toxic elements in soil, Geoderma, 128, 289–300, 2005. Böttcher, J., Strebel, O., Voerkelius, S., and Schmidt, H. L.: Using isotope fractionation of nitrate-nitrogen and nitrate-oxygen for evaluation of microbial denitrification in a sandy aquifer, J. Hydrol., 114, 413–424, 1990. Burwell, R. E., Timmons, D. R., and Holt, R. F.: Nutrient transport in surface runoff as influenced by soil cover and seasonal periods, Soil Sci. Soc. Am. J., 39, 523–528, 1974. Carpenter, S. R., Caraco, N. F., Correll, D. L., Howarth, R. W., Sharpley, A. N., and Smith, V. H.: Nonpoint pollution of surface waters with phosphorus and nitrogen, Ecol. Appl., 8, 559–568, 1998. Ciria, M. P., Solano, M. P., and Soriano, P.: Role of macrophyte Typha latifolia in a constructed wetland for wastewater treatment and assessment of its potential as a biomass fuel, Biosyst. Eng., 92, 535–544, 2005. Craft, C.: Freshwater input structures soil properties, vertical accretion, and nutrient accumulation of Georgia and U.S. tidal marshes, Limnol. Oceanogr., 52, 1220–1230, 2007. Davis, J. C.: Statistics and data analysis in geology, 3rd Edn., John Wiley and Sons Inc., New York, p. 638, 2002. DeCoster, J.: Overview of factor analysis, available at: www. stat-help.com/notes.html (last access: 27 March 2011), 1998. Duncan, M. R., Taylor, R. D., Saxowsky, D. M., and Koo, W. W.: Economic feasibility of the cattle feeding industry in the Northern Plains and Western Lakes States, Agricultural Economic Report, No. 370, Department of Agricultural Economics, North Dakota State University, 1–11, 1997. Fernandez, G.: Data mining using SAS applications, Chapman and Hall/CRC, p. 91, 2002. Gao, Y., Cornwell, J. C., Stoecker, D. K., and Owens, M. S.: Effects of cyanobacterial-driven pH increases on sediment nutrient fluxes and coupled nitrification-denitrification in a shallow fresh water estuary, Biogeosciences, 9, 2697–2710, doi:10.5194/bg-92697-2012, 2012. Gilley, J. E. and Risse, L. M.: Runoff and soil loss as affected by the application of manure, Trans. ASAE, 43, 1583–1588, 2000. Harris, K. L., Moran, S. R., and Clayton, L.: Late Quaternary stratigraphic nomenclature, Red River Valley, North Dakota and Minnesota. North Dakota Geological Survey Miscellaneous Series 52, p. 47, 1974. Hogarty, K. Y., Hines, C. V., Kromrey, J. D., Ferron, J. M., and Mumford, K. R.: The quality of factor solution in exploratory factor analysis: The influence of sample size, communality and overdetermination, Educ. Psychol. Measure., 65, 202–226, 2005. Hopkinson, C. S.: A comparison of ecosystem dynamics in freshwater wetlands, Estuaries, 15, 549–562, 1992. Hvorslev, M. J.: Time Lag and Soil Permeability in Ground-Water Observations, Bull. No. 36, Waterways Exper. Sta. Corps of Engrs, US Army, Vicksburg, Mississippi, p. 50, 1951.
Hydrol. Earth Syst. Sci., 17, 4897–4906, 2013
4906
P. Gbolo and P. Gerla: Nutrients in groundwater near an abandoned feedlot
Jongbloed, A. W. and Lenis, N. P.: Environmental concerns about animal manure, J. Anim. Sci., 76, 2641–2648, 1998. Kendall, C. and Aravena, R.: Nitrate isotopes in groundwater systems, Environmental Tracers in Subsurface Hydrology, edited by: Cook, P. and Herczeg, A., 261–297, Kluwer Academic Publisher, Boston, MA, USA, 2000. Komor, S. C. and Anderson Jr., H. W.: Nitrogen isotopes as indicators of nitrate sources in Minnesota sand-plain aquifer, Groundwater, 31, 260–270, 1993. Krishna, A. K., Mohan, K. R., and Murthy, N. N.: A multivariate statistical approach for monitoring of heavy metals in sediments: a case study from Wailpalli Watershed, Nalgonda District, Andhra Pradesh, India, Res. J. Environ. Earth Sci., 3, 103–113, 2010. MacCallum, R. C., Widaman, K. F., Zhang, S., and Hong, S.: Sample size in factor analysis, Psychol. Methods., 4, 84–99, 1999. Mielke, L. N. and Ellis, J. R.: Nitrogen in soil cores and groundwater under abandoned feedlot, J. Environ. Qual., 5, 71–75, 1976. Minnesota Department of Health (MDH): County Well Index Outline, available at: http://mdh-agua.health.state.mn.us/cwi/ cwiViewer.htm (14 November 2012), 2007. Olson, B. M. and Paterson, B. A.: Implications of moving to a phosphorus based system for manure application. Page 1 in: Manure Management Planning: The Essentials. Cooperative Extension Series. Alberta Agriculture, Food and Rural Development, Edmonton, Alberta, Canada, 2005. Paine, M. D., Teter, N., and Guyer, P.: Feedlot layout. GPE-5201, Great Plains Beef Cattle Handbook, Cooperative Extension Service, Oklahoma State University, Stillwater, Oklahoma, p. 6, 1976. Preacher, K. J. and MacCallum, R. C.: Exploratory Factor Analysis in Behavior Genetics Research: Factor Recovery with Small Sample Sizes, Behavior Genetics, 3, 153–161, 2002. Scott, C. A., Walter, M. F., Brooks, E. S., Boll, J., Hes, M. B., and Merrill, M.D.: Impacts of historical changes in land use and dairy herds on water quality in the Catskills Mountains, J. Environ. Qual., 27, 1410–1417, 1998. Seiler, R. L.: Methods for identifying sources of nitrogen contamination of groundwater in valleys in Washoe County, Nevada: US Geological Survey Open-File Report 96–461, p. 20, 1996.
Hydrol. Earth Syst. Sci., 17, 4897–4906, 2013
Stewart, H. T., Hopmans, P., Flinn, D. W., and Hillman, T. J.: Nutrient accumulation in trees and soil following irrigation with municipal effluent in Australia, Environ. Pollut., 63, 155–77, 1990. Tappin, A. D.: An examination of the fluxes of nitrogen and phosphorus in temperate and tropical estuaries: Current estimates and uncertainties, Estuar. Coasta. Shelf Sci., 55, 885–901, 2002. Tulina, A. S., Semenov, V. M., Rozanova, L. N., Kuznetsova, T. V., and Semenova, N. A.: Influence of moisture on the stability of soil organic matter and plant residues, Euras. Soil Sci., 42, 1241–1248, 2009. US Department of Agriculture (USDA): Soil survey of Polk County, Minnesota, available at: http://websoilsurvey.nrcs.usda.gov/app/ WebSoilSurvey.aspx (last access: 15 July 2013), 2012. USEPA: Environmental impacts of animal feeding operations. Washington DC: EPA, Office of Water, Standards and Applied Sciences Division, 1999. USEPA: National Pollution Discharge Elimination System Permit regulation and effluent limitation guidelines and standards for concentrated animal feeding operations (CAFOs), Federal Register, 68, 7176–7274, 2003. Vega, M., Pardo, R., Barrado, E., and Deban, L.: Assessment of seasonal and polluting effects on the quality of river water by exploratory data analysis, Water Res., 32, 3581–3592, 1998. Wyngaard, N., Picone, L., Videla, C., Zamuner, E., and Maceira, N.: Impact of feedlot on soil phosphorus concentration, J. Environ. Protect., 2, 280–286, 2011. Yidana, S. M., Ophori, D., and Banoeng-Yakubo, B.: A multivariate statistical analysis of surface water chemistry data-The Ankobra Basin, Ghana, J. Environ. Manage., 86, 80–87, 2008. Zhang, Y., Guo, F., Meng, W., and Wang, X. Q.: Water quality assessment and source identification of Daliao river basin using multivariate statistical methods, Environ. Monit. Assess., 152, 105–121, 2009. Zhou, J., Ma, D., Pan, J., Nie, W., and Wu, K.: Application of multivariate statistical approach to identify heavy metal sources in sediments and waters: a case study in Yangzhong, China, Environmen. Geol., 54, 373–380, 2008.
www.hydrol-earth-syst-sci.net/17/4897/2013/