FINDING AN OPTIMAL SEGMENTATION FOR AUDIO GENRE CLASSIFICATION Stephen Cox School of Computing Sciences University of East Anglia, Norwich, NR4 7TJ, UK.
[email protected]
Kris West School of Computing Sciences University of East Anglia, Norwich, NR4 7TJ, UK.
[email protected]
ABSTRACT In the automatic classification of music many different segmentations of the audio signal have been used to calculate features. These include individual short frames (23 ms), longer frames (200 ms), short sliding textural windows (1 sec) of a stream of 23 ms frames, large fixed windows (10 sec) and whole files. In this work we present an evaluation of these different segmentations, showing that they are sub-optimal for genre classification and introduce the use of an onset detection based segmentation, which appears to outperform all of the fixed and sliding windows segmentation schemes in terms of classification accuracy and model size. Keywords: genre, classification, segmentation, onset, detection
1
INTRODUCTION
In recent years the demand for automatic, content-based multimedia analysis has grown considerably due to the ever increasing quantities of multimedia content available to users. Similarly, advances in local computing power have made local versions of such systems more feasible. However, the efficient and optimal use of information available in a content streams is still an issue, with very different strategies being employed by different researchers. Audio classification systems are usually divided into two sections: feature extraction and classification. Evaluations have been conducted both into the different features that can be calculated from the audio signal and the performance of classification schemes trained on those features. However, the optimum length of fixed-length segmentation windows has not been investigated, nor whether fixed-length windows provide Permission to make digital or hard copies of all or part of this work for personal or classroom use is granted without fee provided that copies are not made or distributed for profit or commercial advantage and that copies bear this notice and the full citation on the first page. c
2005 Queen Mary, University of London
680
good features for audio classification. West and Cox (2004) compared systems based on short frames of the signal (23 ms), with systems that used a 1 second sliding window of these frames, to capture more information than was available in the individual audio frames, and a system that compressed an entire piece to just a single vector of features (Tzanetakis, 2003). Tzanetakis et al. (2001) demonstrates a system based on a 1 second sliding window of the calculated features and in Tzanetakis (2003), a whole file based system. Schmidt and Stone (2002) and Xu et al. (2003) investigated systems based on the classification of individual short audio frames (23 ms) and Jiang et al. (2002) classifies overlapped 200 ms analysis frames. West and Cox (2004) showed that it is beneficial to represent an audio sample as a sequence of features rather than a single probability distribution. We also demonstrated that a tree-based classifier gives improved performance on these features over a “flat” classifier. In this paper we introduce a new segmentation based on an onset detection function, which outperforms the fixed segmentations in terms of both model size and classification accuracy. The paper is organised as follows: first we discuss the modelling of musical events in the audio stream, then the parameterisations used in our experiments, the development of onset detection functions for segmentation, the classification scheme we have used and finally the results achieved and the conclusions drawn from them.
2
MODELLING EVENTS IN THE AUDIO STREAM
Averaging sequences of features calculated from short audio frames (23 ms) across a whole piece tends to drive the distributions from each class of audio towards the centre of the feature space, reducing the separability of the classes. Therefore, it is more advantageous to model the distributions of different sounds in the audio stream than the audio stream as a whole. Similarly, modelling short audio frames from a signal is also sub-optimal as a musical event is composed of many different frames, occupying different locations in the feature space. This leads to a very complex set of distributions of features for each piece that are both hard to model and contain less information
for classification than the distribution of features from a single musical event would. Sounds do not occur in fixed length segments and when human beings listen to music, they are able to segment the audio into individual events without any conscious effort, or prior experience of the timbre of the sound. This suggests the possibility of segmenting an audio stream as a sequence of musical events or simultaneously occurring musical events. We believe that directed segmentation techniques, such as onset detection, should be able to provide a much more informative segmentation of the audio data for classification than any fixed length segmentation due to the fact that sounds do not occur in fixed length segments. Systems based on long sliding windows (e.g. 1 second) that are highly overlapped are a step in the right direction, as they allow a classification scheme to attempt to model multiple distributions for a single class of audio. However, they complicate the distributions as long windows are likely to capture several different musical events. This style of segmentation also includes a very large amount redundant information as a single sound may contribute to 80 or more feature vectors (based on a 1 sec window, over 23 ms frames with a 50% overlap). A segmentation based on an onset detection technique allows a musical event to be represented by a single vector of features and ensures that only individual events or events that occur simultaneously contribute to that feature vector.
3
EXPERIMENTAL SETUP PARAMETERISATION
In Jiang et al. (2002) an Octave-based Spectral Contrast feature is proposed, which is designed to provide better discrimination among musical genres than Mel-Frequency Cepstral Coefficients. In order to provide a better representation than MFCCs, Octave-based Spectral Contrast features consider the strength of spectral peaks and valleys in each sub-band separately, so that both relative spectral characteristics, in the sub-band, and the distribution of harmonic and non-harmonic components are encoded in the feature. In most music, the strong spectral peaks tend to correspond with harmonic components, whilst nonharmonic components (stochastic noise sounds) often appear in spectral valleys (Jiang et al., 2002), which reflects the dominance of pitched sounds in Western music. Spectral Contrast is a way of mitigating against the fact that averaging two very different spectra within a sub-band could lead to the same average spectrum. A full description of the procedure for calculating Spectral Contrast feature is beyond the scope of this paper. However, an overview of the process and the similarities with the calculation of MFCCs is shown in Figure 1.
4
EXPERIMENTAL SETUP SEGMENTATIONS
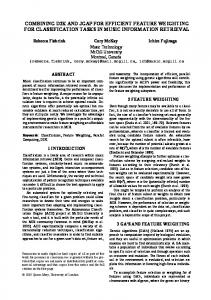
Initially, audio is sampled at 22050Hz and the two stereo channels channels summed to produce a monaural signal. It is then divided into overlapping analysis frames and Hamming windowed. Spectral contrast features are calculated for each analysis frame and then, optionally,
Figure 1: Overview of Spectral Contrast Feature calculation
Figure 2: Audio segmentations and temporal modelling windows evaluated the means and variances of these frames are calculated (replacing the original parameterisation), using a sliding window across the whole file, or across segments identified using an onset detection function, returning one vector of features per segment. The segmentations evaluated in this system are: 23 ms audio frames, 200 ms audio frames, 23 ms audio frames with a 1 second sliding temporal modelling window, 23 ms audio frames with non-overlapping 10 second windows, 23 ms audio frames with whole file temporal modelling (returns 1 vector per file), 23 ms audio frames with onset detection based segmentation and temporal modelling. These segmentations are schematically shown in Figure 2. 4.1
Developing Onset detection functions
Energy based onset detection techniques have been used by a number of researchers to segment audio, including Goto and Muraoka (1995), Dixon et al. (2003), Heittola and Klapuri (2002), Schloss (1985) and Duxbury et al. (2003). The essential idea is that peaks in the positive differences in the signal envelope correspond to onsets in the audio stream, i.e. the beginning of musical events. 4.1.1
Thresholding an onset detection function
An onset is detected at a particular audio frame if the onset detection function is greater than a specified threshold, and that frame has a greater onset detection function value than all the frames within a small isolation window. Duxbury et al. (2003) use a dynamic median threshold to “peak-pick” the detection function, as shown in Figure 3. A relatively short window (1 - 2 seconds) of the onset detection function is used to calculate a median, which is then used as the threshold. A weight can also be applied
681
4.1.3
Figure 3: An onset detection plot with dynamic thresholding
Figure 4: Spectrogram of male voice with vibrato
to the median in order to adjust the threshold slightly. Our initial experiments showed that a dynamic threshold was always more successful than a fixed threshold, so the dynamic threshold is used in all the reported experiments. 4.1.2
Improving performance of energy based techniques
Several authors have addressed the integration, along the frequency axis, of the perceived magnitude of an audio signal by calculating changes in each bin output by an FFT and integrating their results, (Duxbury et al., 2003). Unfortunately, this technique is vulnerable to false detections in the presence of pitch oscillations within a single event, such as vibrato in a singer’s voice. This effect is shown in fig 4. The oscillations caused by vibrato move the energy into a different FFT bin at a rate of about 3 - 5 Hz. One solution to this is to divide the frequency domain into a smaller number of overlapping bands, integrate the energy within a band and then calculate the first order differences, which are subsequently integrated across the bands. We used the Mel-frequency scale and the Octave scale for this non-linear integration of bands. The former approximates a model of the human perception of sound, whilst the later is based on one of the primary scales used in music. Initial experiments have shown that the octave scale, which uses fewer, much broader bands, is much less successful for this task. This may be because the bands are broad enough that the sustained portions of several concurrent sounds overlap within a band and the onset of the later sounds may be missed and interpreted as the sustained portion of the first event. Therefore, results reported here are for Mel-scale or FFT bands.
682
FFT Phase based onset detection
In Bello and Sandler (2003) an alternative to energy-based onset detection techniques for musical audio streams is proposed and Duxbury et al. (2003) combined it with existing techniques to produce a complex domain onset detection function. When performing spectral analysis of a signal, it is segmented into a series of analysis frames and a Fast Fourier transformation (FFT) is applied to each segment. The transform returns a magnitude |S (n, k) | and a phase ϕ(n, k) for each bin. The unwrapped phase, ϕ˜ (n, k), is the absolute phase mapped to the range [−π, π]. Energy based techniques consider only the magnitude of the FFT and not the phase, which contains the timing information of the signal. A musical event can be broken down in to three stages; the onset, the sustained period and the offset. During the sustained period of a pitched note, we would expect both the amplitude and phase of the FFT to remain relatively stable. However during a transient (onsets and offsets) both are likely to change significantly. During attack transients, we would expect to see a much higher level of deviation than during the sustained part of the signal. By measuring the spread of the distribution of these phase values for all of the FFT bins and applying a threshold we can construct an onset detection function. Peaks in this detection function correspond to both onset and offset transients so it may need to be combined with the magnitude changes to differentiate onsets and offsets. 4.1.4
Optimisation
A dynamic median has three parameters that need to be optimised in order to achieve the best performance, the median window size, the onset isolation window size and the threshold weight. In order to determine the best possible accuracy achievable with each onset detection technique, an exhaustive optimisation of these parameters was made. To achieve this, a ground-truth transcription of the onset times of the notes in a number test pieces was required. This was produced by hand. Eight test pieces, from four genres, were annotated for this task, each of length 1 minute. The best performing onset detection functions from a set of 20 potential functions were examined. These included entropy, spectral centroid, energy and phase based functions. The results achieved are listed in Table 1. The detection functions are evaluated by the calculation of Fmeasure, which is the harmonic mean of the precision (# correct prediction / total # predictions) and recall (# correct predictions / # onsets in the original files). An onset is considered correct if it is within 30 ms of a ground-truth onset. F-measure penalises large differences between precision and recall and yields a balanced evaluation metric. A generalisation of F-measure can be used to weight the importance of each component statistic, but in this context they are of equal importance. The window sizes are reported in numbers of frames, where the frames are 23ms in length and are overlapped by 11.5ms. Where a range
Figure 5: Noise reduction in detection functions with a Mel-scale filter-bank of values achieve the same accuracy the smallest window sizes are returned to keep memory requirements as low as possible. Table 1 shows that the two best best performing functions (results 4 and 5) are based on energy or both energy and phase deviations in Mel-scale bands. Both techniques have the very useful feature that they do not require a threshold to be set in order to obtain optimal performance. The small increase in accuracy demonstrated by the Mel-band detection functions over the FFT band functions can be attributed to the reduction of noise in the detection function, as shown in Figure 5.
Figure 6: Overview of an iteration of the classification tree training process where t is the current node, p (Cj |t) and p (Ci |t) are the prior probabilities of the i-th and j-th classes, at node t, respectively. The best split of node t is the split s that maximises the change in diversity ( ∆d (s, t) ), which is given by: ∆d (s, t) = d (t) − PL d (tL ) − PR d (tR )
5
CLASSIFICATION SCHEME
In West and Cox (2004) we presented a new model for the classification of feature vectors, calculated from an audio stream and belonging to complex distributions. This model is based on the building of maximal binary classification trees, as described by Breiman et al. (1984). These are conventionally built by forming a root node containing all the training data and then splitting that data into two child nodes by the thresholding of a single variable, a linear combination of variables or the value of a categorical variable. We have significantly improved this model by replacing the splitting process, which must form and evaluate a very large set of possible single variable splits, with a pair of single Gaussian distributions, tested with Mahalanobis distance measurements. The single Gaussian distributions can be estimated with either diagonal or full covariance matrices, however full covariance matrix distributions take significantly longer to estimate. At each node the set of possible splits are enumerated by forming all the combinations of audio classes, without repetition or permutations. A single Gaussian classifier is trained to duplicate each of these splits and the classifier returning the best split is selected and finalised. 5.1
Selecting the best split
There are a number of different criteria available for evaluating the success of a split. In this evaluation we have used the Gini index of Diversity described by Breiman et al. (1984), which is given by: X d (t) = p (Ci |t) p (Cj |t) (1) i,j,i6=j
(2)
where PL and PR are the proportion of examples in the child nodes tL and tR respectively. The Gini criterion will initially group together classes that are similar in some characteristic, but towards the bottom of the tree, will prefer splits that isolate a single class from the rest of the data. An diagrammatic overview of the splitting process is shown in Figure 6. 5.2
Maximum liklihood classification
When classifying a novel example, a likelihood of membership of each class is estimated as the percentage of the training data belonging to each class at the leaf node that the input feature vector exited the tree at, normalised by the prior probabilities of the classes. A whole piece is classified by summing the log likelihoods of each feature vector, which is equivalent to taking the product of the likelihoods values, and selecting the class with the highest likelihood. One difficulty with this technique is that not all classes have counts at every leaf node, and hence some of the likelihoods are zero. This would lead to a likelihood of zero for any class for which this had occurred. This situation might arise if the model is presented with an example containing a timbre that was not seen in that class during training. An example of this might be a reggae track containing a trumpet solo, when trumpets had previously only been seen in the Classical and Jazz classes. Therefore, the likelihoods are smoothed using Lidstone’s law, (Lidstone, 1920). The equation for Lidstone’s smoothing is: PLi (i|N ) =
(ni + 0.5) (n + (0.5 ∗ C))
(3)
683
Table 1: Onset Detection Optimisation results 1 2 3 4 5
Onset detection function Median win Threshold wt 2nd order FFT band positive 1st order energy differences, summed 30 0.9 Phase deviations multiplied by 1st order energy differences in FFT 30 0.2 bands, summed 1st order FFT band positive energy differences, summed 30 0.2 1st order positive energy differences in Mel-scale bands, summed 30 0.0 Phase deviations multiplied by 1st order energy differences in Mel30 0.0 scale bands, summed Optimisation results calculated over eight 60 second samples
where PLi is the smoothed likelihood of class i, N is the leaf node that the feature vector was classified into, ni is the number of class i training vectors at node N , n is the total number of training vectors at node N and C is the number of classes.
6
TEST DATASET AND EXPERIMENTAL SETUP
In this evaluation models were built to classify audio into 7 genres; Rock, Reggae, Heavy Metal, Classical, Jazz & Blues, Jungle and Drum & Bass. Each class was composed of 150, 30 second samples selected at random from the audio database. Each experiment was performed with 3-fold cross validation. 6.1
Onset-detection based temporal modelling
Results reported as using “onset-detection based temporal modelling” were segmented with the best performing onset detector, as detailed in section 4.1. This was a phase and energy based onset detector that takes the product of the phase and energy deviations in Mel-scale bands, sums the bands and half-wave rectifies the result in order to produce the final onset detection function.
7 7.1
CLASSIFICATION RESULTS
Analysis
The classification results in Table 2 show a clear advantage for the modelling of a sequence of features (results 4, 5, 6, 7 and 8) over the modelling of a single probability distribution of those features (results 1 and 3). However, the direct modelling of a sequence frames (both 23 ms and 200 ms frames) is a very complex problem, as shown by the very large number of leaf nodes in the decision tree models trained on that data. Only diagonal covariance models were trained on this data as the training time for these models was the longest by far. The use of a sliding temporal modelling window (results 5 and 6) both significantly improves the accuracy of these results and simplifies the models trained on the data, whilst including the same number of feature vectors. The use of an onset detection based segmentation and temporal modelling (results 7 and 8) yielded slightly better classification results, significantly smaller feature file sizes, simplified decision tree models and significantly faster execution times than either of the sliding temporal modelling window results. The increased efficiency
684
Isolation win 14 16
F-measure 80.27% 84.54%
16 16 16
86.87% 86.87% 88.92%
of the model training process can be attributed to the removal of redundant data in the parameterisation. In the sliding window results this redundant data is useful as the complex decision trees must be grown to describe the many distributions and the extra data allows the accurate estimation of covariance matrices at lower branches of the tree. As the decision trees for data segmented with onset detection are simpler, the redundant data is not necessary. A possible explanation for the ability of the directed segmentation to produce simpler decision tree models is that it divides the data into “semantically meaningful” units, in a similar way to the decomposition produced by human perception of audio, i.e. into individual sounds. An individual sound will be composed of a variety of audio frames, some of which will be shared by other, very different sounds. This produces complex distributions in feature space, which are hard to model. The use of a temporal modelling window simplifies these distributions as it captures some of the local texture, i.e. the set of frames that compose the sounds in the window. Unfortunately, this window is likely to capture more than one sound, which will also complicate the distributions in feature space. The use of full covariance matrices in the Gaussian classifiers consistently simplifies the decision tree model. However, it does not neccesarily increase clasification accuracy and introduces an additional computational cost. Using full covariance models on the sliding window data reduced the model size by a third but often had to be reduced to diagonal covariance at lower branches of the tree, due to there being insufficient data to accurately estimate a full covariance matrix. Using full covariance models on the segmented data reduced the model size by two thirds and produced a significant increase in accuracy. This may be due to the fact that the segmented data produces fewer, more easily modelled distributions without the complications that were introduced by capturing multiple sounds in the sliding window.
8
CONCLUSION
We have shown that onset detection based segmentations of musical audio provide better features for classification than the fixed or sliding segmentations examined. These features produced from onset detection based segmentations are both simpler to model and produce more accurate models. We have also shown, by eliminating redundancy, that they make a more efficient use of the
Table 2: Segment Classification results Model description Covar Accuracy Std Dev Leaf Nodes Run-time File size 23ms audio frames with whole file window diag 65.60% 1.97% 102 2,602 s 1.4 Kb 23ms audio frames diag 68.96% 0.57% 207,098 1,451,520 s 244 Kb 23ms audio frames with non-overlapping 10s windiag 70.41% 2.21% 271 2,701 s 1.8 Kb dow 4 200ms audio frames full 72.02% 0.13% 48,527 102,541 s 29 Kb full 79.69% 0.67% 18,067 47,261 s 244 Kb 5 23ms audio frames with sliding 1s window 6 23ms audio frames with sliding 1s window diag 80.59% 1.75% 24,579 24,085 s 244 Kb 7 23ms audio frames with onset detection based segdiag 80.42% 1.14% 10,731 4,562 s 32 Kb mentation 8 23ms audio frames with onset detection based segfull 83.31% 1.59% 3,317 16,214 s 32 Kb mentation Results calculated using 3-fold cross validation and profiled using a 2.2 GHz AMD Athlon processor with 1 Gb of DDR RAM 1 2 3
data available in the audio stream. This supports the contention that onset detection based segmentation of an audio stream leads to more musically meaningful segments, which could be used to produce better content based music identification and analysis systems than other segmentations of the audio stream. We have also shown that Mel-band filtering of onset detection functions and the combination of detection functions in Mel-scale bands, reduces noise and improves the accuracy of the final detection function.
ACKNOWLEDGEMENTS All of the experiments in this evaluation were implemented in the Music-2-Knowledge (M2K) toolkit for Data-2-Knowledge (D2K). M2K is an opensource JAVA-based framework designed to allow Music Information Retrieval (MIR) and Music Digital Library (MDL) researchers to rapidly prototype, share and scientifically evaluate their sophisticated MIR and MDL techniques. M2K is available from http://music-ir.org/evaluation/m2k.
REFERENCES J. P. Bello and M. Sandler. Phase-based note onset detection for music signals. In In proceedings of the IEEE International Conference on Acoustics, Speech, and Signal Processing. Department of Electronic Engineering, Queen Mary, University of London, Mile End Road, London E1 4NS, 2003. L. Breiman, J. H. Friedman, R. A. Olshen, and C. J. Stone. Classification and Regression Trees. Wadsworth and Brooks/Cole Advanced books and Software, 1984. S. Dixon, E. Pampalk, and G. Widmer. Classification of dance music by periodicity patterns. In Proceedings of the Fourth International Conference on Music Information Retrieval (ISMIR) 2003, pages 159–166, Austrian Research Institute for AI, Freyung 6/6, Vienna 1010, Austria, 2003. C. Duxbury, J. P. Bello, M. Davis, and M. Sandler. Complex domain onset detection for musical signals. In Proceedings of the 6th Int. Conference on Digital Audio
Effects (DAFx-03), London, UK. Department of Electronic Engineering, Queen Mary, University of London, Mile End Road, London E1 4NS, 2003. M. Goto and Y. Muraoka. Beat tracking based on multiple-agent architecture – A real-time beat tracking system for audio signals. In Proceedings of the First International Conference on Multi-Agent Systems (1995). MIT Press, 1995. T. Heittola and A. Klapuri. Locating segments with drums in music signals. In Proceedings of the Third International Conference on Music Information Retrieval (ISMIR). Tampere University of Technology, 2002. D.-N. Jiang, L. Lu, H.-J. Zhang, J.-H. Tao, and L.-H. Cai. Music type classification by spectral contrast feature. In Proceedings of IEEE International Conference on Multimedia and Expo (ICME02), Lausanne Switzerland, Aug 2002. G. J. Lidstone. Note on the general case of the bayeslaplace formula for inductive or a posteriori probabilities. Transactions of the Faculty of Actuaries, 8:182– 192, 1920. W. Schloss. On the Automatic Transcription of Percussive Music: From Accoustic Signal to High Level Analysis. PhD thesis, Stanford University, CCRMA., 1985. A. P. Schmidt and T. K. M. Stone. Music classification and identification system. Technical report, Department of Computer Science, University of Colorado, Boulder, 2002. G. Tzanetakis. Marsyas: a software framework for computer audition. Web page, October 2003. http://marsyas.sourceforge.net/. G. Tzanetakis, G. Essl, and P. Cook. Automatic musical genre classification of audio signals. In Proceedings of The Second International Conference on Music Information Retrieval and Related Activities, 2001. K. West and S. Cox. Features and classifiers for the automatic classification of musical audio signals. In Proceedings of the Fifth International Conference on Music Information Retrieval (ISMIR), 2004. C. Xu, N. C. Maddage, X. Shao, F. Cao, and Q. Tian. Musical genre classification using support vector machines. In in Proceedings of ICASSP 03, Hong Kong, China., pages 429–432, April 2003.
685