Finding Consistent Clusters in Data Partitions Ana Fred Instituto de Telecomunica¸co ˜es Instituto Superior T´ecnico, Lisbon, Portugal
[email protected]
Abstract. Given an arbitrary data set, to which no particular parametrical, statistical or geometrical structure can be assumed, different clustering algorithms will in general produce different data partitions. In fact, several partitions can also be obtained by using a single clustering algorithm due to dependencies on initialization or the selection of the value of some design parameter. This paper addresses the problem of finding consistent clusters in data partitions, proposing the analysis of the most common associations performed in a majority voting scheme. Combination of clustering results are performed by transforming data partitions into a co-association sample matrix, which maps coherent associations. This matrix is then used to extract the underlying consistent clusters. The proposed methodology is evaluated in the context of k-means clustering, a new clustering algorithm - voting-k-means, being presented. Examples, using both simulated and real data, show how this majority voting combination scheme simultaneously handles the problems of selecting the number of clusters, and dependency on initialization. Furthermore, resulting clusters are not constrained to be hyper-spherically shaped.
1
Introduction
Clustering algorithms are valuable tools in exploratory data analysis, data mining and pattern recognition. They provide a means to explore and ascertain structure within the data, by organizing it into groups or clusters. Many clustering algorithms exist in the literature [6, 8], from model-based [5, 13, 16], nonparametric density estimation based methods [15], central clustering [2] and square-error clustering [14], graph theoretical based [4, 18], to empirical and hybrid approaches. They all underly some concept about data organization and cluster characteristics. Best fit to some criteria, no single algorithm can adequately handle all sorts of cluster shapes and structures; when considering hybrid structure data sets, different and possibly inconsistent data partitions are produced by different clustering algorithms. In fact, many partitions can also be obtained by using a single clustering algorithm. This phenomena arises due, for instance, to dependency on initialization, such as the k-means algorithm, or by particular selection of some design parameter (such as the number of clusters, or the value of some threshold responsible for cluster separation). Model order selection is sometimes left as a design parameter; in other instances, the selection
of the optimal number of clusters is incorporated in the clustering procedure [1, 17], either using local or global cluster validity criteria. Theoretical and practical developments over the last decade have shown that combining classifiers is a valuable approach in supervised learning, in order to produce accurate recognition results. The idea of combining the decisions of clustering algorithms for obtaining better data partitions is thus worth investigating. In supervised learning, a diversity of techniques for combining classifiers has been developed [7, 9, 10]. Some make use of the same representation for patterns while others explore different feature sets, resulting from different processing and analysis or by simple split of the feature space for dimensionality reasons. A first aspect in combining classifiers is the production of an ensemble of classifiers. Methods for constructing ensembles include [3]: manipulation of the training samples, such as bootstrapping (Bagging), reweighing the data (boosting) or using random subspaces; manipulation of the labelling of data, an example of which is error-correcting output coding; injection of randomness into the learning algorithm - providing random initialization into a learning algorithm, for instance, a neural network; applying different classification techniques on the same training data set, for instance under a Bayesian framework. Another aspect concerns how the output of the individual classifiers are to be combined. Once again, various combination methods have been proposed [10, 11], adopting parallel, sequential or hybrid topologies. The simplest combination method is majority voting. The theoretical foundations and behavior of this technique have been studied [11, 12], proving its validity and providing useful guidelines for designing classifiers; furthermore, this basic combination rule requires no prior training, which makes it well suited for extrapolation to unsupervised classification tasks. In this paper we address the problem of finding consistent clusters within a set of data partitions. The rational of the approach is to weight associations between sample pairs by the number of times they co-occur in a cluster from the set of data partitions produced by independent runs of clustering algorithms, and propose this co-occurrence matrix as the support for consistent clusters development using a minimum spanning tree like algorithm. The validity of this majority voting scheme (section 2) is tested in the context of k-means based clustering, a new algorithm being presented (section 4). Evaluation of results on application examples (section 5) makes use of a consistency index between a reference data partition (taken as ideal) and the partitions produced by the methods; a procedure for determining matching clusters is hence described in section 3.
2
Majority Voting Combination of Clustering Algorithms
In exploratory data analysis, different clustering algorithms will in general produce different results, no general optimal procedure being available. Given a data set, and without any a priori information, how can one decide which clustering algorithm will perform better? Instead of choosing one particular method/algorithm, in this paper we put forward the idea of combining their
classification results: since each of them may have different strengths and weaknesses, it is expected that their joint contributions will have a compensatory effect. Having in mind a general framework, not conditioned by any particular clustering technique, a majority voting rule is adopted. The idea behind majority voting is that the judgment of a group is superior to those of individuals. This concept has been extensively explored in combining classifiers in order to produce accurate recognition results. In this section we extend this concept to the combination of data partitions produced by ensembles of clustering algorithms. The underlying assumption is that neighboring samples within a ”natural” cluster are very likely to be co-located in the same group by a clustering algorithm. By considering the partitions of the data produced by different clusterings, pairs of samples are voted for association in each independent run. The results of the clustering methods are thus mapped into an intermediate space: a co-association matrix, where each (i, j) cell represents the number of times the given sample pair has co-occurred in a cluster. Each co-occurrence is therefore a vote towards their gathering in a cluster. Dividing this matrix values by the number of clustering experiments gives a normalized voting. The underlying data partition is devised by majority voting, comparing normalized votes with the fixed threshold 0.5, and joining in the same cluster all the data linked in this way. Table 1 outlines the proposed methodology. Table 1. Devising consistent data partitions using a majority voting scheme. Input: N samples; E clustering ensembles of dimension R Output: Data partitioning. Initialization: Set the co-association matrix, co assoc, to a null N × N matrix. Steps: 1. Produce data partitions and update the co-association matrix: For i = 1 to R do 1.1. Run the ith clustering method in the ensemble E and produce a data partition P ; 1.2. Update the co-association matrix accordingly: For each sample pair, (i, j), in the same cluster in P set 1 co assoc(i, j) = co assoc(i, j) + R 2. Obtain the consistent clusters by thresholding on co assoc 2.1. Find majority voting associations: For each sample pair, (i, j), such that co assoc(i, j) > 0.5 join the samples in the same cluster; if the samples where in distinct previously formed clusters, join the clusters; 2.2. For each remaining sample not included in a cluster, form a single element cluster; 3. Return the clusters thus formed.
Without requiring prior training, this technique can easily cope with a diversity of scenarios: classifiers using the same representation for patterns or making use of different representations (such as different feature sets); combination of
classifications produced by a single method or architecture with different parameters or fusion of multiple types of classifiers. Section 4 integrates this methodology into a k-means based clustering technique. Evaluation of the results makes use of a partitions consistency index, described next.
3
Matching Clusters in Distinct Partitions
Let P1 , P2 be two data partitions. In what follows, it is assumed that the number of clusters in each partition is arbitrary and samples are enumerated and referenced using the same labels in every partition, si , i = 1, . . . , n. Each cluster has an equivalent binary valued vector representation, each position indicating the truth value of the proposition: sample i belongs to the cluster. The following notation is used: i ) Pi ≡ partition i : (nci , C1i . . . Cnc i nci ≡ number of clusters in partition i Cji = {sl : sl ∈ clusterj of partition i} ≡ list of samples in the jth cluster of partition i 1 if sk ∈ Cji Xji : Xji (k) = , k = 1, . . . , n 0 otherwise ≡ binary valued vector representation of cluster Cji
We define pc idx, the partitions consistency index, as the fraction of shared samples in matching clusters in two data partitions, over the total number of samples: min{nc1 ,nc2 } X 1 n sharedi pc idx = n i=1
where it is assumed that clusters occupy the same position in the ordered clusters lists of the partitions, and n sharedi is the number of samples shared for the ith clusters. The clusters matching algorithm is an iterative procedure that, in each step, determines the pair of clusters having the highest matching score, given by the fraction of shared samples. It can be described schematically: Input: Partitions P1 , P2 ; n, the total number of samples. 0 Output: P2 , partition P2 reordered according to the matching clusters in P1 ; pc idx, the partitions consistency index. Steps: 1. Convert clusters Cji into the binary valued vector description Xji : Cji → Xji , i = 1, 2 j = 1, . . . , nci 2. Set: P 2new indexes (i) = 0, i = 1, . . . nc2 (clusters new indexes) n shared = 0. 3. Do min {nc1 , nc2 } times:
– Determine the best matching pair of clusters, (k, l), between P1 and P2 according to the match coefficient: arg max
(k, l) = i, j
(
T
X 1 i Xj2 X 1 Ti Xi1 + X 2 Tj Xj2 − X 1 Ti Xj2
)
,
T
– n shared = n shared + X 1 i Xj2 . – Rename Cl2 as Ck2 : P 2new indexes (l) = k. – Remove Ck1 and Cl2 from P1 and P2 , respectively. 4. If nc1 ≥ nc2 go to step 5; otherwise fill in empty locations in P 2new indexes (clusters with no correspondence in P1 ) with arbitrary labels in the set {nc1 + 1, . . . , nc2 }. 5. Reorder P2 according to the new clusters labels in P 2new indexes and put in 0 P2 ; set pc idx = n shared n 0 6. Return P2 and pc idx.
4
K-Means Based Clustering
In this section we incorporate the previous methodology in the context of kmeans clustering. The resulting clustering algorithm is summarized in table 2, and will be hereafter referred to as voting-k-means. It basically proposes to generate clustering partitions ensembles by random initialization of the cluster centers and random pattern presentation. Table 2. Assessing the underlying number of clusters and structure based on a k-means voting scheme. Voting-K-Means algorithm. √ Input: N samples; k - initial number of clusters (by default: k = N ); R - number of iterations. Output: Data partitioning. Initialization: Set the co-association matrix to a null N × N matrix. Steps: 1. Do R times: 1.1. Ramdomly select k cluster centers among the N data samples. 1.2. Organize the N samples in random order, keeping track of the initial data indexes. 1.3. Run the k-means algorithm with the reordered data and cluster centers and update the co-association matrix according to the partition thus obtained over the initial data indexes 2. Detect the consistent clusters though the co-association matrix, using the technique defined previously.
4.1
Known Number of Clusters
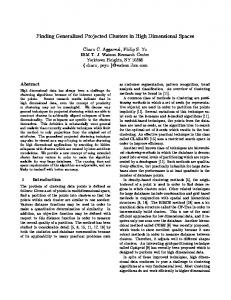
One of the difficulties with the k-means algorithm is the dependency of the partitions produced on the initialization. This is illustrated in figure 1 which represents two partitions produced by the k-means algorithm (corresponding to different cluster initializations) on a data set of 1000 samples drawn from a mixture of two Gaussian distributions with unit covariance and Mahalanobis distance between the means equal to 7. Inadequate data partitions, such as the one plotted in figure 1(a), can be obtained even when the correct number of clusters is known a priori. These misclassifications of patterns are however overcome by using a majority voting scheme, as outlined in table 2, setting k to the known number of clusters: taking the votes produced by several runs of the k-means algorithm, using randomized cluster center initializations and samples reordering, leads to the correct data partitioning depicted in figure 1(b). 12
12
10
10
8
8
6
6
4
4
2
2
0
0
−2
−2
−4 −5
0
5
(a) k-means, k=2.
−4 −5
0
5
(b) Voting-k-means
Fig. 1. Compensating the dependency of the k-means algorithm on cluster center initialization, k=2. (a)- Data partition obtained with a single run of the k-means algorithm. (b)- Result obtained using another cluster centers initialization and also with the proposed method with 10 iterations.
4.2
Unknown Number of Clusters
Most of the times, the true number of clusters is not known in advance and must be ascertained from the training data set. Based on the k-means algorithm, several heuristic and optimization techniques have both been proposed to select the number of underlying classes [1, 17]. Also, it is well known that the k-means algorithm, based on a minimum square error criterium, identifies hyper-spherical clusters, spread around prototype vectors representing cluster centers. Techniques for selecting the number of clusters according to this optimality criterium basically identify an ”optimal” number of cluster centers on the
data that splits it into the same number of hyper-spherical clusters. When the data exhibits clusters with arbitrary shape, this type of decomposition is not always satisfactory. In this section we propose to use a voting scheme associated with the k-means algorithm to address both issues: selection of the number of clusters; detecting arbitrary shaped clusters. The basic idea consists of the following: if a large number, k, of clusters is selected, by randomly choosing the initial clusters centers and order of pattern presentation, the k-means algorithm will split the training data into k subsets which reflect high density regions; if k is large in comparison to the number of true clusters, each intrinsic cluster will be split into arbitrary smaller clusters, neighboring patterns having a high probability of being co-located in the same cluster; by averaging over all associations of pattern pairs thus produced over R runs of the k-means algorithm, it is expected to obtain high rates of votes on these pairs of patterns, the true clusters structure being recovered by thresholding the co-association matrix, as proposed before. The method therefore proposed √ is to apply the algorithm described in table 2 by setting K to a large value, say N , N being the number of patterns in the training set. 14
14
14
12
12
12
10
10
10
8
8
8
6
6
6
4
4
4
2
2
2
0
0
0
−2
−2
−2
−4 −5
0
(a) K-means - iter. 1.
5
−4 −5
0
(b) Voting-K-means - iteration 4.
5
−4 −5
0
5
(c) Voting-K-means iteration 10.
Fig. 2. Partitions produced by the k-means (k=14) and the voting-k-means algorithms.
The method is illustrated in figure 2 concerning the clustering of 200 2dimensional patterns, randomly generated from a mixture of two Gaussian distributions: unit covariance; Mahalanobis distance between the means – 10. Figure 2(a) shows a data partition produced by the k-means algorithm (k=14); distinct initializations produce different data partitioning. Accounting for persistent pattern associations along the individual runs of the k-means algorithm,
the voting-k-means algorithm evolves to a stable partition of the data with two clusters (see figures 2(b) and (c)).
5
Application Examples
5.1
Simulated Data
The proposed method is tested in the classification of data forming two well separated clusters shaped as half rings. The total number of samples is 400, distributed evenly between the two clusters; the voting-k-means is run setting k to 20. 2.5
2.5
2
2
1.5
1.5
1
1
0.5
0.5
0
0
−0.5
−0.5
−1
−1
−1.5
−1.5
−2
−2
−2.5 −3
−2
−1
0
1
2
3
4
5
−2.5 −3
−2
−1
(a) K-means - k=2.
2
3
4
5
1 0.9 Partition Consistency Index
30
Number of Clusters
1
(b) Voting-K-means.
35
25 20 15 10 5 0 0
0
0.8 Voting k−means Simple k−means
0.7 0.6 0.5 0.4 0.3 0.2
5
10
15 Iteration
20
25
(c) Number of clusters.
30
0.1 0
5
10
15 Iteration
20
25
30
(d) Consistency index.
Fig. 3. Half ring data set. (a)-(b) Partitions produced by the k-means and the votingk-means algorithms. (c)-(d) Convergence of the voting-k-means algorithm.
Figure 3(a) plots a typical result with the standard k-means algorithm when using k = 2, showing its inability to handle this type of clusters. By taking the majority voting scheme, however, clusters are correctly identified (figure 3(b)). The convergence of the algorithm to the correct data partitioning is depicted in
figures 3(c) and 3(d), according to which a stable solution is obtained after 25 iterations. 5.2
Iris Data Set
The Iris data set consists of three types of Iris plants (Setosa, Versicolor and Virginica), with 50 instances per class, represented by 4 features. 11
1 Voting k−means Simple k−means
10 0.9 Partition Consistency Index
Number of Clusters
9 8 7 6 5 4
0.8
0.7
0.6
0.5
3 2 0
10
20
30
40 Iteration
50
60
70
80
0.4 0
10
20
30
40 Iteration
50
60
70
80
Fig. 4. Iris data set: convergence of the voting-k-means algorithm; k = 8.
As shown in figure 4, the proposed algorithm initially alternates between 2 and 3 clusters, with consistency indexes ranging from 0.67 (2 clusters – Setosa vs Versicolor + Virginica) and 0.75 (3 clusters). It stabilizes at the two clusters solution, which, although not corresponding to the known number of classes, constitutes a reasonable and intuitive solution as the Setosa class is well separated from the remaining classes, which are intermingled.
6
Conclusions
This paper proposed a general methodology for combining classification results produced by clustering algorithms. Taking an ensemble of clustering algorithms, their individual decisions/partitions are combined by a majority voting rule to derive a consistent data partition. We have shown how the integration of the proposed methodology in a kmeans like algorithm, denoted voting-k-means, can simultaneously handle the problem of initialization dependency and selection of the number of clusters. Furthermore, as illustrated in examples, with this algorithm cluster shapes other than hyper-spherical can be identified. While explored in this paper under the framework of k-means clustering, the proposed technique does not entail any specificity towards a particular clustering strategy. Ongoing work includes the adoption of the voting type clustering scheme with other clustering algorithms and the extrapolation of this methodology to the combination of multiple classes of clustering algorithms.
References 1. H. Bischof and A. Leonardis. Vector quantization and minimum description length. In Sameer Singh, editor, International Conference on Advances on Pattern Recognition, pages 355–364. Springer Verlag, 1999. 2. J. Buhmann and M. Held. Unsupervised learning without overfitting: Empirical risk approximation as an induction principle for reliable clustering. In Sameer Singh, editor, International Conference on Advances in Pattern Recognition, pages 167–176. Springer Verlag, 1999. 3. T. Dietterich. Ensemble methods in machine learning. In Kittler and Roli, editors, Multiple Classifier Systems, volume 1857 of Lecture Notes in Computer Science, pages 1–15. Springer, 2000. 4. Y. El-Sonbaty and M. A. Ismail. On-line hierarchical clustering. Pattern Recognition Letters, pages 1285–1291, 1998. ao. Clustering under a hypothesis of smooth dissimilarity 5. A. L. Fred and J. Leit˜ increments. In Proc. of the 15th Int’l Conference on Pattern Recognition, volume 2, pages 190–194, Barcelona, 2000. 6. A. K. Jain and R. C. Dubes. Algorithms for Clustering Data. Prentice Hall, 1988. 7. A.K. Jain, R. Duin, and J. Mao. Statistical pattern recognition: A review. IEEE Trans. Pattern Analysis and Machine Intelligence, 22:4–37, January 2000. 8. A.K. Jain, M. N. Murty, and P.J. Flynn. Data clustering: A review. ACM Computing Surveys, 31(3):264–323, September 1999. 9. J. Kittler. Pattern classification: Fusion of information. In S. Singh, editor, Int. Conf. on Advances in Pattern Recognition, pages 13–22, Plymouth, UK, November 1998. Springer. 10. J. Kittler, M. Hatef, R. P Duin, and J. Matas. On combining classifiers. IEEE Trans. Pattern Analysis and Machine Intelligence, 20(3):226–239, 1998. 11. L. Lam. Classifier combinations: Implementations and theoretical issues. In Kittler and Roli, editors, Multiple Classifier Systems, volume 1857 of Lecture Notes in Computer Science, pages 78–86. Springer, 2000. 12. L. Lam and C. Y. Suen. Application of majority voting to pattern recognition: an analysis of its behavior and performance. IEEE Trans. Systems, Man, and Cybernetics, 27(5):553–568, 1997. 13. G. McLachlan and K. Basford. Mixture Models: Inference and Application to Clustering. Marcel Dekker, New York, 1988. 14. B. Mirkin. Concept learning and feature selection based on square-error clustering. Machine Learning, 35:25–39, 1999. 15. E. J. Pauwels and G. Frederix. Fiding regions of interest for content-extraction. In Proc. of IS&T/SPIE Conference on Storage and Retrieval for Image and Video Databases VII, volume SPIE Vol. 3656, pages 501–510, San Jose, January 1999. 16. S. Roberts, D. Husmeier, I. Rezek, and W. Penny. Bayesian approaches to gaussian mixture modelling. IEEE Trans. Pattern Analysis and Machine Intelligence, 20(11), November 1998. 17. H. Tenmoto, M. Kudo, and M. Shimbo. Mdl-based selection of the number of components in mixture models for pattern recognition. In Adnan Amin, Dov Dori, Pavel Pudil, and Herbert Freeman, editors, Advances in Pattern Recognition, volume 1451 of Lecture Notes in Computer Science, pages 831–836. Springer Verlag, 1998. 18. C. Zahn. Graph-theoretical methods for detecting and describing gestalt structures. IEEE Trans. Computers, C-20(1):68–86, 1971.