4, Place du Général Leclerc 91401 Orsay Cedex, France. {thirion,poline,pinel}@shfj.cea.fr ..... S. C Strother, J. Anderson et al. The quantitative evaluation of ...
Finding Landmarks in the Functional Brain: Detection and Use for Group Characterization Bertrand Thirion1 , Philippe Pinel2 and Jean-Baptiste Poline1 1
Service Hospitalier Fr´ed´eric Joliot D´epartement de Recherche M´edicale - CEA - DSV 4, Place du G´en´eral Leclerc 91401 Orsay Cedex, France {thirion,poline,pinel}@shfj.cea.fr 2 Unit´e INSERM 562 ”Neuroimagerie Cognitive” Service Hospitalier Fr´ed´eric Joliot, CEA/DRM/DSV 4, Place du G´en´eral Leclerc, 91401 Orsay cedex, France
Abstract. FMRI group studies are usually based on stereotactic spatial normalization and present voxel by voxel average activity across subjects. This technique does not in general adequately model the inter subject spatial variability. In this work, we propose to identify functional landmarks that are reliable across subjects with subject specific Talairach coordinates that are similar -but not exactly identical- between subjects. We call these Brain Functional Landmarks (BFLs), and define them based on cross-validation techniques using 38 subjects. We explore a dataset acquired while subjects were involved in several cognitive and sensori-motor processes, and show that this representation allows to classify subjects into sub-groups on the basis of their BFL activity.
1
Introduction
Across subjects variability of both the anatomical and functional organization of the brain is often observed in brain imaging [13] but rarely studied in depth. The causes of the observed fMRI variability are numerous and often difficult to discriminate. Some of it may be due to anatomical variability [7], and some to variation in the organization of the functional topography of our cognitive processes; part of it depends on the (current) physiological state of the subject at the time of scanning, and part is due to acquisition noise. The first two causes may well reflect both genetic or epigenetic factors. This leads to strong variability both in the i) position and in the ii) activity level (contrast to noise ratio: CNR) of the hemodynamic signal measured in fMRI. This inter-subject variability strongly impacts the sensitivity of group studies [6, 8], and currently the solution most widely adopted resorts to i) stereotactic normalization followed by spatial smoothing (often 12-14 mm Gaussian FWHM), and ii) assuming that voxel intensity follows a Gaussian distribution [1]. Both the current spatial and intensity models are probably suboptimal. Global measures of the overall variability between subjects have been proposed and allow to address group homogeneity [11, 4], but more local analyzes
are needed to decompose the sources of variability. This combines with the need for sparser representation of brain activity that would open the way to techniques that are too computationally demanding in a dense (voxel based) representation of the functional activity. To some extent, thresholding activation maps turns a dense representation into a sparse one, but this operation is not robust to inter-session variations [8, 10] and does not model the spatial variability. The reduction of the volume-based information to a representation that retains the essential organization of the functional activity across subjects is crucial for many applications in the field of brain mapping, and the present paper is a step towards this goal. This reduction enforces the following constraints: – Some cognitive processes (possibly not all) give rise to stable topographic organization across subjects [9]. – A common topographic organization may, however, result in different spatial positions when functional images are normalized to a standard template. Mild spatial variability across subjects should thus be modelled. – Quantitatively, one can expect a relatively high inter-subject variability in the contrast magnitude or CNR. The relative activation magnitude (e.g. local maxima of the contrast maps) may thus better characterize the activation topography than across subject random effect tests. The aim of the present work is to detect adapted landmarks, which we henceforth call Brain Functional Landmarks (BFLs). We propose to base our detection on the reproducibility of the occurrence of activations across subjects for some given contrasts. This analysis yields a topographic representation of the functional brain, and quantitative measurements of the spatial and contrast/CNR variability across subjects. We further use those results to classify subjects into subgroups with similar BFL activities. The sequel of this paper is organized as follows. In section 2, we describe the dataset and the procedure that are used for the detection of BFLs. In section 3, we describe our results on the BFL detection and the use of BFLs to study the functional population variability. We discuss the technical aspects and implications of this work in section 4.
2
Materials and methods
Datasets and pre-processing. We used an event-related experimental Localizer paradigm that comprises ten conditions. Subjects underwent a series of stimuli or were engaged in tasks such as passive viewing of horizontal or vertical checkerboards, left click after audio or video instruction, right click after audio or video instruction, computation (subtraction) after video or audio instruction, sentence listening and reading. Events were occurring randomly in time (mean inter stimulus interval: 3s), with ten occurrences per event type (except motor button clicks for which there were only five trials). Thirty-eight right-handed subjects participated in the study. The subjects gave informed consent and the protocol was approved by the local ethics committee. Functional images were acquired on a 3T Bruker scanner using an EPI
sequence (TR = 2400ms, TE = 60ms, matrix size=64×64, FOV = 24cm×24cm). Each volume consisted of 34 4mm-thick axial slices without gap. A session comprised 130 scans. Anatomical T1 images were acquired on the same scanner, with a spatial resolution of 1 × 1 × 1.2 mm3 . fMRI data pre-processing consisted in 1) temporal Fourier interpolation to correct for between-slice timing, 2) motion estimation. For all subjects, motion estimates were smaller than 1mm and 1 degree, so that no correction was performed on the datasets; 3) anatomo-functional image coregistration and spatial normalization of the functional images. This pre-processing was performed using the SPM2 software (see www.fil.ucl.ac.uk, [1]). Statistical analysis of the dataset was also carried out with the SPM2 software, using standard high-pass filtering and AR(1) whitening. For further analysis, we used the effect magnitude (GLM parameters) and significance (P-values) for each subject and contrast of interest. Detection of BFLs. We define a Brain Functional Landmark (BFL) as a locus around which an activation can reliably be found across subjects. An overall description of the BFL detection procedure is given in Fig. 1. We proceed as follows: Given N datasets (subjects), we smooth the parameter map of (N − 1) subjects and derive the corresponding random effect (RFX) map. We retain the maxima M i , i = 1..I of the maps that are above a rather liberal statistical threshold (p1 < 10−3 , uncorrected). Then we find the nearest local maximum of the corresponding unsmoothed, thus bias free, statistical map in each subject. The positions τni , n = 1..N − 1, i = 1..I of these local P maxima define an area Ri . The region Ri is defined as a ball of center ci = N 1−1 n τni and q P radius ri = 3(N5−1) n kci − τni k2 . This is equivalent to assuming a compactly supported, locally uniform spatial distribution of (τ i ) across the population. Then we perform the following test on the remaining dataset: if there is an activated voxel in the region Ri with corrected probability p2 < 0.05, the locus ci is retained as a potential BFL . We used the Bonferroni correction for multiple comparisons for the number of voxels in Ri . This procedure is performed N times, one of the subjects being left out, and provides a collection of BFL candidates ci (n) (region i, subject n left out). This collection of BFL candidates is naturally redundant: if a candidate ci (l) is detected when subject l is left out, it -or a very close point cj (k)- may also be detected when subject k is left out. Thus we perform an average link agglomerative clustering of the candidates, with a stopping criterion δ = 5mm. The clusters of candidates are finally validated when they contain at least ν = N/2 candidates. This procedure reduces the risk of false positives to α < V (δ)p1 pν2 , where V (δ) is the volume (in voxels) of a ball of radius δ, making it negligible in practice. Milder thresholds on ν, e.g. ν = N/4, may be used when one is interested in finding landmarks on specific sub-groups of subjects. Therefore, ν, the number of candidates within a cluster, is a measure of the reproducibility of the BFL candidate. The BFLs are chosen on the basis of reproducibility and not contrast to noise ratio. Note that the algorithm adapts to the number of subjects N .
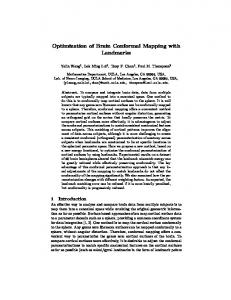
Fig. 1. Flowchart of our method for the extraction of Brain Functional Landmarks (BFLs). Of note, default choices for all the parameters can be easily set. This algorithm adapts to the number of subjects N ; for each BFL and each subject, it yields a signal value and a position that can be further processed.
Despite smoothing, the initial RFX test in the detection procedure may contain several local maxima close to one another (possibly because of misregistrations) which may yield confounding patterns. We avoid this by restricting our definition of local maxima to maxima within a rather large neighbourhood, (5 × 5 × 5) voxels or greater, of the RFX map. The information conveyed by BFLs. The definition of landmarks across a population provides a subject-specific representation of both the activation position foci and the magnitude of the effect. This allows an exploration of the activation pattern, and of the relative importance of the different regions across groups of subjects. While the contrast magnitude and statistical significance essentially classify subjects into groups activating weakly or strongly (data not shown), classification of the relative ranking (order statistics) of the different foci yields a more useful information. We use an agglomerative algorithm to check whether several subgroups can be defined in the population, and represent the average relative activation magnitude for each group.
3
Results
The BFLs found in the Localizer experiment. We applied BFL detection on the 38 subjects and the following contrasts: right click-left click; left-right click; audio
instructions-video instructions; video instructions-audio instructions; computationsentence reading/listening; sentences reading-low level visual stimulation. The threshold ν is set to ν = N/2. The BFL detection lasts about one minute per contrast with a C/Matlab code. The result is displayed in Fig. 2 on one subject grey-white matter interface, with respectively 2, 1, 9, 2, 6 and 3 BFLs for the above contrasts. This readily yields a topography of the functional brain.
(a)
(b)
(c)
Fig. 2. Representation of the functional BFLs found on the group of subjects, on the left and right grey-white matter interface of an individual brain. (a) View from the occipital side, (b) left hemisphere, (c) right hemisphere. The color codes for the contrast associated with each BFL: Yellow BFLs for the audio-video contrast, green for the opposite contrast, dark blue for the right-left click contrast, red for the opposite, pink for the computation-sentence understanding contrast and light blue for the readingpassive viewing contrast. Note that subject specific loci could be reported on their own anatomy.
Study of the relative activation magnitude in the population of subjects. Using the same experimental data, we chose to explore the computation-sentence reading contrast of interest. Lowering ν to N/4, we obtained 11 BFLs in the population for this contrast, located in the parietal and frontal cortices. For each subject, the BFLs are ranked according to their CNR, and a maximum link agglomerative clustering is applied to this rank data ; 3 clusters were found to be representative (data not shown). Fig 3(a) represents a 3D multidimensional scaling (MDS) plot of the rank data, and the three clusters formed by the algorithm. The size of the three subgroups are 14, 18 and 6 subjects respectively. The average network of activations in each subgroup is presented in Fig. 3(b-d). Although these results are still preliminary and require more validations, recent work on computation [5] indicate that different activation strengths in the parietal cortex imply a stronger (Fig. 3d) or weaker (Fig. 3b) involvement
(a)
(b)
(c)
(d)
Fig. 3. Classification of the subjects according to the magnitude of their activity in different foci for the computation- sentence reading contrast. (a) 3-D MDS plot of the population. The maximum link clustering algorithm indicates a 3 classes structure. (b)(c)(d): Representation of the activation networks on the 11 foci defined by the BFLs. The color codes for the relative magnitude of activation, from weak (brown) to strong (yellow-white). These foci are superimposed on a standard grey-white matter interface.
of visual-spatial attention in the subtraction task; the strong dissymmetry of the parietal activation (group Fig. 3c) may indicate a stronger involvement of language areas in the task. Altogether, these three groups might thus represent different subjects strategies when computing (or reading).
4
Discussion and conclusion
Dense versus sparse approaches in neuroimaging. So far, functional MR images have mainly been considered as unstructured fields of data from which information is extracted through statistical thresholding. Such a point of view is limited in the case of multi-subject studies, in which voxel-based inference treats different sources of variability as confounds and tries to reduce their impact by smoothing
(see [1]). We propose here an alternative solution to extract and quantify what is common and what is variable across subjects. Obviously, this cannot be performed on dense data fields, and one has to turn to sparse representations. This is fortunate, since neuroimaging inference is generally concerned with extracting specific networks of regions, and not with each and every voxel in the whole brain volume. Consequently, so long as brain anatomy should be better described by sulcogyral or cytoarchitectonic structures, our results show that the brain can be endowed with some landmarks which can be used for a better and adaptable definition of regions of interests. To our knowledge, this is the first landmarkbased approach in functional neuroimaging. Detection of the BFLs. We have designed a BFL detection procedure that is robust to slight displacements of a focus of activation across subjects. Our method consists in a leave-one-out procedure, where learning is performed on secondlevel (inter-subject) statistics and test on first-level (intra-subject) statistics. This double thresholding has two advantages: it enables a relatively mild threshold at each step, and adapts to small populations. Since it is specifically based on the maxima of the map, unlike dense approaches, this procedure is not too sensitive to a particular choice of a P-value. Although different approaches are possible, e.g. inter-subject clustering of the activated areas [12, 9], the present method has the advantage of being computationally efficient, robust to displacement and easily interpretable. Moreover, it is controlled by reproducibility criteria that are more reliable than cluster selection techniques. While the method still requires further validations, it showed promising results on our data. Use of BFL activity to characterize population subgroups. A tremendous advantage of sparse representations is that they allow an easy comparison of subjects activity: while distance between functional images provide very useful insight on the homogeneity of populations [11, 4], the use of BFLs simplifies the picture by concentrating on informative regions that are not arbitrarily selected. In particular, our example in Fig. 3, shows interpretable subgroup structures for a contrast of interest. This study would greatly benefit from a more systematic comparison of the activation magnitude and significance across subjects and experimental conditions, that would clarify region-based inference [3]. We emphasize that such comparisons are precisely allowed by BFLs, whereas direct image comparisons may be confounded by the spatial variability of activated regions. Conclusion and future work. The information carried out by fMRI activation images is seen in this work to have a topographic representation at least partially reproducible across subjects. This, together with functional localization studies [2, 9] has led us to the concept of Brain Functional Landmark (BFL). We have shown that the detection of these landmarks, based on a reproducibility criterion, is relatively easy, and allows for sparse and thus manipulable representation of the brain functional information. Moreover, we have shown that such a sparse
representation can be used to study, across individuals, the spatial topography of a cognitive network defined by computation minus sentence reading. It can be noticed that robust detection of BFLs is a step forward in the representation of the population in a common referential (normalization). Straightforward extensions of this work are i) the study of the warp implied by the spatial variability of BFLs across subjects ii) the comparison and the merge of BFLs with anatomical landmarks [7] and iii) the use of this information for spatial normalization and signal calibration. Acknowledgments We thank our colleagues S. Dehaene, A. Jobert, for their participation in this project for helpful discussions and ideas. This work was partly funded by the French ministry of research through concerted actions ’masse de donn´ees’, ’neurosciences int´egratives et computationnelles’ and ’connectivit´e’.
References 1. J. Ashburner, K.J. Friston, and W. Penny, editors. Human brain functions, 2nd Edition. Academic press, 2004. 2. K. Grill-Spector, N. Knouf, and N. Kanwisher. The fusiform face area subserves face perception, not generic within-category identification. Nat Neurosci, 7(5):555– 62, May 2004. 3. T. L Jernigan, A. C Gamst, C. Fennema-Notestine, and A. L Ostergaard. More ”mapping” in brain mapping: statistical comparison of effects. Hum Brain Mapp, 19(2):90–5, Jun 2003. 4. F. Kherif, J.-B. Poline, S. M´eriaux, H. Benali, G. Flandin, and M. Brett. Group analysis in functional neuroimaging: selecting subjects using similarity measures. Neuroimage, 20(4):2197–2208, January 2004. 5. C. Lemer, S. Dehaene, E. Spelke, and L. Cohen. Approximate quantities and exact number words: dissociable systems. Neuropsychologia, 41(14):1942–58, 2003. 6. M. Liou, H.-R. Su et al. Bridging functional MR images and scientific inference: Reproducibility maps. Journal of Cognitive Neuroscience, 15(7):935–945, 2003. 7. J.-F. Mangin, D. Rivi`ere, A. Cachia, E. Duchesnay, Y. Cointepas, D. PapadopoulosOrfanos, P. Scifo, T. Ochiai, F. Brunelle, and J. R´egis. A framework to study the cortical folding patterns. Neuroimage, 23:S129–S138, 2004. 8. K. Murphy and H. Garavan. An empirical investigation into the number of subjects required for an event-related fMRI study. Neuroimage, 22(2):879–85, 2004. 9. O. Simon, F. Kherif et al. Automatized clustering and functional geometry of human parietofrontal networks for language, space, and number. Neuroimage, 23(3):1192–1202, 11 2004. 10. S. M Smith, C. F Beckmann et al. Variability in fMRI: a re-examination of intersession differences. Hum Brain Mapp, 24(3):248–57, Mar 2005. 11. S. C Strother, J. Anderson et al. The quantitative evaluation of functional neuroimaging experiments: the NPAIRS data analysis framework. Neuroimage, 15(4):747–71, Apr 2002. 12. B. Thirion and O. Faugeras. Feature detection in fMRI data: The information bottleneck approach. In Proc. 6th MICCAI, pages 83–91, Montreal, Nov 2003. 13. X. Wei, S.-S. Yoo, C. C. Dickey, K. H Zou, C. R G Guttmann, and L. P. Panych. Functional MRI of auditory verbal working memory: long-term reproducibility analysis. Neuroimage, 21(3):1000–8, 2004.