. Abstract. For more than one decade, time
series similarity search has been given a great deal of attention by data mining ...
Finding Structural Similarity in Time Series Data Using Bag-of-Patterns Representation Jessica Lin and Yuan Li Computer Science Department George Mason University
[email protected],
[email protected]
Abstract. For more than one decade, time series similarity search has been given a great deal of attention by data mining researchers. As a result, many time series representations and distance measures have been proposed. However, most existing work on time series similarity search focuses on finding shape-based similarity. While some of the existing approaches work well for short time series data, they typically fail to produce satisfactory results when the sequence is long. For long sequences, it is more appropriate to consider the similarity based on the higher-level structures. In this work, we present a histogram-based representation for time series data, similar to the “bag of words” approach that is widely accepted by the text mining and information retrieval communities. We show that our approach outperforms the existing methods in clustering, classification, and anomaly detection on several real datasets. Keywords: Data mining, Time series, Similarity Search.
1 Introduction Time series similarity search has been a major research topic for time series data mining for more than one decade. As a result, many time series representations and distance measures have been proposed [3, 6, 12, 15, 17, 19]. There are two kinds of similarities: shape-based similarity and structure-based similarity [13]. The former determines the similarity of two datasets by comparing their local patterns, whereas the latter determines the similarity by comparing their global structures. Most existing approaches focus on finding shape-based similarity. While some of these approaches work well for short time series data, they typically fail to produce satisfactory results when the sequence is long. To understand the need for a higher-level, structure-based similarity measure for long time series data, consider the scenario for textual data. If we are to compare two strings, we can use the string edit distance to compute their similarity. However, if we want to compare two documents, we typically do not compare them on the word-to-word basis. Instead, it is more meaningful to use a higherlevel representation that can capture the structure or semantic of the document. Below, we describe the two types of similarities in more detail [13]. Given two sequences A and B, shape-based similarity determines how similar these two datasets are based on local comparisons. The most well-known distance measure in data mining literature is the Euclidean distance, for which sequences are M. Winslett (Ed.): SSDBM 2009, LNCS 5566, pp. 461–477, 2009. © Springer-Verlag Berlin Heidelberg 2009
462
J. Lin and Y. Li
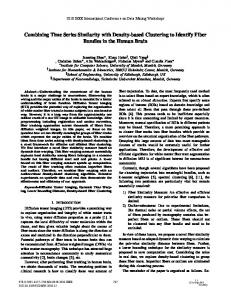
aligned in the point-to-point fashion, i.e. the ith point in sequence A is matched with the ith point in sequence B. While Euclidean distance works well in general, it does not always produce accurate results when data is shifted, even slightly, along the time axis. For example, the top and bottom sequences in Figure 1 appear to have similar shapes. In fact, the sequence below is the shifted version of the sequence above. However, the slight shifts along the time axis will result in a large distance between the two sequences. Another distance measure, Dynamic Time Warping (DTW) [12, 24], overcomes this limitation by using dynamic programming technique to determine the best alignment that will produce the optimal distance. The parameter, warping length, determines how much warping is allowed to find the best alignment. A large warping window causes the search to become prohibitively expensive, as well as possibly allowing meaningless matching between points that are far apart. On the other hand, a small window might prevent us from finding the best solution. Euclidean distance can be seen as a special case of DTW, where there is no warping allowed. Figure 1 demonstrates the difference between the two distance measures. Note that with Euclidean distance, the dips and peaks in the sequences are mis-aligned and therefore not matched, whereas with DTW, the dips and peaks are aligned with their corresponding points from the other sequence. While DTW is a more robust distance measure than Euclidean distance, it is also a lot more computationally intensive. Keogh [12] proposed an indexing scheme for DTW that allows faster retrieval. Nevertheless, DTW is still at least several orders slower than Euclidean distance.
Fig. 1. (Left) Alignment for Euclidean distance between two sequence data. (Right) Alignment for Dynamic Time Warping distance between two sequence data.
Shape-based similarities work well for short time series or subsequences; however, for long sequence data, they produce poor results. To illustrate this, we extracted subsequences of length 682 from six different records on PhysioNet [10], an online medical archive containing digital recordings of physiological signals. The first three datasets (numbered #1 ~ #3) are measurements on respiratory rates, and the last three datasets (#4 ~ #6) are electrocardiograms (ECGs). As we can clearly see in Figure 2, these two types of vital signs have very different structures. Visually we can separate the two classes with no difficulty. However, if we cluster them using Euclidean distance as the distance measure, the result is disappointing. Figure 2 shows the hierarchical clustering result using Euclidean distance. The dendrogram illustrates that while datasets #5 and #6 are correctly clustered (i.e. they share a common parent node), the rest are not.
Finding Structural Similarity in Time Series Data
463
Fig. 2. Result of hierarchical clustering using Euclidean distance on raw data. In fact, using DTW produces the same result.
One reason for the poor clustering result could be that the datasets within the same cluster are not perfectly aligned. In addition, the presence of anomalous points, as shown in the beginning of dataset #4, could also throw off the distances computed. DTW can be used to mitigate the first issue to a certain extent. However, in this example, DTW does not seem to offer any improvement; clustering using DTW produces a similar dendrogram as the one shown in Figure 2. Furthermore, the high computational cost for dynamic time warping makes it a less desirable choice of distance measure for large datasets. A more appropriate alternative to determine similarity between long sequences is to measure their similarity based on higher-level structures. Several structure- or model-based similarities have been proposed that extract global features such as trend, autocorrelation, skewness, and model parameters from data [23, 26]. However, it is not trivial how to determine relevant features, and/or compute distances given these features [13]. In addition, often these global features are not sufficient enough to capture the information needed in order to distinguish between the data. In this paper, we focus on finding structural similarities between time series data. Our method is robust and efficient, and it is inspired by the well-known bag-of-words representation for text data. There are several advantages for our approach compared to existing structure-based method. First, since the overall representation is built from extracting the subsequences from data, we in fact take local structures into consideration as well as global structures. Furthermore, the incremental construction of the representation suggests that it can be used in the streaming data scenario. Our representation also allows users to understand the pattern distribution of the data by examining the resulting histograms. We show that our approach outperforms existing methods in the tasks of classification, clustering, and anomaly detection on real datasets. The rest of the paper is organized as follows. In Section 2 we briefly discuss background and related work. Section 3 presents our methodology. In Section 4, we show empirical results in clustering, classification, and anomaly detection. We conclude and discuss future work in Section 5.
464
J. Lin and Y. Li
2 Background and Related Work In this section, we briefly discuss background and related work on time series similarity search. For concreteness, we begin with a definition of time series: Definition 1. Time Series: A time series T = t1,…,tp is an ordered set of p real-valued variables. Some distance measure Dist(A,B) needs to be defined in order to determine the similarity between time series objects A and B. Definition 2. Distance: Dist is a function that has A and B as inputs and returns a nonnegative value R, which is said to be the distance from A to B. Each time series is normalized to have a mean of zero and a standard deviation of one before calling the distance function, since it is well understood that in virtually all settings, it is meaningless to compare time series with different offsets and amplitudes [15]. As mentioned, Euclidean distance and Dynamic Time Warping are among the most commonly used distance measures for time series. For this reason, we will use Euclidean distance for our new representation, and compare the results with using Euclidean distance and Dynamic Time Warping on raw data. In addition to comparing with well-known distance measures on the raw data, we also demonstrate that our method outperforms existing time series representations such as Discrete Fourier Transform (DFT) [1]. DFT approximates the signal with a linear combination of basis functions, and its coefficients represent global contribution of the signal. Another well-known representation is Discrete Wavelet Transform (DWT) [3]. Wavelets are mathematical functions that represent data or other functions in terms of the averages and differences of a prototype function, called the analyzing or mother wavelet. Contrary to DFT, wavelets are localized in time. Nevertheless, past studies have shown that DFT and DWT have similar performance in terms of accuracy [15]. While there have been dozens of representations and distance measures proposed for time series shape-based similarity, there is relatively little work on finding structure-based similarity. Deng et al [4] proposed learning ARMA model on the time series, and using the model coefficients as the feature. This approach has an obvious limitation on the characteristics of input data. Ge and Smyth [8] proposed a deformable Markov Model template for temporal pattern matching, in which the data is converted to a piecewise linear model. However, this approach requires many parameters. Nanopoulos et al [23] proposed extracting statistical features of time series such as skewness, mean, variance, and kurtosis, and classifying the data using multi-layer perceptron (MLP) neural network. Recently, Keogh et al. [16] proposed a compression-based distance measure that compares the co-compressibility between datasets. Motivated by Kolmogorov Complexity [16, 19] and promising results shown in similar work in bioinformatics and computational theory, the authors devised a new dissimilarity measure called CDM (Compression-based Dissimilarity Measure). Given two datasets (strings) x and y, their compression-based dissimilarity measure can be formulated as follows:
Finding Structural Similarity in Time Series Data
CDM(x, y) =
465
C(xy) C(x) + C(y)
where C(xy) is the compressed size of the concatenated string x+y, C(x) and C(y) are the compressed sizes of the string x and y, respectively. In their paper, the authors show superior results compared to other existing structural similarity approaches. For this reason, we will compare our method with CDM, the best structure-based (dis)similarity measure reported. We will show that our approach is highly competitive, with several additional advantages over existing methods.
3 Finding Structural Similarity We propose a histogram-based similarity measure, using a representation similar to the one widely used for text data. In the Vector Space Model [25], each document can be represented as a vector in the vector space. Each dimension of the vector corresponds to one word in the vocabulary, and the value of each component is the (relative) frequency of occurrences for the corresponding word in the document. As a result, an p-by-q term-to-document matrix X is constructed, where p is the number of unique terms in the text collection, q is the number of documents, and each element X(i,j) is the frequency of the ith word occurring in the jth document. This “bag of words” representation works well for documents. It is able to capture the structure or topic of a document, without knowing the exact locations or orderings of the word appearances. This suggests that we might be able to represent time series data in a similar fashion, i.e. as a combination of patterns from a finite set of patterns. There are two challenges if we wish to represent time series data as a “bag of patterns.” The first challenge concerns with the definition and construction of the patterns “vocabulary.” The second challenge comes from the fact that time series data are composed of consecutive data points. There is no clear “delimiters” between patterns. Fortunately, a symbolic representation for time series called SAX (Symbolic Aggregate approXimation) [20], previously developed by the current author and now a widely used discretization method, provides solutions to these challenges. The intuition is to convert the time series into a set of SAX words, and then construct a word-sequence matrix (analogous to the term-document matrix for text data) using these SAX words. In the next section, we briefly discuss how SAX converts time series data into strings. 3.1 Symbolic Aggregate Approximation Given a time series of length n, SAX produces a lower dimensional representation of a time series by transforming the original data into symbolic words. Two parameters are used to specify the size of the alphabet to use (i.e. α) and the size of the words to produce (i.e. w). The algorithm begins by using a normalized version of the data and creating a Piecewise Aggregate Approximation (PAA). PAA reduces the dimensionality of a time series by transforming the original representation into a user defined number (i.e. w, typically w