single iPod can hold as many as 10,000 songs. Such collections are typically indexed and ..... and the French horn on G4. ... rhumbaâ), and lyrics (âhe says 'I love.
[exploratory DSP]
Bryan Pardo
Finding Structure in Audio for Music Information Retrieval
M
usic collections comprise one of the most popular categories of multimedia content, and the collections to be searched are huge. Napster’s collection contains about 1.5 million songs. A single iPod can hold as many as 10,000 songs. Such collections are typically indexed and searched by title, composer, and performer. While this allows for basic storage and retrieval of music documents, people often wish to access and use their music collections in ways that require access to the musically salient features in the audio recording. Features of interest may include melody, harmony, rhythm, and instrumentation. Access to these features, in turn, supports a user’s request such as: ■ Tell me the name of the song that goes (query by example). ■ Could you raise the volume of the flute solo on this recording? (source separation). ■ (while listening to a recording) Skip to the part where they sing the next verse (musical structure identification). ■ Who is singing the melody on this recording? (singer/instrument identification). ■ Find me a recording I can dance a slow rumba to (genre identification). To extend the range of ways in which a music collection can be accessed, DSP researchers must create systems that can find perceptually relevant musical structure in the audio signal. The area is “exploratory” for DSP researchers because successful music information retrieval requires advances in areas such as source separation, source identification, and mapping of human perception
of audio signals to machine-quantifiable measures, such as spectral tilt or cepstral coefficients. Researchers do not necessarily agree on a set of standard approaches to attacking these problems. Those developing new ways to access and parse music recordings are typically interested in either the nature of the sound sources and systems or in the abstract musical structures encoded in the signal. Problems in the first category include instrument identification and source separation from an acoustic mixture. In this case, the task is a special case of a more general problem, where purchase may be gained by applying musical constraints. For example, the task of separating an individual voice from a performance of Baroque music can be simplified using knowledge of musical voice leading rules, as this enables prediction of likely pitches for each voice. Examples of the second area include meter identification and genre identification [1]. In this case, the main task is fundamentally musical in nature. These tasks may be greatly aided by advances in the more general problem areas of source separation and source identification. While there are a number of fascinating problems in music information retrieval, this article will focus on a few systems designed to attack two problems in particular: query by example and source separation. The next section describes the challenges inherent in musical query by example and describes systems that take very different approaches to the problem. The penultimate section explores approaches to source separation in a musical context, again focusing on systems that take distinct approaches to the problem. The article then concludes with remarks about
IEEE SIGNAL PROCESSING MAGAZINE [126] MAY 2006
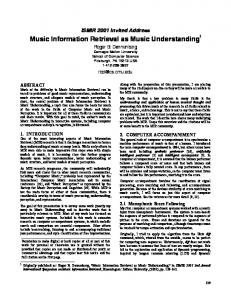
future directions for DSP research in the context of music information retrieval. QUERY BY EXAMPLE Most currently deployed music search engines, such as Amazon.com and local libraries, make use of metadata about the song title and performer name in their indexing mechanism. Often, a person wishing to find a recording is able to sing a portion of the piece but cannot specify the title, composer, or performer. Sometimes, the user may have access to an example recording, such as when one wishes wish to know the name of a song in an incorrectly titled MP3 file. Commercial music copyright holders, such as BMI, wish to automatically identify compositions used in commercial music performances so the appropriate royalties may be paid. In each of these cases, the user is able to provide an example of the recording. The example may be an alternate version of an entry in the database, such as a recording of a cover tune or a user-sung melody, or it may be a (possibly degraded) portion of the desired recording itself. The queryby-example task (illustrated in Figure 1) is to find the desired recording from the provided example. Solving this problem can be difficult and often requires the system to automatically extract musical structures from the audio signal. Consider the case of recognizing a new performance of “Happy Birthday.” There are thousands of unique recordings of “Happy Birthday.” Over this set of recordings, the nature of the sound sources varies from human voices to musical instruments to samples of dogs barking. Tempi vary from recording to recording, as do the key and the arrangement. In the case of this song, the feature that remains
1053-5888/06/$20.00©2006IEEE
relatively invariant between performances is the abstract sequence of frequency and durational relationships called the melody (lyrics are typically missing in instrumental versions). The melody is one of the prime musically and perceptually salient abstractions in an audio recording of a song. Other salient features include the harmony, rhythm and meter, instrumentation (sound sources), and higher-level structures built from these features, such as genre and song structure. Successful abstraction of high-level musical features, such as song structure [2], from audio remains an area of active research, and query by example based on such features is thus an area for future research. Current work in musical query by example has focused primarily on use cases where melodic examples (query by humming) or low-level acoustic features (audio fingerprinting) can be effectively used. The following subsections will describe systems that use audio fingerprinting and melodic querying to perform query by example. AUDIO FINGERPRINTING If the query example is a portion of the desired recording, an audio-fingerprintbased approach can be used. An audio fingerprint is a compact set of features derived from the signal that uniquely identifies the signal. Ideally, the fingerprint should be robust in the face of
whatever transformations the signal is expected to undergo. A typical use case is the situation where a person with a cellular phone hears a recording that he or she wishes to identify. The user calls a telephone number, holds the phone up to the radio, and waits for a reported match. To work, the system must be able to find the desired recording from an example recorded in a noisy environment using lossy cellular phone encoding. Thus, the fingerprints must be robust in the face of the resulting noise and distortion. Recently, several systems that use audio fingerprinting to let a user identify a song playing on the radio have been commercially deployed. Two of the best examples of this approach are Musiwave [3] and Shazam [4]. The Musiwave music identification service is available on the Spanish mobile carrier Amena and uses the Philips fingerprinting method [3]. This method breaks the signal into a sequence of roughly 12-ms windows. Each window is split into 33 nonoverlapping, logarithmically spaced frequency bins in the range from 300–2,000 Hz. Bins are spaced logarithmically in frequency because much work has shown that critical bands in human hearing are roughly evenly spaced in the log of frequency [5]. Each time window is represented by a 32-b value containing the sign of the energy difference between adjacent bands and windows. This value is called a
subfingerprint. A fingerprint consists of the entire sequence of subfingerprints found for the signal. The similarity measure between two recordings is then the bit difference between their fingerprints. This is calculated as follows: each subfingerprint in the query is used as a search key in the database. For each song in the database with a subfingerprint that differs from the query frame by no more than d bits, the bitwise distance is calculated between a sequence of 256 subfingerprints starting at the nth subfingerprint in the query and the sequence of 256 subfingerprints starting at the frame of the matching subfingerprint in the database recording. This is done for all database elements and the element with the closest fingerprint is deemed the best answer. Shazam [4] is a deployed commercial system available in the United Kingdom that uses audio fingerprinting to let a cellular phone user identify a song playing on the radio. Shazam’s fingerprints are based on spectrogram peaks. Peaks are defined as time-frequency points with higher energy content than their local neighbors. These peaks are found for the entire length of a recording, reducing it to a sparse set of peak coordinates called a constellation. From the constellations, fingerprint keys are formed; for each constellation, anchor points are chosen. Each anchor point is sequentially paired with points in a target neighborhood.
Query Example Parameter Estimation Database Feature Extraction
Abstract Target Features Recordings Stereo Input
Abstract Features
Delay
Similarity Ranker
Ranked List
Speech
(a)
[FIG1] Two problems of interest: (a) query by example and (b) source separation.
IEEE SIGNAL PROCESSING MAGAZINE [127] MAY 2006
Guitar (b)
on
ati nu
e Att
Violin
[exploratory DSP]
continued
Each pair is encoded as a time difference and a pair of frequencies. These values tend to remain constant between the original signal and the distorted query signal. The fingerprint of the query is compared to the fingerprint for each database element. When the target recording is compared to the query, the number of matching anchor point pairs is significantly larger than when another recording in the database is compared to the query. This holds true in the presence of spurious time-frequency peaks injected due to noise and also when some points are missing from the query fingerprint. The authors demonstrated the robustness of the Shazam approach by making 250 mixtures of music and noise, subjecting them to GSM 6.10 compression, reconverting the mixtures to monophonic 16-b, 8,000-Hz PCM audio, and using them as queries to a test database of 10,000 pieces of popular music. In this case, a 50% correct recognition rate for a 10-s query was achieved at a signal-to-noise ratio (SNR) of 0 dB and well over 90% correct was achieved when the SNR exceeded 6 dB [4]. While fingerprint-based systems can be robust in the face of the transformations imposed by cell phones, they are extremely sensitive to the use of alternate versions of a song as the search key. Two different recordings of Mozart’s K172 Quartet in B flat for Strings performed by the same string quartet do not have similar fingerprints, since their audio peaks and the spacing between them will vary significantly. Querying with one version will not return the other. Alternate song versions may require matching based on musically salient features of the recording, such as the melody. QUERY BY HUMMING: VOCAL SEARCH In the field of music information retrieval, melodic query by example has typically been cast as query by humming. Query-by-humming systems automatically transcribe a sung or hummed query into an abstract, musically salient representation and search for related
themes in a database, returning the most similar themes as a play list. Query by humming has been investigated by several research groups in recent years. The dominant matching techniques investigated for query by humming have been n-grams [6], dynamic-programming-based string matching [7], and hidden Markov models (HMMs) [7]. Compared to the original recording, a sung query may be in a different key, at a different tempo, and contain altered, inserted, or deleted notes. In spite of this, such queries are recognizable to a human familiar with the desired song as long as they preserve the pitch contour (sequence of frequency relationships) and rhythmic ratios of the original. These are the musically salient features useful for melody recognition. VocalSearch is a modern query-byhumming system that automatically transcribes a sung or hummed query into an abstract, musically salient representation and searches for related themes in a database, returning the most similar themes as a play list. The system encodes each query and database entry as a melodic sequence of note transitions, rather than absolute pitches and durations. This representation guarantees tempo (speed) and transposition (change of key) invariance in the representation of the melody, allowing a user to sing a song in a different key and tempo and still return a correct match. Each note transition encodes the change of pitch and duration ratios between adjacent melody notes, quantized to an alphabet of 25 pitch intervals (every interval from a descending octave to an ascending octave) and five rhythm ratios (much shorter, shorter, about equal, longer, and much longer). Figure 2(a) shows a transcription of a sung query to interval encoding. Here, circles indicate fundamental frequency estimates returned by an enhanced autocorrelation algorithm [7]. Vertical lines indicate note onsets estimated from frequency excursion and amplitude changes. Horizontal bars indicate estimated notes, quantized to the nearest pitch on an equal tempered piano tuned to A4 = 440 Hz. The letter-number pairs
IEEE SIGNAL PROCESSING MAGAZINE [128] MAY 2006
across the top of Figure 2(a) show quantized note transitions. Here, numbers indicate the direction and distance in musical half-steps between quantized note pairs. Letters indicate durational ratios, where S = much shorter, s = shorter, e = roughly equal, l = longer, and L = much longer. Durations are calculated based on the time from the onset of note n to the onset of note n + 1. This is the inter onset interval (IOI). The durational ratio bins used by VocalSearch are evenly spaced in the log of the IOI ratios between notes, as research in music perception [8] indicates IOI ratios fall naturally into evenly spaced bins in the log domain. Singers are prone to predictable systematic error, such as an inability to reproduce rhythm accurately or singing flat. Such errors can be handled gracefully if an error probability distribution is maintained. To learn this distribution, a melody is played to the user. The user sings the melody back to the system and the sung melody is transcribed by the system. The transcribed melody is compared to the original and the difference between the two is recorded. Repeating this process builds a probabilistic model of the combined error of the singer and transcription system. Figure 2(b) shows the error model for a single singer’s transcribed pitch reproduction as a confusion matrix. The horizontal axis represents the stimulus pitch-interval presented to the singer. The vertical axis represents the response generated by the combination of singer and pitch tracker. Each square represents the frequency with which a particular stimulusresponse pair was observed. The darker the square, the more frequent the occurrence. Response intervals that are greater than 12 are binned to 12. Those less than −12 are binned to −12. Given a database of melodies encoded as note transitions, the best match to the query is found using the same probabilistic string-matching methods commonly used in the bioinformatics community to align gene sequences. The probability measure used by VocalSearch is the error model resulting from system training. The singer error model is used to find
matching melodic material but with extra repetitions or out-of-order phrases. An example of this is where the subject alternates between a melody and bass line or when two phrases are sung in succession that do not occur in succession in the original piece. Another study [10] compared human recognition with machine recognition of sung queries on a database of roughly 250 pop songs. The human listeners achieved an average recognition rate of 66% when presented with queries sung by another person. The best machine system tested (VocalSearch) achieved a recognition rate of 50%. While there are many possible explanations, the human recognition rate was lower than expected and may provide a rough estimate of how well one can expect a machine system to perform. A sung query is typically a relatively low-noise recording of a single singer. As a result, extraction of the melody from the audio is automated and unsupervised. Database target themes, however, are typically not extracted directly from the audio in an automatic, unsupervised way. This is because most music recordings contain multiple instruments or voices playing concurrent melodic lines, making standard pitch tracking methods unreliable. This problem is typically avoided through the use of database
the most probable sequence transformation from the query to each database element. The sequence with the most likely transformation into the query is deemed the correct target. The performance of VocalSearch was tested [9] on a database of 8,926 musical themes by querying the database with a set of 165 sung melodies recorded by a number of volunteers upon which the system was not trained (the system used a synthetic error model). VocalSearch found the correct answer most similar to the query 21% of the time. The correct answer was in the top three choices 32% of the time. This performance is in line with that found for trained HMMbased recognition on the same query set [9], and the string-alignment version of the system was roughly 100 times faster. While this performance is not as strong as that reported for the audiofingerprint-based Shazam, the queries used are significantly less similar to the targets than those used for audio fingerprinting. An examination of the queries used for the study showed that only about half were deemed by human listeners to be largely in correspondence with the melodies stored in the database. Roughly 20% of queries contained a partial melodic match. Roughly 25% contained
Interval Encoding 1L
2s0e0e01 5e 0e−21 −11
−3s
12
G#3
208 Hz
9
F#3
185 Hz
E3
165 Hz
D3
147 Hz
C3
131 Hz
A#2
117 Hz 2
3
4
5 (s)
6
7
8
Response Pitch Interval
234 Hz
1
MUSICAL SOURCE SEPARATION The ability to reliably separate audio mixtures into source signals is of great use in finding and manipulating relevant musical structures in audio signals. Example tasks facilitated by this include automated transcription, vocalist and instrument identification, suppression or amplification of an instrument within a
Ascending Major 6th
Frequency
Pitch
A#3
2s
themes encoded in musical instrument digital interface (MIDI) format. A MIDI file does not include actual sounds. Rather, it contains instructions detailing which notes to play, their order, and the duration and volume of each note. In other words, MIDI files contain the abstract melodic representations required for database targets. Such files are available for tens of thousands of pieces of music, and the number is growing thanks to the increasing popularity of MIDI-based ring tones for cellular phones. That said, there are millions of recordings that do not have MIDI representations, and large-scale databases that are searchable by sung melodies may require the ability to perform unsupervised automatic melody extraction from multisource mixtures. This in turn requires the achievement of a longstanding goal of many audio researchers: automated source separation.
9
6 3 0 −3 −6 −9 −12
12
(a)
6 3 0 −3 −6 −9 Stimulus Pitch Interval In 1/2 Steps (12 to an Octave)
9
(b)
[FIG2] (a) Transcription to interval encoding and (b) data-derived pitch error model.
IEEE SIGNAL PROCESSING MAGAZINE [129] MAY 2006
−12
continued
Oboe
mixture, and melodic comparison of different recordings. Since much music has been recorded in stereo, one obvious approach to source identification and separation is to use localization information resulting from differences between the signals in the two channels. These differences can be used to find time-frequency frames in the audio mixture whose energy is primarily from a single common source. Source separation based on attenuation and delay differences between stereo channels is a kind of blind source separation, since no assumptions are made about the composition of the source signals. Instead, an assumption is made that sources rarely overlap in both time and frequency. If (as in anechoic speech mixtures) most timefrequency frames in a recording are approximately single-source, a time-frequency masking technique such as the DUET method can be successfully applied to separate sources [11]. Tonal music, such as jazz, rock, pop, and classical music, makes extensive use of consonant intervals between pairs of harmonic sound sources. When two harmonic sources form a consonant interval, their fundamental frequencies are related by a rational ratio that results in significant overlap between the highenergy frequency bands of one source and those of another. Thus, source reconstructions based on binary time-
frequency masking are often incomplete or inaccurate and new algorithms must be developed that are tailored to the unique problems that arise when dealing with musical signals. SOURCE SEPARATION WITH ACTIVE SOURCE ESTIMATION Source separation and reconstruction using the energy from multisource timefrequency frames, as well as singlesource frames, was explored in the active source estimation (ASE) system [12]. This system assigns energy to source estimates, building on partial signal estimates provided by existing timefrequency masking methods. The partial signal estimates are used to create a harmonic model for each source. The model is then used to predict its energy at each time-frequency frame. These predictions help assign energy from the mixed signal to sources for time-frequency frames with energy from multiple sources. This allows the system to deal with mixtures that contain time-frequency frames in which multiple harmonic sources are active, without prior knowledge of source characteristics. To illustrate this, we compared source separation using ASE to separation using DUET [11], a time-frequency masking method that works well on speech mixtures. The corpus to separate was a set of test mixtures created from individually
ASE: Mean Correlation Error over All Three Instruments 2 12 11 10 1.5 9 8 7 6 1 5 4 3 .5 2 1 0 0 1 2 3 4 5 6 7 8 9 10 11 12 French Horn
Oboe
[exploratory DSP]
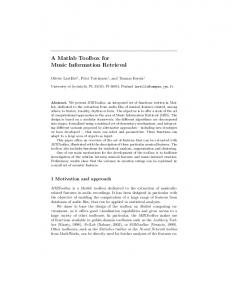
recorded long tones played on French horn, saxophone, and oboe. Each mixture simulates a stereo microphone recording of three simultaneous instrumental sounds played in an anechoic environment. There are 13 pitches in the chromatic scale from C4 (262 Hz) to C5 (524 Hz). To create the corpus of mixtures, the pitch of the saxophone was fixed at C4, while the pitches of the other two instruments were varied by halfsteps through all pitches in the chromatic scale from C4 to C5, resulting in 169 mixtures of the three instrument tones. Each mixture was separated into three signals by DUET and ASE algorithms. The error in each extracted signal was calculated by dividing the inner product between the original source signal and the estimated signal by the inner product of the source with itself. This measure is � �� � � �ˆsg, sg� �� Eg = ��20 log . �sg�2 �
(1)
To provide a single score for each mixture, we calculated Eg for each of the three source estimates, taking the mean error over the three estimates. In informal perceptual tests, we found error scores below 0.25 indicate very good reconstruction with few or no noticeable artifacts. An error of 0.5 indicates noticeable reconstruction error. Scores above
DUET: Mean Correlation Error over All Three Instruments 2 12 11 10 1.5 9 8 7 6 1 5 4 3 .5 2 1 0 0 1 2 3 4 5 6 7 8 9 10 11 12 French Horn
(a)
(b)
[FIG3] (a) Mean time-domain correlation error between ASE source estimates and true source signals. (b) Mean time-domain correlation error between DUET source estimates and true source signals.
IEEE SIGNAL PROCESSING MAGAZINE [130] MAY 2006
1.0 have significant problems, such as a large number of missing or incorrect harmonics for a portion of the reconstructed signal. Errors above 2.0 indicate failure to separate the signal into sources that are recognizable to a typical listener. Figure 3 shows source estimation error generated by ASE and DUET for the 169 mixtures. Here, the darker the square, the greater the difference between the original sources and the estimates extracted from the mixture. The vertical bar to the right of the main figure gives a key to the meaning of each value of grey in the main figure. Here, values are expressed in the error units from (1). The vertical axis is the pitch distance, in half-steps, between the saxophone (always at pitch C4) and the oboe. The horizontal axis corresponds to the distance in half-steps from the pitch of the saxophone to the pitch of the French horn. Thus, the square up four and right seven places from the lower-left corner shows the error for a C major triad in root position, with the saxophone playing C4, the oboe on E4, and the French horn on G4. The median error returned by ASE on this corpus was .039 while that of DUET was .066. Thus, both approaches worked well for source separation in the average case. Mixtures containing unison between two or more of the sources are especially difficult to separate, because of the extensive overlap of harmonics between sources. As expected, the worst performance for both methods correlates with mixtures that have many timefrequency frames with energy from multiple sources. The ASE method, however, degrades more gracefully. Over these difficult cases, the median error returned by ASE was .075, while that for DUET was .30. This is illustrated by the main diagonal on Figure 3(a) and (b). All these squares indicate mixtures where the French horn and oboe are in unison. As can be seen from the figure, ASE performs better on such mixes. ASE and other systems doing blind source separation share the weakness that they naively rely on attenuation and delay to separate sources. This causes problems in echoic environments, since
a single source may be associated with multiple attenuated and delayed echo signals. Estimation of a room impulse response function is, unfortunately, impossible for many commercial recordings, since they are composite mixtures created in the studio. Finding ways to handle the echo problem is an area of active research. ANOTHER APPROACH TO SOURCE SEPARATION An alternate approach to source separation is to create a system designed after the monaural aspects of source separation in human audition. Work in computational auditory scene analysis has traditionally concentrated on modeling source separation in human auditory perception, and systems have been a means of informing and testing perceptual hypotheses. Unfortunately, our current understanding of human auditory perception is not sufficient for robust, automated source separation based only on perceptual models. Source separation in music can, however, be informed by perceptual theories without necessarily being tied to them. A good example of this is the Peak-Edge-Strand-Complex Extractor (PESCE) system [13]. PESCE is designed to isolate a singer from a monaural multisource recording by using the common frequency modulation of the partials of the voice, an approach informed by psychological theories of human source segregation [14]. In speech signals, partials are typically found through peak tracking using a McAulay-Quatieri based approach [15]. This often fails on signals with significant frequency modulation and interference from harmonic sources, such as singing with vibrato to piano accompaniment. PESCE instead finds partials for a single source using a graphical approach that connects peaks in the time-frequency representation of a signal into edges called harmonic strands. Harmonic strands are created using a series of heuristic rules informed by psychology research in auditory scene analysis. Strands are joined into harmonic complexes by iteratively choosing the
IEEE SIGNAL PROCESSING MAGAZINE [131] MAY 2006
most-correlated pair and combining them. The formed complex is combined with strands and other complexes in the same way. This proceeds until a single harmonic complex contains the strands corresponding to single source in the music. A harmonic complex can then be used to synthesize the unaccompanied singing voice. These synthesized voices are faithful enough to the original that they have been successfully used for the task of singer recognition. CONCLUSIONS This article has presented a brief overview of recent approaches to two problems of great interest for music information retrieval: query by example and automated source separation. While strides are being made by researchers in both areas, much interesting work still awaits researchers. Query-by-example systems must be improved to allow a wider range of example queries. An ideal future system would allow for examples based on timbre (“sounds like electric guitar with distortion”), genre (“sounds like a rhumba”), and lyrics (“he says ‘I love you, baby’”), as well as melody and audio fingerprinting. Usable measures of timbre similarity require advances in mapping known measurable quantities, like spectral tilt, to perceptual qualities like “scratchy sounding.” Genre recognition from audio is an active research area in which there is an annual competition: the Music Information Retrieval Evaluation eXchang (MIREX) at the ISMIR Conference on Music Information Retrieval. Recognition of lyrics in sung text is, perhaps, the most difficult case of speech recognition, given the noisy environment and greatly distorted speech. Source separation, in a musical context or otherwise, presents many clear challenges to researchers. Greater understanding of how humans parse complex musical scenes, especially in dealing with echo effects, could be of great use to inform future directions in DSP research. Do humans automatically generate room impulse response functions in parsing audio scenes, or
[exploratory DSP]
continued
can we separate sources in echoic environments without them? How do humans learn to characterize sources? What do the characteristics of easy-toparse (or hard-to-parse) music tell us about the nature of the perceptual systems whose performance we are attempting to emulate? Answers to these questions will also shed light on useful approaches to DSP for these problems. Another direction to be explored is the integration of top-down, heuristic-based approaches from the computational auditory scene analysis community with the relatively knowledge-free approaches favored by the blind source separation community.
degree from the Ohio State University, he spent several years working as a professional jazz musician and software developer. As a software developer, he worked for the Speech and Hearing Science Department of Ohio State and for the statistical software company SPSS. He received an M.Mus. degree in jazz and improvisation in 2001 and a Ph.D. in computer science in 2005, both from the University of Michigan.
AUTHOR Bryan Pardo (pardo@ northwestern.edu) is an assistant professor in the Northwestern University Department of Electrical Engineering and Computer Science with a courtesy appointment in Northwestern’s School of Music. After receiving a B.Mus.
[3] J. Haitsma and A. Kalker, “A highly robust audio fingerprinting system,” in Proc. 3rd Int. Conf. Music Information Retrieval (ISMIR 2002), Paris, 2002.
REFERENCES
[1] E. Pampalk, A. Flexer, and G. Widmer, “Improvements of audio-based music similarity and genre classification,” in Proc. 6th Int. Conf. Music Information Retrieval (ISMIR 2005), London, 2005. [2] R. Dannenberg and N. Hu, “Pattern discovery techniques for music audio,” in Proc. 3rd Int. Conf. Music Information Retrieval (ISMIR 2002), Paris, 2002.
[4] A. Wang, “An industrial strength audio search algorithm,” in Proc. 4th Int. Conf. Music Information Retrieval (ISMIR 2003), Baltimore, MD, 2003. [5] W. Yost, Fundamentals of Hearing. San Diego, CA: Academic, 1994. [6] J.A. Pickens, “Comparison of language modeling and
IEEE SIGNAL PROCESSING MAGAZINE [132] MAY 2006
probabilistic text information retrieval,” in Proc. Int. Symp. Music Information Retrieval, Plymouth, MA, 2000. [7] B. Pardo, W.P. Birmingham, and J. Shifrin, “Name that tune: A pilot study in finding a melody from a sung query,” J. Amer. Soc. Inform. Science Technol., vol. 55, no. 4, pp. 283–300, 2004. [8] W. Hutchinson and L. Knopoff, “The clustering of temporal elements in melody,” Music Percept., vol. 4, no. 1, pp. 281–303, 1987. [9] R. Dannenberg, W. Birmingham, G. Tzanetakis, C. Meek, N. Hu, and B. Pardo, “The MUSART testbed for query-by-humming evaluation,” Comput. Music J., vol. 28, no. 2, pp. 34–48, 2004. [10] B. Pardo and W. Birmingham, “Query by humming: How good can it get? In workshop on music information retrieval,” in Proc. SIGIR 2003, Toronto, Canada, 2003. [11] S. Rickard and O. Yilmaz, “On the approximate W-disjoint orthogonality of speech,” in Proc. IEEE Int. Conf. Acoustics, Speech, and Signal Processing (ICASSP 2002), Orlando, FL, 2002. [12] J. Woodruff and B. Pardo, “Active source estimation for improved source separation,” EECS Dept., Northwestern University: Evanston, IL, NWU-EECS06-01, 2006. [13] M. Bartsch, “Automatic singer identification in polyphonic music,” Ph.D. dissertation, Dept. Elec. Eng. Comput. Science, The University of Michigan, Ann Arbor, 2004. [14] A.S. Bregman, Auditory Scene Analysis: The Perceptual Organization of Sound. Cambridge, MA: MIT Press, 1990. [15] R.J. McAulay and T.F. Quatieri, “Speech analysis/synthesis based on a sinusoidal representation,” IEEE Trans. Acoust., Speech, Signal Processing, vol. 34, no. 4, pp. 744–754, 1986. [SP]