International Journal of Automotive and Mechanical Engineering (IJAME) ISSN: 2229-8649 (Print); ISSN: 2180-1606 (Online); Volume 10, pp. 1910-1919, July-December 2014 ©Universiti Malaysia Pahang DOI: http://dx.doi.org/10.15282/ijame.10.2014.8.0159
FINITE ELEMENT-BASED FATIGUE BEHAVIOUR OF SPRINGS IN AUTOMOBILE SUSPENSION M. Kamal1 and M. M. Rahman1,2 1
Faculty of Mechanical Engineering, Universiti Malaysia Pahang, 26600 Pekan, Pahang, Malaysia 2 Automotive Engineering Centre, Universiti Malaysia Pahang 26600 Pekan, Pahang, Malaysia Email:
[email protected] Phone” +6094246239; Fax: +6094246222 ABSTRACT
This paper presents the fatigue behaviour of springs used in shock absorbers in automobile suspension systems. SAE 9254 is considered as a spring material. Triangular waves with a frequency of 4 Hz and SAE standard suspension loading history (SAESUS) were used for fatigue analysis. Both load histories are scaled according to the maximum and minimum values of deflection, as spring height at full-bump and full-rebound, respectively. Finite element analysis was carried out using the linear static approach. Fatigue analysis was performed using the strain-life method. Absolute maximum principal and critical plane approaches gave results of reasonable accuracy, but later had a considerably longer solution time, while signed von Mises and signed shear approaches gave very conservative results. Thus the absolute maximum principal method is found to be the best suited. The results show that the spring did not fail before 4×10⁵ cycles at 4 Hz for wave time history and 70,000 repeats for SAESUS time history at critical location. Keywords: Strain-life method, spring, suspension system, variable amplitude loading, FEA. INTRODUCTION Nowadays vehicle design is under some conflicting demands (for example, vehicles must be lightweight and also have good reliability). There is increasing pressure in the automotive industry to reduce the time taken to bring new designs to production[1-3]. At the same time it is necessary for the vehicles being developed to have the right attributes such as durability and low weight in order to remain competitive [4-8]. In automotive companies, creating new and improved designs can give a significant competitive edge and define the success or failure of an entire product line [9]. The suspension system is responsible for absorbing the shock loads produced by road disturbances [3, 10-12]. It consists of three types of components: the spring is the force-bearing member; the damper is the oscillation-damping member and the structural member. A major design concern is fatigue failure for suspension systems – to qualify, a design must not fail under fatigue when facing predefined design loading conditions [13]. The spring is made from the steel alloy SAE 9254, which is commonly used in manufacturing coil springs. The design information of the spring is available in the form of engineering drawings [14]. In this study, fatigue analysis was conducted using the strain-life method under variable amplitude loading conditions. First a loading history was generated from the fatigue test 1910
Finite element-based fatigue behaviour of springs in automobile suspension
information mentioned in the spring design as a triangular wave of 4 Hz frequency, and a second loading history used is standard SAESUS. Both histories were scaled and trimmed according to the maximum and minimum deflection (full bump and full rebound, respectively) in the design. The aim of this paper is to predict the fatigue behaviour of springs in automobile suspension using the finite element analysis approach. METHODS AND MATERIALS Finite Element Method The structural model, as well as the finite element model, is developed using ANSYS analysis code. Figure 1 shows the finite element model and boundary conditions of the springs of a suspension system. The compression load is applied through two rigid surfaces and the spring is meshed with 20 node brick elements. Thus the circular wire and coil geometry can be simulated correctly; compressing surfaces are meshed with shell elements [3]. The load is applied as a displacement which causes the deformation of the spring from a free length (no load) of 392 mm to the height of 185 mm mentioned in the design [14]. Stresses and strains from the structural analysis are used as representative of stress field in the spring in the fatigue analysis. The simulation is set up with the contact definition as a bonded contact between the compression surface and the spring, and the deformation is applied in steps to facilitate the convergence of a solution. The results of the stress analysis are transferred to fatigue analysis software to predict the fatigue behaviour of the spring under cyclic loading [13]. The required material parameters depend on the analysis methodology being used. The material is considered as elastic and isotropic. The mechanical properties of the SAE 9254 spring steel alloy are shown in Table 1. [15]. Table 1. Monotonic and cyclic properties of SAE 9254 spring steel Monotonic properties Young’s Modulus (E) Yield strength (σy) Ultimate strength (σu) Fracture strain (εf) Fracture stress (σt) Strength coefficient (K) Strain hardening exponent (n) Cyclic properties Cyclic yield strength (σ’y) Cyclic strength coefficient (K’) Cyclic strain hardening exponent (n’) Fatigue strength coefficient (σ’t) Fatigue strength exponent (b) Fatigue ductility coefficient (ε’t) Fatigue ductility exponent (c)
Value 205.4 2270 2950 4.08% 2483 2916 0.0418
Unit GPa MPa MPa MPa MPa
1922 MPa 3322 MPa 0.088 4108 MPa –0.109 1.13 –0.954
Mesh sensitivity analysis was performed on the FE model to get the appropriate size of the mesh which has a realisable balance between accuracy and cost (CPU time)[16-19]. For the analysis, specific variables and structural error in FE solution is monitored and 1911
Kamal and Rahman /International Journal of Automotive and Mechanical Engineering 10 (2014) 1910-1919
evaluated.
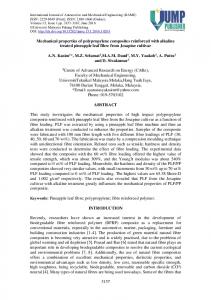
(a) Hex20 elements
(b) Tet10 elements
(c) Boundary conditions Figure 1. Finite element model and boundary conditions The hexahedral meshing approach is applied for meshing of spring geometry, tetrahedral meshing is also studied for comparison between the two mesh types [3]. The hexahedral elements (HEX20) and tetrahedral element (TET10) are used (Figure 1). It can be seen that hexahedral and tetrahedral mesh are predicted in terms of von Mises, Tresca and maximum principal stress values within a close difference, as shown in Table 2. A comparison was made between the structural errors. It can be seen that HEX20 elements of nearly same size predicted the results with much more accuracy than TET10. The larger HEX20 element size causes a considerable difference in the structural error 1912
Finite element-based fatigue behaviour of springs in automobile suspension
being induced. The convergence of the stress is considered as the main criteria for selecting the mesh type and size. Table 2 shows the results at the critical location (see Figure 2), it can be seen that HEX20 with a 0.007 m sweep mesh and a 0.0025 m face mesh has the best structural error and CPU time combination. A smaller HEX20 mesh size has a lower structural error but is not implemented due to a large increase in CPU time, storage capacity and memory requirement. Hence HEX20 mesh with a 0.007 m element size and 0.0025 m face mesh size is used in the fatigue life analysis. Table 2. Variation of mesh size and stress results for Hex20 and Tet10 mesh Mesh size (mm)
Total nodes
0.005 157,151 0.007 62,527 0.01 20,862 0.013 13,136 0.016 11,330 0.004 0.005
54,454 42,419
Total elements
Stress (MPa) Structural Error von Tresca Max. Mises Principal (×10-6) For HEX20 Mesh 36,800 1478 1705 778.24 1.137 15,184 1479.3 1705.9 776.47 3.972 6,511 1521.9 1755 798.3 186.2 4,824 1516.1 1748.3 794.59 266.9 4,523 1519.8 1752.6 794.11 382.8 For TET10 Mesh 26,668 1481.9 1708.4 778.27 186 1,967 1466.3 1690.8 774.6 2693
Strain-life Method The local strain-life approach is considered when the loading history is random and where the mean stress and the load sequence effects are thought to be of importance. This approach involves techniques for converting the loading history, geometry and material property (monotonic and cyclic) inputs into a fatigue life prediction [20]. First, the stress and strain in the critical region are estimated and then the rainflow cycle counting method [21] is used to reduce the load-time history. The next step is to use the finite element method to convert the reduced load-time history into a strain-time history, and to calculate the stress and strain in the highly stressed area. Then, the crack initiation methods are employed to predict the fatigue life. The simple linear hypothesis proposed by Palmgren [22] and Miner [23] is used to accumulate the fatigue damage. Finally, the damage values for all cycles are summed until a critical damage sum (failure criteria) is reached. In this study, the strain life analysis method is used to estimate fatigue life. The fatigue resistance of metals can be characterised by a strain-life curve. The relationship between the total strain amplitude (∆ε/2) and the reversals to failure (2Nf) can be mathematically expressed as Eq. (1) [20]. The Coffin Mason Model: a
f E
2 N
b
f
f 2 N f
c
(1)
where Nf is the fatigue life, σ’f is the fatigue strength coefficient, E is the modulus of elasticity, b is the fatigue strength exponent, ε’f is the fatigue ductility coefficient, and c is the fatigue ductility exponent. 1913
Kamal and Rahman /International Journal of Automotive and Mechanical Engineering 10 (2014) 1910-1919
The absolute maximum principal strain method is used to combine component strains: AMP 3 if 3 1 otherwise AMP 1
(2)
where εAMP is the absolute maximum principal strain, and ε1 and ε3 are the principal strains. The Morrow model is used for mean stress (σm) corrections [20]: a
f
m E
2N 2N b
f
c
f
f
(3)
Figure 2. Location of critical region. RESULTS AND DISCUSSION The linear stress analysis was performed utilising finite element analysis software to determine the stress and strain state results. The result of the maximum principal stress is used in the fatigue analysis. Maximum principal stress distribution from the linear static analysis is shown in Figure 3(a). From the results, a maximum principal stress of 776 MPa was obtained at the critical location. The equivalent stress according to von Mises and Tresca criterion at the critical location were calculated as 1479 MPa and 1706 MPa, respectively (Table 2), which shows that the spring does not have structural failure as these stress values are far below the yield strength of SAE 9254, i.e. 2257 MPa (Table 1). This makes the fatigue life determination important. Thus, the working life of the spring 1914
Finite element-based fatigue behaviour of springs in automobile suspension
can be known. Moreover, it can be seen from the stress results that there is a sudden change in the maximum principal stress direction at both ends of the spring after one complete turn of the coil. This is in fact due to the contact definition, which assumes that the first turn of the coil is always in contact with the surface geometry used for the application of load on the spring. The fatigue analysis is focused on the results at the critical location and the region around it (Figure 2). This location is selected on the basis of the experimental work by [24] in which they showed that coil spring is failed due to fatigue failure in the active coils far from the inactive coil used as the seat for the spring. The life and damage reported are plotted as contours Figure 3(b–c). It can be seen that the spring will not fail due to fatigue within the design life period of 4×10⁵ cycles at the critical location under both time histories [14]. The maximum damage is reported in Figure 3(c) and Figure 4(c) (shown in circular marks). This is because of a geometry modelling discontinuity due to the changing pitch of the coil. Sudden changes in the direction of the coil cause a higher region of stress. As these locations are far from the critical region, their effect is negligible on the results reported at the critical site and can be excluded from the fatigue analysis. Table 3. Fatigue life at critical location with various methods available Fatigue life in cycles (x106). Abs. Max. Principal Signed von Mises Signed Shear Critical Plane 52.7 0.903 0.131 57 Table 3 shows the spring lives predicted using different methods. The results agree well with the recommendations for fatigue prediction method selection which are given in Table 4 (where ae = the biaxiality ratio). The biaxiality ratio at the critical location is –0.9, as shown in Figure 4(a). Therefore, the absolute maximum principal strain is selected as a strain history combination method for fatigue analysis according to the recommended guidelines. From the results, the critical plane is also a valid candidate for analysis, but the required simulation run time is higher as the solver has to search for the critical plane first; as the predicted life is approximately the same from Abs. Max. Strain method, this makes it a better choice for fatigue life estimation. Table 4. Summarised guide for combination method selection [25] Abs Max. Principal Strain
Signed von Mises
ae = –1 (pure shear) –1 < ae < 0
OK
Conservative
ae = 0 (uniaxial) 0< ae