Finite-element-based matching of pre- and intraoperative data for image-guided endovascular aneurysm repair. Aur´elien Dumenil, Adrien Kaladji, Miguel Castro, Simon Esneault, Antoine Lucas, Michel Rochette, Cemil Goksu, Pascal Haigron
To cite this version: Aur´elien Dumenil, Adrien Kaladji, Miguel Castro, Simon Esneault, Antoine Lucas, et al.. Finite-element-based matching of pre- and intraoperative data for image-guided endovascular aneurysm repair.. IEEE Transactions on Biomedical Engineering, Institute of Electrical and Electronics Engineers (IEEE), 2013, 60 (5), pp.1353-62. .
HAL Id: inserm-00769328 http://www.hal.inserm.fr/inserm-00769328 Submitted on 31 Dec 2012
HAL is a multi-disciplinary open access archive for the deposit and dissemination of scientific research documents, whether they are published or not. The documents may come from teaching and research institutions in France or abroad, or from public or private research centers.
L’archive ouverte pluridisciplinaire HAL, est destin´ee au d´epˆot et `a la diffusion de documents scientifiques de niveau recherche, publi´es ou non, ´emanant des ´etablissements d’enseignement et de recherche fran¸cais ou ´etrangers, des laboratoires publics ou priv´es.
Finite element-based matching of pre- and intraoperative data for image-guided endovascular aneurysm repair Aurélien Duménil, Adrien Kaladji, Miguel Castro, Simon Esneault, Antoine Lucas, Michel Rochette, Cemil Göksu, and Pascal Haigron
Abstract—Endovascular repair of abdominal aortic aneurysms is a well-established technique throughout the medical and surgical communities. Although increasingly indicated, this technique does have some limitations. Because intervention is commonly performed under fluoroscopic control, twodimensional (2D) visualization of the aneurysm requires the injection of a contrast agent. The projective nature of this imaging modality inevitably leads to topographic errors, and does not give information on arterial wall quality at the time of deployment. A specially-adapted intraoperative navigation interface could increase deployment accuracy and reveal such information, which preoperative three-dimensional (3D) imaging might otherwise provide. One difficulty is the precise matching of preoperative data (images and models) and intraoperative observations affected by anatomical deformations due to tooltissue interactions. Our proposed solution involves a finite element-based preoperative simulation of tool/tissue interactions, its adaptive tuning regarding patient specific data, and the matching with intra-operative data. The biomechanical model was first tuned on a group of 10 patients and assessed on a second group of 8 patients. Index Terms: FEM simulation, tool/tissue interactions, EVAR, endovascular navigation. Manuscript received June 15, 2012. This work was supported in part by the French national research agency (ANR) through the TecSan program (project ANGIOVISION n°ANR-09-TECS-003). A. Dumenil is with INSERM, U1099, Rennes, F-35000, France, and with Université de Rennes 1, LTSI, Rennes, F-35000, France (corresponding author, phone: +33 6 15 86 71 59; fax: 33 2 23 23 69 17; e-mail:
[email protected]). A. Kaladji is with Vascular Surgery Unit, Pontchaillou University Hospital, Rennes, F-35000, France and with CIC-IT 804, Rennes, F-35000 France (e-mail:
[email protected]). M. Castro is with INSERM, U1099, Rennes, F-35000, France and with Université de Rennes 1, LTSI, Rennes, F-35000, France (e-mail:
[email protected]). S. Esneault is with Therenva, Rennes, F-35000, France (e-mail:
[email protected]). A. Lucas is with Vascular Surgery Unit, Pontchaillou University Hospital, Rennes, F-35000, France and with CIC-IT 804, Rennes, F-35000 France (email:
[email protected]). M. Rochette is with ANSYS France, Villeurbanne, F-69100, France (email:
[email protected]). C. Göksu is with Therenva, Rennes, F-35000, France, (e-mail:
[email protected]). P. Haigron is with INSERM, U1099, Rennes, F-35000, France, and with Université de Rennes 1, LTSI, Rennes, F-35000, France (e-mail:
[email protected]).
A
I. INTRODUCTION
BDOMINAL aortic aneurysm (AAA) is the most common type of aneurysm. The endovascular repair of these abdominal aortic aneurysms (EVAR) is a wellestablished technique throughout the medical and surgical communities. A real alternative to open surgery, it in volves deploying one or several endovascularly-inserted stent grafts at the anchoring site in order to repair the aneurysm. This procedure has the advantage of reducing blood loss, intraoperative morbidity, and hospital stay duration [1], [2]. Its minimally-invasive nature has led to a s ignificant decrease in short-term postoperative mortality. Although increasingly indicated, this technique has some intrinsic limitations, notably due to the devices, imaging techniques, and protocols used, which may result in failures, conversion procedures or reinterventions (repeat procedures). In order for the stent graft to reach its anchoring site, several guidewires are first inserted into the vascular structure. An extra-stiff guidewire is inserted into the iliac arteries to straighten them. These deformations are difficult to anticipate, as they depend on several factors, including vascular morphology, arterial wall rigidity, calcification status, etc. Because these interventions are commonly performed under fluoroscopic control, two-dimensional (2D) visualization of the aneurysm can only be achieved via the injection of a contrast agent. In addition to its potential for iatrogenic effects, this projective imaging modality inevitably leads to topographic errors and gives no information on arterial wall quality. Arterial wall quality, however, is a determining factor in stent graft impermeability and stability at the time of deployment [3]. A specially-adapted intraoperative navigation interface could increase deployment accuracy and reveal such information, which preoperative three-dimensional (3D) imaging might otherwise provide. This study addresses the issue of pre- and intra-operative imaging data matching in the EVAR context, and takes anatomical deformations into account in order to propose a reliable computer-aided endovascular navigation solution. The proposed approach involves the estimation of vascular deformations using the matching of a numerical simulation,
derived from preoperatively acquired patient-specific data, and intra-operative data. Few studies on computer-aided endovascular navigation are reported in the literature. Augmented reality in the field of vascular surgery can be achieved by transferring preoperative CT volume data into the intraoperative environment using a registration process [4]. Penney et al. proposed 3D/2D intensity-based rigid registration using the vertebra as regions of interest, but registration accuracy was deemed insufficient [5]. This method was then improved and they reported the results from use of their image-guided surgery system during 23 procedures [6]. The method was within the target accuracy of 3mm in 78% of cases. Göksu et al. also proposed featurebased rigid registration [7]. The features considered were 3D pre-operative vessel centerlines, extracted from pre-operative CTA, and 2D vessel centerlines, obtained from 2D intraoperative angiography. The navigation system provided good accuracy when the insertion of endovascular devices caused no deformity. Penney et al. also proposed a non-rigid registration method capable of deforming the preoperative model locally at the ostia for branched stent graft implantation [8]. This study, however, focused on the aortic segment, located above the aneurysm (celiacomesenteric segment), rather than on the iliac arteries. The proposed method was based on geometrical considerations, with no attention paid to mechanical behavior law. Finite element-based calculation makes it possible to assess deformations by taking into account mechanical considerations. Several studies have addressed the digital simulation of aneurismal wall behavior. These studies were aimed at analyzing wall stress distribution and risk of aneurysm rupture in models reconstructed from CT data [9], [10]. By taking into consideration patient-specific data, some of these studies explored the impact of geometry [11], [12] and aneurismal wall calcification on wall stress distribution [13]. Blood flow characteristics before and after stent graft implantation were compared using fluid mechanics simulations [14], [15], [16]. To our knowledge, only one study focused on the deployment of a complete aortic stent graft, with geometrical characteristics taken from a realistic phantom [17]. The vascular structure deformations caused by the progress of the stiff guidewire have also been assessed via finite element simulation [18]. Although the geometry has been defined based on patient preoperative data, no biomechanical model has been tuned according to patientspecific data. Several studies have also been conducted in order to propose virtual reality-based training systems for endovascular surgery. Solutions simulating interactions between the vascular structure and flexible [19], [20], [21] or stiff guidewires [22] have been proposed. A “ shortest path” approach has been suggested to estimate guidewire position within a rigid vascular structure [23]. These studies, however, put forth no solutions for the assessment of vascular structure deformations due to real-time constraints.
In the following study, we present first the FEM-based matching methodology, including the workflow of the proposed approach, endovascular device features, preoperative patient features, the tool/tissue interaction model, and feature-based registration. We then present the results obtained on a dataset of 18 patients. II. METHODS A. Proposed approach Fig. 1 illustrates the workflow for the proposed approach. Matching preoperative and intraoperative data involves 3D/2D rigid registration, as well as the mechanical simulation of the interactions between anatomical structures and endovascular material. This includes, specifically, the characterization and description of patient data from preoperative CT imaging and intraoperative angiographic/fluoroscopic imaging, the construction and tuning of the biomechanical model, the simulation of tool/tissue interactions via implicit finite-element analysis, and the projection of deformed model on intraoperative imaging.
Fig. 1. Workflow of the finite element-based matching of pre- and intraoperative data.
B. Endovascular device features The tool used in this analysis was a Lunderquist® (Extra Stiff Wire Guide, Cook®) stiff guidewire, which surgeon use to facilitate the insertion of aortic stent grafts during EVAR procedures. Among endovascular tools (i.e., flexible guidewires and deployment devices), it is known for most seriously deforming vascular structure. A circular beam with a diameter of 0.889mm represented the guidewire in the model. A linear elastic material model defined its mechanical behavior and its properties were set at standard values for an extra-stiff guidewire (Young’s modulus of 200GPa and Poisson’s coefficient of 0.3) [18], [24]. C. Preoperative patient features CT-scan data was analyzed with the sizing software Endosize® (Therenva, Rennes, France), used in routine practice, and which also allowed us to extract from the CTA the arterial lumen region and its centerlines, as well as vessel
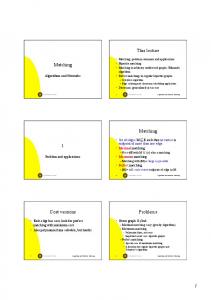
wall density (HU) reported to the edge of the vessel lumen (Fig. 2).
Fig. 2. Pre-operative sizing. (A) corresponds to the measurement point on the centerline immediately below the renal arteries, (B) to the end of the aneurysm neck, (C) to the aortic bifurcation, (D) and (E) to the left and right iliac bifurcations respectively. Calcification distribution appears in white on the vascular structure.
For each patient, a co mplete sizing was performed according to the standards of the International Society for Vascular Surgery (ISVS) [25]. For each patient, the tortuosity index (ratio of centerline to straight line distance) of the iliac arteries was determined. Each element of the mesh describing the arterial lumen was labeled with the corresponding density value obtained from the CTA. The mean of these values was calculated per arterial segment (aortic neck, aneurysm, and common iliac, external iliac, and femoral arteries). In order to obtain a geometrical representation of the vascular structure, vessels of interest were described using Bspline curves in evenly-spaced planes orthogonal to the vessel centerline. The coordinates of the planes and spline curves were imported into the Ansys DesignModeler geometric modeling software. The vascular wall was reconstituted by interconnecting the spline curves with a surface interpolation tool. A Boolean operator was used to make the junctions between vessels. The vascular structure was meshed using three-noded triangular shell elements. Vascular wall thickness was set at 1.5mm for the aorta [26] and 1mm for the iliac arteries. The materials properties of the vascular structure can be modeled using behavior laws of varying precision. According to the literature and preliminary test simulations, a linear elastic material model appeared appropriate to describe vascular structure behavior. Indeed, a more precise law did not appear necessary, since the study was not primarily aimed at assessing wall stress distribution, and preliminary simulations tended to show that the model behavior was more sensitive to boundary condition changes than to material properties. By analyzing tissue density values, it is possible to extract
several tissue categories (calcified, healthy, thrombus, etc.) for which specific behavior laws may be used. The mesh elements were classified into two tissue categories. Healthy tissue was composed of elements with a d ensity of less than 240HU, whereas calcified tissue was composed of elements with a density of more than 240HU. Elastic modulus values reported in the literature vary widely in healthy and calcified arteries. Li et al. used a Young’s modulus of 1.2MPa for normal arteries and 4.66MPa for aneurysm wall in order to model the fluid/structure interaction in a s tented abdominal aortic aneurysm [14]. Loree et al. applied circumferential tensile stress to human intimal atherosclerotic plaque and measured a tangential modulus of 1.466 ± 1.284MPa [27]. Holzapfel et al. performed cyclic quasistatic uniaxial tension tests in the axial and circumferential directions and showed that calcifications have a linear mechanical response with an average Young’s modulus of 12.6 ± 4.7MPa [28]. Maier et al. performed uniaxial tension tests to determine the mechanical parameters of calcifications and showed that highly calcified AAA tissue exhibits linear elastic behavior with a Young’s modulus varying from 40 to 450MPa [29]. In our study, a linear elastic material was assigned to each of the two tissue categories (healthy and calcified) according to the values reported in the literature. Young’s modulus was set at a value of 2MPa for elements of the “healthy tissue” category and 10MPa for elements of the “calcified tissue” category. D. Tool-tissue interaction model D.1. Boundary conditions Our study focused on macroscopic modeling of the aortoiliac structure. The model was developed by defining the boundary conditions with regard to anatomical-mechanical considerations emerging from the literature and surgeons’ knowledge. Parts of the vascular structure with limited mobility could thus be identified. The suprarenal aorta is in contact with the spine, and is enveloped by a fibrous layer that maintains it f irmly against the spine. Furthermore, clinical expertise allowed us to identify the suprarenal aorta, aortic bifurcation, and origin of the internal iliac arteries as structures with limited mobility and highly constrained by surrounding structures. Based on these considerations and observations, the boundary conditions of the model were defined as follows (Fig. 3): - The celiac part of the abdominal aorta and the guidewire insertion area in the femoral artery region were considered as fixed. - Elastic supports were used to model the behavior resulting from the interaction between vascular structures and surrounding tissues. These supports are boundary conditions incorporated within the simulation software which specify spring stiffness per unit area acting exclusively in the direction normal to the face of elements. Elastic supports were used to model the areas of anatomical constraint between the posterior
face of the aorta and the anterior face of the vertebral column. Additional elastic supports were considered on the common iliac arteries with stiffness values to be tuned.
Fig. 4. Geometrical modification of the iliac artery mesh for pre-stressing. The straight line Cs is represented by the dashed line, the initial centerline Ci in light gray, the new centerline Cp in black, the initial mesh in light orange, and the new mesh in dark orange. Fig. 3. Boundary conditions of the finite element model. The proximal (A) and distal (D) extremities of the model are fixed. Elastic supports (in blue) are added to the suprarenal aorta (B) and the common iliac arteries (C).
D.2. Pre-stress The aorto-iliac structure is in constant interaction with blood flow and neighboring anatomical structures (muscles, fat, etc.). The configuration of the vascular structure visible on the preoperative CT-scan thus does not reflect its resting state (isolated structure). These neighboring structures are not explicitly represented, but their leverage must be taken into account in the simulation. Clinical observations have suggested that arteries free of constraint were shorter and straighter than the same arteries in vivo. It was therefore decided to modify the resting state of the iliac arteries by taking these observations into account. Based on Holzapfel’s experiments [30], S. Scherer et al. applied an axial pre-stress of 10% to arteries [31]. In our study, the same standard pre-stress value P was used. It was adjusted depending on the degree of iliac artery tortuosity T. The shape of the artery at rest was determined based on a modified centerline intermediate between the initial centerline and a straight line between the aortic and iliac bifurcations. This centerline coordinates Cp were calculated using the following relationship: Cp = r * Cs + (1-r) * Ci where Cs corresponds to the straight line coordinates, Ci to the initial centerline coordinates, and r to a coefficient used to obtain the length of the desired artery. The initial mesh of the iliac artery was then transformed around the new centerline in order to obtain the estimated shape of the artery at rest (Fig. 4). At the start of simulation, the calculated displacements were applied to the iliac artery. Parietal stresses were then cancelled, and the artery was placed back in its initial position, resulting in a pre-stress state.
D.3. Simulation The simulation was designed to study the steady state of the model at the end of stiff guidewire insertion. The intermediate states corresponding to the progressive insertion of the guidewire were not studied. At the beginning of the simulation, pre-stress was applied to the iliac artery in which the guidewire was to be inserted. The guidewire was then positioned on a line that constrains it within the vascular structure, minimizing its bending energy. This line was estimated by finding the path with minimal bending energy, using Dijkstra’s algorithm and Hooke’s law [23]. The guidewire was then placed on this line, and its proximal extremity was fixed at the insertion site. Tool-tissue interactions were modeled by contact without friction based on a penalty method. Contact elements were defined between the stiff guidewire and the internal surface of the vascular structure. The contact between the stiff guidewire and the aorto-iliac structure was then activated, and the imposed displacements were progressively cancelled until the steady state of the model was achieved (Fig. 5).
Fig. 5. Simulation of tool/tissue interactions. The pre-stress is applied to the iliac artery (left). The guidewire is positioned within the vascular structure (middle). The guidewire is relaxed and deforms the aorto-iliac structure until steady state of the model is reached (right).
E. Feature based rigid registration In order to match pre- and intra- operative data, the geometrical 3D/2D transformation, between 3D pre-operative coordinate system (associated to CTA and deformation simulation) and 2D intra-operative coordinate system (associated with angiography/fluoroscopy), was estimated through a f eature based registration process (Fig. 6). 3D-2D registration has been largely reported in the literature [4]. We just present the outline of the implemented method which consists in finding six extrinsic rigid-body parameters [7], the four intrinsic perspective projection parameters being known (from intra-imaging device data or calibration). The image distortion produced by X-ray image amplifier was firstly corrected [29]. The 2D data was derived from standard angiography, with a contrast medium injected so as to visualize the vascular structure. Successive subtracted angiography images were combined to visualize the entire vascular structure of interest. Thresholding was performed to obtain a binary image. The centerlines of the projected arteries were subsequently extracted by morphological skeletonization. The registration distance criteria used to determine the 3D2D transformation was the Euclidean 2D distance between the transformed (projected) 3D pre-operative vessel centerlines and the 2D vessel centerlines actually observed in the 2D intra-operative image. A Chamfer operator was used to precompute a d istance map from the 2D vessel centerlines. A Powell optimization algorithm was used to iteratively minimize the distance criteria, and thus to estimate the 3D-2D transformation. The registration error was defined by the mean distance between the transformed 3D centerlines and the 2D intraoperative centerlines. In the following the simulation error was defined in the same way by considering 3D simulated guidewire and 2D observed guidewire.
F. Adaptive tuning The parameters of the boundary conditions (stiffness of elastic supports) and pre-stress level of the iliac artery were adjusted, taking into account the projection of the simulated guidewire on the intraoperative images. After identifying the error between the projected simulated guidewire and the real guidewire, appropriate model parameters were interactively adjusted to reduce the distance between the two (Fig. 7).
Fig. 7. Projection of the simulated guidewire on an intra-operative image. Observed guidewire appears in red and simulated guidewire in yellow. On the left, simulation error is not acceptable. On the right, simulation error is considered as acceptable after manual tuning.
Parameter tuning was performed on a training dataset. It was used to exhibit an analytical law with respect to geometrical and density characteristics of the artery wall. The behavior laws between parameter values and patient data (calcification degree, tortuosity) thus resulted in a unique adaptive model. G. Experimental data analysis Preoperative CT-scan data and intraoperative fluoroscopic images were acquired for 18 patients with an AAA treated by EVAR. This data was matched for each patient using rigid registration based on the centerlines of the vascular structures before stiff guidewire insertion. The study was divided into two distinct phases. In an initial training phase conducted on a first patient group, the biomechanical properties of the model (material properties, boundary conditions, contact properties, etc.) were adjusted based on comparison with intraoperative images. Based on the results obtained, laws establishing the relationship between patient-specific “imaging” data and “biomechanical” data were assessed using polynomial regression so as to obtain a unique patient-adaptive model. In a second phase, the model obtained was investigated with a second patient group. III. RESULTS
Fig. 6. Feature based 3D/2D registration. The 3D-2D transformation is estimated using the preoperative (red) and intraoperative (blue) centerlines and then used to evaluate the deviation between simulated (red) and observed (blue) guidewires.
A. Data sets CT-scan data were obtained for 18 consecutive patients who underwent EVAR in the Department of vascular surgery of the University Hospital of Rennes, France. Interventions were performed when aneurysms exceeded 50mm in diameter. The mean age was 70.9±10.1 years. This study was approved by the hospital’s ethics committee. CT-angiograms were carried out using a 6 4-sclice CT scan (General Electric Medical Systems, Milwaukee, Wisconsin,
USA, LightSpeed16). Data acquisition parameters were as follows: slice thickness of 1.25mm; tube of 215-260mA and 120kVp. The patients were injected with 120ml of a non-ionic iodinated contrast medium (Hexabrix, iodine concentration of 320mg/mL). CT windowing was performed at 400 HU in the periphery and 40HU in the center. The first group A, composed of 10 patients, was considered as the training group. The second group B, composed of the remaining eight patients, was considered as the test group. B. Rigid registration The registration error of each patient is presented in Fig. 8. The mean registration error for the entire patient population was 1.55±0.45mm, with no significant difference between the training and the test groups (p = 0.756). The registration error for all 18 patients was correlated with the angulation of the aortic neck (p= 0.014), the tortuosity index of the aneurysm (p=0.003), and the aneurysm angle (p=0.010), which seems to be in line with the results obtained by Carrel et al. [33].
Based on these parameters, two behavior laws were established between parameter values and patient data. Prestress level was correlated (R² = 0.86) with tortuosity of the iliac artery (Fig. 9): P = -0.6 * T² + 0.9652 * T + 0.6377.
Fig. 9. Pre-stress level versus iliac artery tortuosity (for group A).
In the same way, stiffness of the elastic support S was correlated (R² = 0.79) with mean density D of the common iliac arterial wall (Fig. 10): S = 0.00002 * D – 0.000028 N/mm3.
Fig. 8. Box plot of the registration error for the eighteen patients.
C. Adaptive setting of simulation parameters Simulations were carried out using the Ansys Mechanical finite-element solver on a Hewlett Packard Z800 workstation (HP Development Company, California, USA) equipped with a 6-core Xeon processor (3.46GHz). A first manual tuning of the parameters was performed on the training group (A). Model parameters were adjusted independently for each patient, taking into account simulation results projection on the intraoperative images. Simulation errors (including registration error) for the training group are presented in Table 1. The mean simulation-related error was 2.1±0.8mm. TABLE 1
SIMULATION ERROR FOR THE MANUAL TUNING (GROUP A) Patient Mean Min - Max 1 0.9 ± 1.5 0.0 - 2.7 2 2.0 ± 1.1 0.0 – 4.9 3 1.7 ± 1.3 0.0 – 4.0 4 2.1 ± 1.2 0.0 – 6.1 5 1.9 ± 1.3 0.0 - 4.0 6 4.1 ± 1.3 0.0 - 10.2 7 2.0 ± 0.9 0.0 - 4.4 8 1.8 ± 1.3 0.0 - 5.0 9 3.0 ± 1.7 0.0 - 6.8 10 1.5 ± 1.4 0.0 – 6.8
Fig. 10. Elastic support stiffness versus mean density of the common iliac arterial wall (for group A).
Model parameters for each patient were then modified during a second phase in order to check the previously established laws. For this second phase, simulation errors (including registration error) are presented in Table 2. Mean simulation-related error (including registration error) was 2.3±0.6mm. TABLE 2 SIMULATION ERROR FOR THE ADAPTIVE MODEL (GROUP A) Patient Mean Min - Max 1 1.4 ± 0.7 0.0 - 2.5 2 1.7 ± 0.9 0.0 - 4.2 3 2.7 ± 1.5 0.0 - 6.3 4 3.0 ± 1.4 0.0 - 6.6 5 1.5 ± 0.1 0.0 - 3.6 6 3.5 ± 2.6 0.0 - 9.0 7 1.5 ± 0.9 0.0 - 3.1 8 2.1 ± 1.3 0.0 - 5.4 9 3.5 ± 1.7 0.0 - 8.6 10 2.2 ± 1.2 0.0 - 4.8
One patient’s intra-operative data was used to match 3D and 2D data on a s econd incidence. Simulation results could thus be compared with intraoperative imaging not used for the tuning of the model parameters. The simulated guidewire was thus projected on two images with a d ifferent angle of incidence (left anterior oblique [LAO] 20° + caudal 13-15° / LAO 30° + cau dal 13-15°). The simulation-related error for this patient was 3.5±2.5mm for the first incidence and 2.0±1.3mm for the second incidence. D. Evaluation of pre- / intra- operative matching The FEM-based matching was applied to the test group (B) using the adaptive model. Simulation errors (including registration error) for this second group are presented in Table 3. Mean simulation-related error was 2.8±0.5mm. Mean simulation calculation time was 301±168 seconds. Typically, 10 minutes were required for data analysis and extraction, 10 minutes for preparation of the simulation, 5 minutes for simulation, and 2 minutes for registration. Simulation results can thus be used to integrate the deformation of the aorto-iliac structure in 3D/2D fusion (Fig. 11 and 12). The matching between the vascular structure and the observed guidewire is largely improved when the deformed model is used. TABLE 3 SIMULATION ERROR FOR THE ADAPTIVE MODEL (GROUP B) Patient Mean Min - Max 11 2.6 ± 1.6 0.0 - 6.6 12 3.6 ± 2.5 0.0 - 9.1 13 4.3 ± 1.9 0.0 - 7.8 14 1.7 ± 0.8 0.0 - 3.0 15 1.2 ± 0.9 0.0 - 4.2 16 3.1 ± 1.9 0.0 - 6.2 17 3.6 ± 1.6 0.0 - 5.7 18 2.1 ± 1.5 0.0 - 4.8
Fig. 11. Roadmap with preoperative aorto-iliac structure. The inserted stiff guidewire has deformed the vascular structure. It is not superimposed with the preoperative aorta model.
Fig. 12. Roadmap with simulated aorto-iliac structure deformed by the stiff guidewire. The observed guidewire is superimposed with the deformed aorta model.
IV. DISCUSSION With the extension of EVAR to more and more complex cases (difficult anatomies, and branched and fenestrated stent grafts), a navigation system able to integrate the deformation of vascular structure would be of main interest. The use of such a system could ultimately impact intervention duration, the patient x-ray dose, contrast injection, and stent graft placement. In this study, we presented a new method for the matching of 3D preoperative data and 2D intraoperative images taking into account anatomical deformations caused by endovascular devices during EVAR procedure. Vessel deformations were computed during the preoperative phase using a patient-specific finite element model. Patientspecific simulation makes it difficult to take into account the biomechanical properties of each surrounding tissue. In order to focus on evaluating the macroscopic behavior of the vascular structure, we modeled the surrounding tissues with boundary conditions resulting from surgical expertise. This model did not integrate such details as layer-specific material properties or the non-uniformity of wall thickness. The impact of boundary conditions on the behavior of the model was subject to specific study. This work concentrated on the image-based tuning of boundary conditions, though very few data are reported in the literature. When considering undeformed vascular structures, registration based on pre-operative and intra-operative centerlines appears to be accurate. Registration error, which averages 1.5mm, allows us to correctly assess the finite element simulation results. In the context of deformation simulations, the interactive tuning of model parameters yielded acceptable results, with simulation errors close to 2mm, and highlighted a unique adaptive model. Indeed, the first tuning led to behavior laws with a good correlation. The mean simulation error was of the same order of magnitude for both the manual and adaptive tuning models, which suggests the correct parameters were tuned. Despite the straightforward relationships between
patient data and model parameters, results from the test group were almost as good as those from the training group. Simulation error averaged less than 3mm, which is within the range of acceptable clinical accuracy that Penney et al. assumed [6]. Simulation calculation time was lower than 10 minutes for each patient. We consider this fast enough to envisage, after further developments, a role for finite element simulation in the clinical workflow (provided it is run in preoperative phase). In order to make this possible, simulations must be sufficiently predictable; this appears to be the case for the 18 patients.
surrounding tissues, including muscle, fat, and thrombus. This simplifying hypothesis could contribute to simulation error. However, full consideration of the surrounding tissue would require the fine segmentation of each tissue; this would be very time-consuming and difficult to do in clinical practice. In order to remain consistent with the clinical workflow and improve simulation accuracy, we would have to find a good balance between a detailed biomechanical simulation and a simplified simulation jointly operating with an intraoperative imagebased correction step.
Patient-specific simulation is a difficult question when it comes to the detailed representation of the reality of a patient’s non-linear material properties, boundary conditions, and prestress. We deliberately adopted a s implifying approach designed to implement the whole processing chain and address the issue of matching pre- and intra-operative data. Some inevitable limitations can be observed, especially when the different steps of the process are considered individually. First, the construction of the geometrical model induces some smoothing which may influence simulation results. A possible improvement would be to work directly on a mesh extracted from the segmentation of the vascular structure. Moreover, we assumed that the aorta was uniform in wall thickness. This assumption can be criticized because it is known that, at least in aneurysms, wall thickness varies [34]. However, as wall thickness is not easily identifiable from CT scans, most studies assume a uniform thickness, even for the analysis of wall stress. Linear material properties were chosen to describe vascular structure behavior. This could be criticized, considering that nonlinear models are often reported in the literature, especially in wall stress analysis. Nevertheless, we assumed linear law was sufficient for a first approach given the global behavior of the vascular structure. Moreover, some studies showed that arterial tissue behavior tended to be linear at a blood pressure of 80mmHg [9], [27], [35]. We nevertheless plan to use a nonlinear law, as described by Raghavan et al. [36], in a future work in order to evaluate the impact of this assumption on the simulation accuracy. Another point for improvement is the evaluation of iliac geometry at rest; in our study, the geometrical method used was straightforward. Even if our method yielded good results, we intend to improve this point by using an inverse design analysis so as to calculate a stress-free reference configuration [37], [38]. Although the time required for the process seems to fit the requirement of clinical workflow, a cer tain amount of user interaction is needed at different steps, especially during preparation of the simulation. We plan to address this issue and hope to automatize certain steps (contact zones, boundary conditions, mesh parameters, and simulation options). We took into account the effect of spine on the vascular structure through elastic supports, but we neglected other
V. CONCLUSION We presented a n ew method for the matching of 3D preoperative data (images, models) and intraoperative 2D observations affected by anatomical deformations during EVAR procedure. Patient-specific simulation of tool/tissue interactions is especially complex because the intraoperative step—for which observations showing the endovascular device interacting with tissues are available—is generally not exploited. The proposed solution involves a finite element model whose mechanical parameters (boundary conditions and pre-stress level) were adjusted based on comparisons with intra-operative images. The image-based adaptive tuning seems an effective tool that yields acceptable simulation results, especially when boundary conditions are not well known. These first results show that the proposed adaptive model is patient-specific at a macroscopic level, and can thus properly estimate the deformation of the vascular structure. This approach constitutes the basis of an augmented-reality endovascular navigation system. With further development, the proposed approach could be used to restore to practitioners an estimation of tissue deformation at different steps of the EVAR procedure. ACKNOWLEDGEMENTS This work has been partially conducted in the experimental platform TherA-Image (Rennes, France) supported by Europe FEDER. REFERENCES [1] « Endovascular versus Open Repair of Abdominal Aortic Aneurysm », New England Journal of Medicine, vol. 362, no. 20, p. 1863-1871, 2010. [2] « Evaluation des endoprothèses dans le traitement des anévrismes et des dissections de l’aorte thoracique », Rapport de la HAS, 2006. [3] J. P. Becquemin, F. Cochennec, et J. Marzelle, Chirurgie Endovasculaire des Anévrysmes de l’Aorte Abdominale, Elsevier. Paris, 2008. [4] P. Markelj, D. Tomaževič, B. Likar, et F. Pernuš, « A review of 3D/2D registration methods for image-guided
interventions », Medical Image Analysis, vol. 16, no. 3, p. 642 - 661, 2012. [5] A. P. Penney, P. G. Batchelor, D. L. G. Hill, D. J. Hawkes, et J. Weese, « Validation of a two- to threedimensional registration algorithm for aligning preoperative CT images and intraoperative fluoroscopy images », Medical physics, vol. 28, no. 6, p. 1024–1032, 2001. [6] G. Penney, A. Varnavas, N. Dastur, et T. Carrell, « An Image-Guided Surgery System to Aid Endovascular Treatment of Complex Aortic Aneurysms: Description and Initial Clinical Experience », in Information Processing in Computer-Assisted Interventions, vol. 6689, R. Taylor et G.-Z. Yang, Éd. Springer Berlin / Heidelberg, 2011, p. 13-24. [7] C. Goksu et P. Haigron, « Endovascular navigation based on real/virtual environments cooperation for computer-assisted TEAM procedures ». [8] A. Raheem, T. Carrell, B. Modarai, et G. Penney, « Nonrigid 2D-3D image registration for use in Endovascular repair of Abdominal Aortic Aneurysms », presented at the Medical Image Understanding and Analysis, 2010. [9] B. Doyle, A. Callanan, et T. McGloughlin, « A comparison of modelling techniques for computing wall stress in abdominal aortic aneurysms », BioMedical Engineering OnLine, vol. 6, no. 1, p. 38, 2007. [10] B. J. Doyle, A. Callanan, M. T. Walsh, P. A. Grace, et T. M. McGloughlin, « A finite element analysis rupture index (FEARI) as an additional tool for abdominal aortic aneurysm rupture prediction », Vasc Dis Prev, vol. 6, p. 114–121, 2009. [11] M. Xenos, Y. Alemu, D. Zamfir, S. Einav, J. Ricotta, N. Labropoulos, A. Tassiopoulos, et D. Bluestein, « The effect of angulation in abdominal aortic aneurysms: fluid–structure interaction simulations of idealized geometries », Medical and Biological Engineering and Computing, vol. 48, no. 12, p. 1175-1190, 2010. [12] B. J. Doyle, A. Callanan, P. E. Burke, P. A. Grace, M. T. Walsh, D. A. Vorp, et T. M. McGloughlin, « Vessel asymmetry as an additional diagnostic tool in the assessment of abdominal aortic aneurysms », Journal of Vascular Surgery, vol. 49, no. 2, p. 443 - 454, 2009. [13] L. Speelman, A. Bohra, E. M. H. Bosboom, G. W. H. Schurink, F. N. van de Vosse, M. S. Makaroun, et D. A. Vorp, « Effects of Wall Calcifications in Patient-Specific Wall Stress Analyses of Abdominal Aortic Aneurysms », Journal of Biomechanical Engineering, vol. 129, no. 1, p. 105-109, 2007. [14] Z. Li et C. Kleinstreuer, « Blood flow and structure interactions in a stented abdominal aortic aneurysm model », Medical Engineering & Physics, vol. 27, no. 5, p. 369 382, 2005. [15] D. S. Molony, A. Callanan, E. G. Kavanagh, M. T. Walsh, et T. M. McGloughlin, « Fluid-structure interaction of a patient-specific abdominal aortic aneurysm treated with an endovascular stent-graft ». BioMed Central, 2009. [16] B. A. Howell, T. Kim, A. Cheer, H. Dwyer, D. Saloner, et T. A. M. Chuter, « Computational Fluid Dynamics Within Bifurcated Abdominal Aortic Stent-Grafts », Journal of Endovascular Therapy, vol. 14, no. 2, p. 138-143, 2007. [17] S. D. Bock, F. Iannaccone, G. D. Santis, M. D. Beule, D. V. Loo, D. Devos, F. Vermassen, P. Segers, et B. Verhegghe,
« Virtual evaluation of stent graft deployment: A validated modeling and simulation study », Journal of the Mechanical Behavior of Biomedical Materials, no. 0, p. -, 2012. [18] A. Gupta, S. Sett, et B. Wolf, « Investigation of interaction between guidewire and native vessel using finite element analysis ». Simulia customer conference, 2010. [19] W. Tang, P. Lagadec, D. Gould, T. Wan, J. Zhai, et T. How, « A realistic elastic rod model for real-time simulation of minimally invasive vascular interventions », The Visual Computer, vol. 26, no. 9, p. 1157-1165, 2010. [20] V. Luboz, J. Zhai, P. Littler, T. Odetoyinbo, D. Gould, T. How, et F. Bello, « Endovascular Guidewire Flexibility Simulation », in Biomedical Simulation, vol. 5958, F. Bello et S. Cotin, Éd. Springer Berlin / Heidelberg, 2010, p. 171-180. [21] V. Luboz, C. Hughes, D. Gould, N. John, et F. Bello, « Real-time Seldinger technique simulation in complex vascular models », International Journal of Computer Assisted Radiology and Surgery, vol. 4, no. 6, p. 589-596, 2009. [22] J. Lenoir, S. Cotin, C. Duriez, et P. Neumann, « Interactive physically-based simulation of catheter and guidewire », Computers & Graphics, vol. 30, no. 3, p. 416 - 422, 2006. [23] S. Schafer, V. Singh, P. Noël, A. Walczak, J. Xu, et K. Hoffmann, « Real-time endovascular guidewire position simulation using shortest path algorithms », International Journal of Computer Assisted Radiology and Surgery, vol. 4, no. 6, p. 597-608, 2009. [24] Jason Burns, « Optimization of Medical Guidewires Through Controllability Matrix », Mechanical Engineering, Drexel University, 2009. [25] E. L. Chaikof, M. F. Fillinger, J. S. Matsumura, R. B. Rutherford, G. H. White, J. D. Blankensteijn, V. M. Bernhard, P. L. Harris, K. C. Kent, J. May, F. J. Veith, et C. K. Zarins, « Identifying and grading factors that modify the outcome of endovascular aortic aneurysm repair », Journal of Vascular Surgery, vol. 35, no. 5, p. 1061 - 1066, 2002. [26] M. L. Raghavan, D. A. Vorp, M. P. Federle, M. S. Makaroun, et M. W. Webster, « Wall stress distribution on three-dimensionally reconstructed models of human abdominal aortic aneurysm », Journal of Vascular Surgery, vol. 31, no. 4, p. 760 - 769, 2000. [27] H. M. Loree, A. J. Grodzinsky, S. Y. Park, L. J. Gibson, et R. T. Lee, « Static circumferential tangential modulus of human atherosclerotic tissue », Journal of Biomechanics, vol. 27, no. 2, p. 195 - 204, 1994. [28] G. A. Holzapfel, G. Sommer, et P. Regitnig, Anisotropic mechanical properties of tissue components in human atherosclerotic plaques, vol. 126. New York, NY, ETATSUNIS: American Society of Mechanical Engineers, 2004. [29] A. Maier, M. Gee, C. Reeps, H.-H. Eckstein, et W. Wall, « Impact of calcifications on patient-specific wall stress analysis of abdominal aortic aneurysms », Biomechanics and Modeling in Mechanobiology, vol. 9, no. 5, p. 511-521, 2010. [30] G. A. Holzapfel, « Biomechanics of soft tissues with application to arterial walls », in Mathematical and computational modelling of biological systems, Centro Internacional de Matemática CIM., Coimbra: , 2002, p. 1-37.
[31] S. Scherer, T. Treichel, N. Ritter, G. Triebel, W. Drossel, et O. Burgert, « Surgical stent planning: simulation parameter study for models based on DICOM standards », International Journal of Computer Assisted Radiology and Surgery, vol. 6, no. 3, p. 319-327, 2011. [32] E. Coste, D. Gibon, et J. Rousseau, « Assessment of image intensifier and distortion for DSA localization studies. », British Journal of Radiology, vol. 70, no. 829, p. 70 -73, janv. 1997. [33] T. W. G. Carrell, B. Modarai, J. R. I. Brown, et G. P. Penney, « Feasibility and Limitations of an Automated 2D-3D Rigid Image Registration System for Complex Endovascular Aortic Procedures », Journal of Endovascular Therapy, vol. 17, no. 4, p. 527-533, 2010. [34] M. L. Raghavan, J. Kratzberg, E. M. C. de Tolosa, M. M. Hanaoka, P. Walker, et E. S. da Silva, « Regional distribution of wall thickness and failure properties of human abdominal aortic aneurysm », Journal of Biomechanics, vol. 39, no. 16, p. 3010 - 3016, 2006. [35] M. J. Thubrikar, J. Al-Soudi, et F. Robicsek, « Wall Stress Studies of Abdominal Aortic Aneurysm in a Clinical Model », Annals of Vascular Surgery, vol. 15, no. 3, p. 355366, 2001. [36] M. L. Raghavan et D. A. Vorp, « Toward a biomechanical tool to evaluate rupture potential of abdominal aortic aneurysm: identification of a finite strain constitutive model and evaluation of its applicability », Journal of biomechanics, vol. 33, no. 4, p. 475–482, 2000. [37] M. W. Gee, C. Förster, et W. A. Wall, « A computational strategy for prestressing patient-specific biomechanical problems under finite deformation », International Journal for Numerical Methods in Biomedical Engineering, vol. 26, p. 5272, 2010. [38] S. De Putter, B. Wolters, M. Rutten, M. Breeuwer, F. Gerritsen, et F. Van De Vosse, « Patient-specific initial wall stress in abdominal aortic aneurysms with a backward incremental method », Journal of biomechanics, vol. 40, no. 5, p. 1081–1090, 2007.
Aurélien Dumenil is Research Engineer at the LTSI-Inserm U1099, University of Rennes 1, France. He obtained the engineering degree of the Technology University of Compiegne (UTC) in 2010. His research interests are in biomechanical simulation and image processing.
Adrien Kaladji (MD) is Vascular Surgeon at the University Hospital of Rennes, France. He received the MSc in Surgical Sciences from the University of Creteil, France, in 2011. He is now preparing a PhD Thesis at the LTSI-Inserm U1099. His research activities deal with computer aided endovascular navigation.
Miguel Castro is Research Engineer at the LTSIInserm U1099, University of Rennes 1, France. He received the PhD in Signal Processing and Telecommunications, from the University of Rennes 1, France, in 2010. His research interests are in computer aided endovascular interventions.
Simon Esneault is Research Engineer at Therenva, Rennes, France. He received the PhD Signal Processing and Telecommunications, from the University of Rennes 1, France, in 2009. H is research interests are in medical image processing.
Antoine Lucas (MD) is Vascular Surgeon at the University Hospital of Rennes, France. He received the MSc in Signal and Images in Biology and Medicine in 1994. His research interests are concerned with computer aided endovascular interventions and augmented reality in medicine.
Michel Rochette is Research Director of ANSYS France. He received the PhD in Applied Mathematics from the University of Nice. His research interests are in FEM simulation.
Cemil Göksu is CEO of Therenva SAS, Rennes, France. He obtained the engineering degree of Ecole Centrale de Lyon, France in 2001, and received the PhD in Signal Processing and Telecommunications, from the University of Rennes 1, France, in 2004. In 2007, he founded Therenva, a company developing innovative software solution for computer aided endovascular interventions.
Pascal Haigron is Professor at the University of Rennes 1, Rennes, France. He is the head of the IMPACT team (Images and Models for Planning and AssistanCe to Therapy and surgery) at the LTSI-Inserm U1099. He received the PhD in Signal Processing and Telecommunications, from the University of Rennes 1, France, in 1993. His experience is related to 3D shape reconstruction, virtual endoscopy, medical image registration and image guided therapy.