Submitted by Angus Charles Alexander Ramsay to the University ...... The wives of my supervisors and to Mrs Ann Tait for the provision of many cups of tea and ...
FINITE ELEMENT SHAPE SENSITIVITY AND ERROR MEASURES
Submitted by Angus Charles Alexander Ramsay to the University of Exeter as a thesis for the degree of Doctor of Philosophy in Engineering in the Faculty of Engineering, April 1994.
This thesis is available for Library use on the understanding that it is copyright material and that no quotation from the thesis may be published without proper acknowledgement.
I certify that all material in this thesis which is not my own work has been identified and that no material is included for which a degree has previously been conferred upon me: .......................................................
ABSTRACT Finite element shape sensitivity and error measures are practically important and active areas of research. The research conducted in this thesis concentrates on these areas and deals, in particular, with the shape sensitivity of the standard four-noded Lagrangian quadrilateral element and the estimation of errors in plane stress linear elasticity problems. Shape sensitivity of single elements is investigated through the CRE-Method of Robinson. Through this method, the performance of a single element to boundary loadings consistent with a known stress field is quantified using an error ratio of strain energy terms. The effect of different types of boundary loadings is considered. In seeking to establish bounds for the element's performance, a method proposed by Barlow is adopted. The effect of the value of Poisson's Ratio on the elements performance is recorded. A philosophy of error estimation based on the construct of an estimated stress field is introduced and error measures based on the physically meaningful concepts of strain energy are defined. A series of benchmark tests with which to evaluate error estimators proposed and investigated in this thesis is laid down. These benchmark tests are chosen such as to exhibit a range of characteristics typically found in practical engineering problems. Error estimators for which the estimated stress field is continuous and is formed by interpolating from a set of unique nodal stresses with the element shape functions have gained popularity over recent years. The error estimator used commercially in the ANSYS suite of finite element software, for which the unique nodal stresses are achieved through simple nodal averaging, is investigated. This error estimator uses an inexact form of integration known as nodal quadrature which is proved to lead to an error estimator that is asymptotically inexact. In seeking to improve this error estimator a number of variations are evaluated. Of these variations the application of known static boundary conditions leads to an estimated stress field that, in addition to being continuous, is boundary admissible and is demonstrated to yield a dramatic improvement in the effectivity of an error estimator. Different methods of achieving the set of unique nodal stresses such as the patch recovery method of Zienkiewicz and Zhu are also considered. Other forms of error estimator for which the estimated stress field is statically admissible in an element by element sense are then considered. The estimated stress field is obtained through a weighted least squares fit, performed at the element level, between the original finite element stress field and the statically admissible estimated stress field. Such error estimators are shown to be ineffective for the element under consideration. By replacing the original finite element stress field with one which has been processed such as to be continuous and boundary admissible, this method of error estimation is demonstrated to be effective. In the last part of this thesis an iterative method is proposed and investigated which attempts to map the original finite element stress field into an estimated stress field which is statically admissible at the global level. The method is shown to yield highly effective error estimation for a class of problems which can be considered as being driven by equilibrium considerations.
1
LIST OF CONTENTS
LIST OF TABLES
7
LIST OF FIGURES
11
NOMENCLATURE
17
ACKNOWLEDGEMENTS
23
CHAPTER 1 - INTRODUCTION
24
1.1
Statement of aims
24
1.2
Finite element approximation
24
1.3
Survey of relevant literature
30
1.3.1
Continuous estimated stress fields
31
1.3.2
Statically admissible estimated stress fields
35
1.3.3
Error estimation through consideration of residuals
38
1.4
Precise nature of research reported in this thesis
41
CHAPTER 2 - SHAPE SENSITIVITY OF SINGLE ELEMENTS
46
Summary
46
2.1
Introduction
46
2.2
Statement of the equations of membrane elasticity
48
2.3
Shape parameters for the membrane element
51
2.4
Finite element formulation for a single element
58
2.5
Continuum region test fields
61
2.6
The CRE-Method with applied nodal displacements
64
2.7
Numerical integration schemes
68
2.8
A series of tests using the CRE-Method
71
2.9
Results from the CRE-Method with applied nodal displacements
73 2
2.10
Bounds on the error ratio for applied nodal displacements
78
2.11
The CRE-Method with applied nodal forces
80
2.12
Results from the CRE-Method with applied nodal forces
82
2.13
Bounds on the error ratio for applied nodal forces
84
2.14
Barlow's Method applied to the four-noded quadrilateral
85
2.15
A series of tests using Barlow's Method
89
2.16
Results from Barlow's Method
90
2.17
Closure
91
CHAPTER 3 - A POSTERIORI ERROR ESTIMATION THROUGH 98 THE USE OF ESTIMATED STRESS FIELDS
Summary
98
3.1
Introduction
98
3.2
A philosophy for estimated error measures
99
3.3
Stress recovery schemes
104
3.4
A series of plane stress elasticity benchmark tests
106
3.4.1
Benchmark test number 1
110
3.4.2
Benchmark test number 2
111
3.4.3
Benchmark test number 3
112
3.4.4
Benchmark test number 4
113
3.4.5
Benchmark test number 5
114
3.4.6
Benchmark test number 6
117
3.4.7
Benchmark test number 7
121
3.4.8
Benchmark test number 8
124
3.4.9
Benchmark test number 9
125
3.5
Closure
126
3
CHAPTER 4 - ERROR ESTIMATION USING ESTIMATED STRESS 129 FIELDS THAT ARE CONTINUOUS
Summary
129
4.1
Introduction
129
4.2
Finite element stress schemes
131
4.3
A group of simple error estimators
131
4.4
Performance of the simple error estimators
133
4.5
Simple error estimators with applied static boundary conditions
143
4.6
Performance of simple error estimators with applied SBC's
147
4.7
Error estimators based on patch recovery schemes
159
4.8
Performance of error estimators based on patch recovery schemes 169
4.9
Comparison with other published results
179
4.10
Closure
180
CHAPTER 5 - ERROR ESTIMATION USING ESTIMATED STRESS 183 FIELDS THAT ARE LOCALLY STATICALLY ADMISSIBLE
Summary
183
5.1
Introduction
183
5.2
Elementwise statically admissible estimated stress fields
184
5.3
Elementwise fitting of statically admissible stress fields
185
5.4
Group 1 error estimators
188
5.5
Performance of Group 1 error estimators
188
5.6
Group 2 error estimators
196
5.7
Performance of Group 2 error estimators
197
5.8
Group 3 error estimators
203
5.9
Performance of Group 3 error estimators
203
5.10
Closure
212 4
CHAPTER 6 - ERROR ESTIMATION USING ESTIMATED STRESS 214 FIELDS THAT ARE GLOBALLY STATICALLY ADMISSIBLE
Summary
214
6.1
Introduction
214
6.2
The iterative method
215
6.3
Mathematics of the iterative method
218
6.4
The iterative method applied to problems with linear analytical
226
stress fields 6.5
The iterative method applied to problems with quadratic
235
analytical stress fields 6.6
The iterative method applied to BMT5
240
6.7
The iterative method applied to BMT's 6 and 7
252
6.8
Closure
266
CHAPTER 7 - CONCLUSIONS
270
APPENDICES
280
Appendix 1
Analytical expressions for the finite element stress field
280
Appendix 2
Proof of equality of error ratios for rectangular elements in 282 constant moment stress fields
Appendix 3
Proof that nodal quadrature gives an upper bound on the 287 integration
Appendix 4
Derivation of an expression for the strain energy of the 290 estimated error
5
Appendix 5
Proof that the quadratic stress fields are not used in a least 292 squares fit to bi-linear stress field
Appendix 6
Algebraic argument for the existence of inadmissible modes 296 of traction
REFERENCES
303
6
LIST OF TABLES
CHAPTER 2
Table 2.1
Configuration parameters used for all tests
67
Table 2.2
Convergence of strain energies with Gauss scheme
70
Table 2.3
Numerical integration schemes
71
Table 2.4
Independent tests to be performed for the CRE-Method
72
Table 2.5
Error ratios for the square element of Figure 2.11
73
Table 2.6
Summary of strain energy quantities
86
Table 2.7
Eigenproblems and their corresponding error ratios
87
Table 2.8
Independent tests to be performed for Barlow's Method
90
Table 2.9
Finite element results for constant moment stress field
95
Table 2.10
Finite element results for parabolic shear stress field
97
CHAPTER 3
Table 3.1
Stress recovery schemes
104
Table 3.3
Finite element results for BMT1
110
Table 3.4
Finite element results for BMT2
111
Table 3.5
Finite element results for BMT3
112
Table 3.6
Finite element results for BMT4
113
Table 3.7
Finite element results for BMT5
115
Table 3.8
Finite element results for BMT6
119
Table 3.9
Finite element results for BMT7
122
Table 3.10
Finite element results for BMT8
124
Table 3.11
Finite element results for BMT9
125
Table 3.12
Finite element strain energy for various values of ν
127
(BMT2)
7
CHAPTER 4
Table 4.1
Finite element stress schemes
131
Table 4.2
Simple error estimators
132
Table 4.3
Error measures and effectivity ratios for EE1, EE2, EE3 136 and EE4
Table 4.4
Variation of shape parameter with refinement for an 141 element (BMT6)
Table 4.5
Error measures and effectivity ratios for EE2, EE2 b and 148
Table 4.6
EEp ) U for selected error estimators
Table 4.7
Definition of error estimators using a patch recovery 169
155
scheme Table 4.8
172
Table 4.9
Effectivity ratios for error estimators using patch recovery ) U for error estimators using patch recovery
Table 4.10
Recovered stresses at Points A and B for BMT2
173
Table 4.11
Recovered stresses at Points A and B for BMT4
173
Table 4.12
Recovered stresses at Point A for BMT6
175
Table 4.13
Recovered stresses at Point B ( σ x - component) for BMT6
175
Table 4.14
Recovered stresses at Point B ( σ y - component) for BMT6
175
Table 4.15
Recovered stresses at Point B ( τ xy - component) for BMT6
175
Table 4.16
Comparison of effectivity ratios with published results for 179
172
BMT4 (four-noded element)
CHAPTER 5
Table 5.1
Gauss schemes for integration of the matrices A and L
187
Table 5.2
Group 1 error estimators
188
8
Table 5.3
Error measures and effectivity ratios for Group 1 error 192 estimators
Table 5.4
Error measures and effectivity ratios for Group 2 error 199 estimators
Table 5.5
Error measures and effectivity ratios for Group 3 error 205 estimators
Table 5.6
Comparison of selected effectivity ratios
210
CHAPTER 6
Table 6.1
Convergence of integral measures for BMT1 (Mesh 1)
228
Table 6.2
Convergence of integral measures for BMT2 (Mesh 1)
229
Table 6.3
Convergence of integral measures for Meshes 1,2 & 3 231 (BMT2)
Table 6.4
Iteration for convergence to ∆ 3 > 0 . 99 (BMT2)
232
Table 6.5
Convergence of effectivity ratios for BMT8
233
Table 6.6
Iteration for convergence to ∆ 3 > 0 . 99 (BMT9)
234
Table 6.7
Integral measures for BMT3
238
Table 6.8
Applied and recovered amplitudes for the tangential 239 traction distribution (Mesh 1)
Table 6.9
Integral measures for BMT4 (Mesh 1)
Table 6.10
Effect of iteration on effectivity ratios and strain energy of 243
240
the error of the estimated stress field (BMT's 3, 4 & 5) Table 6.11
Convergence of strain energies for BMT's 3, 4 & 5
Table 6.12
Boundary tractions on the 1st quadrant of the circular 259
251
boundary Table 6.13
Effect of iteration on effectivity ratios and strain energy of 260 the error of the estimated stress field (BMT's 6 & 7)
9
CHAPTER 7 Table 7.1 Table 7.2
Comparison of effectivities for four- and eight-noded 275 elements Comparison of β 's with published results for BMT4 (eight- 277 noded element)
10
LIST OF FIGURES
CHAPTER 1
Figure 1.1
Constant moment problem
26
Figure 1.2
Stress fields for the constant moment problem
27
Figure 1.3
Element tractions resulting from the finite element 28 solution
Figure 1.4
Lack of interelement equilibrium between nodes 8 and 9
28
Figure 1.5
Nodal forces for the constant moment problem
36
Figure 1.6
Residual quantities for constant moment problem
39
CHAPTER 2
Figure 2.1
Element co-ordinate systems
51
Figure 2.2
Shape parameters for the four-noded quadrilateral
53
Figure 2.3
Degeneration of element shape as taper (Tx ) is increased
54
Figure 2.4
Variation of ψ with shape parameters AR & S
55
Figure 2.5
Variation of shape parameters with mesh refinement
57
Figure 2.6
Continuum region
61
Figure 2.7
Element within continuum region
64
Figure 2.8
Variation of boundary tractions with Y0
67
Figure 2.9
Uncoupling of boundary tractions for Element B
67
Figure 2.10
Convergence of U h with integration scheme
71
Figure 2.11
Standard continuum region and base element for tests
72
Figure 2.12
Variation of error ratio e ∆ with Poisson's Ratio
73
Figure 2.13
Results
from
the
CRE-Method
(applied
nodal 74
displacements) Figure 2.14
Test displacement field for observation (ii)
Figure 2.15
u-displacement field with zero's at the nodes of the element 77
76
11
Figure 2.16
Results from the CRE-Method (applied nodal forces)
82
Figure 2.17
Square element rotated in continuum
83
Figure 2.18
Boundary tractions and corresponding consistent loads
83
Figure 2.19
Regions of possible error ratio eQ (applied nodal forces)
90
Figure 2.20
Variation of maximum eQ with shape parameter and 92 Poisson's Ratio
Figure 2.21
Continuum and tractions for constant moment stress field
94
Figure 2.22
Meshes A & B (undisplaced and displaced)
95
Figure 2.23
Mesh and tractions for r-adaptivity example
96
CHAPTER 3
Figure 3.1
Consistent nodal forces for the general case
Figure 3.2
Consistent nodal forces for linear and quadratic traction 108
107
distributions Figure 3.3
Benchmark test 1
110
Figure 3.4
Benchmark test 2
111
Figure 3.5
Benchmark test 3
112
Figure 3.6
Benchmark test 4
113
Figure 3.7
Benchmark test 5
114
Figure 3.8
Stress fields for BMT5
116
Figure 3.9
The infinite membrane
117
Figure 3.10
The finite membranes and meshes
118
Figure 3.11
Boundary tractions t
Figure 3.12
Analytical stress fields for BMT6
120
Figure 3.13
Geometry and meshes for BMT7
121
Figure 3.14
Boundary tractions for BMT7
122
Figure 3.15
Analytical stress fields for BMT7
123
Figure 3.16
Benchmark test 8
124
Figure 3.17
Benchmark test 9
125
kp d
118
12
CHAPTER 4
Figure 4.1
Transformation from a discontinuous σ h to a continuous σ% 129 by interpolating unique nodal stresses over an element with the element shape functions
Figure 4.2
Error measures for BMT2
134
Figure 4.3
Convergence of error measures for the simple estimators
137
Figure 4.4
Convergence of effectivity ratios for the simple error 138 estimators
Figure 4.5
Degrees of freedom for 5% accuracy (BMT1)
139
Figure 4.6
Error measures and effectivity ratios for BMT8
142
Figure 4.7
Consistent tractions for linear and quadratic traction 144 distributions
Figure 4.8
Consistent nodal stresses for the general case
145
Figure 4.9
Convergence of error measures for EE2, EE2 b and EEp
149
Figure 4.10
Convergence of effectivity ratios for EE2, EE2 b and EEp
150
Figure 4.11
152
Figure 4.12
Error measures and effectivity ratios for BMT8 ) U for selected error estimators
Figure 4.13
Stress fields for BMT1 and Mesh 1 (simple error 157
156
estimators) Figure 4.14
Stress fields for BMT2 and Mesh 1 (simple error 158 estimators)
Figure 4.15
Patch recovery scheme for a patch of four elements
160
Figure 4.16
The normalized local patch co-ordinate system of [ZIE 93]
161
Figure 4.17
Element patch to show dependence on orientation of the 162 patch
Figure 4.18
Dependence of the stress surface on orientation of patch
Figure 4.19
The parent patch and associated curvilinear co-ordinate 165
164
system 13
Figure 4.20
Recovery
of
nodal
stresses
by
interpolation
and 167
extrapolation Figure 4.21
Convergence characteristics of error in recovered stress 173 (BMT2)
Figure 4.22
Convergence characteristics of error in recovered stress 174 (BMT4)
Figure 4.23
Convergence characteristics of error in recovered stress 174 (BMT6)
CHAPTER 5
Figure 5.1
Convergence of effectivity ratios for Group 1 error 193 estimators
Figure 5.2
Stress fields for BMT1 and Mesh 1 (Group 1 error 194 estimators)
Figure 5.3
Stress fields for BMT2 and Mesh 1 (Group 1 error 195 estimators)
Figure 5.4
Convergence of effectivity ratios for Group 2 error 200 estimators
Figure 5.5
Stress fields for BMT1 and Mesh 1 (Group 2 error 201 estimators)
Figure 5.6
Stress fields for BMT2 and Mesh 1 (Group 2 error 202 estimators)
Figure 5.7
Convergence of effectivity ratios for Group 3 error 206 estimators
Figure 5.8
Stress fields for BMT1 and Mesh 1 (Group 3 error 207 estimators)
Figure 5.9
Stress fields for BMT2 and Mesh 1 (Group 3 error 208 estimators)
Figure 5.10
Error measures and effectivity ratios for BMT8
209 14
Figure 5.11
Comparison
of
effectivity
ratios
for
selected
error 211
estimators
CHAPTER 6
Figure 6.1
Schematic diagram of the iterative method
Figure 6.2
Shape of matrices for the Iterative method Mesh 1 of 224
216
BMT1 Figure 6.3
Demonstration of non-existence of self-stressing modes
Figure 6.4
Convergence of effectivity and energy ratios for BMT' 1&2 230
225
(Mesh 1) Figure 6.5
Comparison of stress fields after first iteration (BMT2) for 231
kp s$ = kp 0 1
Figure 6.6
Convergence of effectivity ratio for Meshes 1,2 and 3 232 (BMT2)
Figure 6.7
Convergence of effectivity ratio for BMT8
233
Figure 6.8
Boundary tractions for BMT3 (Mesh 1)
236
Figure 6.9
Displaced shape for BMT3, Mesh 1 and SBS2
237
Figure 6.10
Tangential traction distribution on boundary at x = 8 m 239 BMT4 (Mesh 1)
Figure 6.11
Boundary tractions for the elements of Mesh 1 (BMT5)
241
Figure 6.12
Resultant forces for Mesh 1( BMT5)
242
Figure 6.13
244
Figure 6.14
Effect of iteration on effectivity ratios ) Effect of iteration on U
Figure 6.15
Convergence of
lσ% q for 3
245
iterative method (converged 246
results) BMT5 Figure 6.16
Convergence of finite element quantities for compatible 247 model BMT5
Figure 6.17
Convergence of finite element quantities for equilibrium 248 model BMT5 15
Figure 6.18
Convergence of strain energies for BMT's 3, 4 and 5
252
Figure 6.19
Converged statically admissible stress field σ%3 for BMT6
254
Figure 6.20
Converged continuous stress field σ%1 for BMT6
Figure 6.21
Distribution of normal traction along the line x = 0 from 256
l q
l q
255
y = 2 m to y = 10 m Figure 6.22
lt qBoundary tractions for Mesh 1 & 2
257
Figure 6.23
Displaced shape for BMT6 (full model) and SBS1
258
Figure 6.24
Converged statically admissible stress field σ%3 for BMT7
261
Figure 6.25
Converged continuous stress field σ%1 for BMT7
262
Figure 6.26
Benchmark test 10
263
Figure 6.27
Boundary tractions from iterative method (BMT10) σ%3
264
Figure 6.28
Stress resultants due to boundary tractions
265
Figure 6.29
Boundary tractions for a regular element
265
Figure 6.30
Seven independent modes of traction for σ%3
266
d
l q
l q
l q
l q
16
NOMENCLATURE The symbols used in this thesis are listed here. For each symbol the equation number and/or relevant section numbers are given. A decimal system is used for the numbering of sections and equations within a chapter such that the mantissa of an equation or section number indicates the number of the chapter to which it belongs. In the following list of nomenclature the word 'transformation' is abbreviated to tr.
Quantities relating to the true solution
{u} = u, v T
Vector of displacement components
2.1
{σ } = σ x ,σ y ,τ xy
Vector of stress components
2.3
{ε } = ε x , ε y , γ xy
Vector of strain components
2.2
{b} = bx , by
Vector of body forces
2.3
{t} = tn , tt
Vector of boundary tractions
2.4
T
T
T
T
[∂ ]: {u} → {ε } [T ]: {σ } → {t} [D]: {ε } → {σ }
Differential operator matrix
2.2
Stress/traction tr. matrix
2.4
Material matrix
2.5
E
Young's Modulus
2.5
ν
Poisson's Ratio
2.5
Π
Total potential
2.57
U
Strain energy
2.6
V
Potential energy
2.57
R1
Rotation matrix for displacement vectors
2.7
R2
Rotation matrix for vectors of stress components
2.8
Shape parameters
AR
Aspect ratio
2.11
S
Skew
2.11
Tx
Taper in x-direction
2.11
17
Ty
Taper in y-direction
2.11
Quantities relating to the finite element solution In order to distinguish between finite element quantities and true quantities the usual h subscript will be adopted for general finite element quantities thus for example whereas {u} is the true displacement field, {uh } represents the finite element displacement field. In Chapter 2 however, we wish to distinguish between the finite element quantities resulting from different types of applied boundary loading. The approach which has been adopted here is as follows: For the case of applied nodal displacements the vector of nodal displacements is given a subscript T to indicate that the true displacements have been applied at the nodes. Other finite element quantities resulting from this type of applied loading are denoted with the subscript ∆ . For the case of applied nodal forces the vector of nodal forces is given a subscript T to indicate that consistent nodal forces have been applied at the nodes. Other finite element quantities resulting from this type of applied loading are denoted with the subscript Q. Note that 'local' refers to the local element co-ordinate system and 'global' to the global co-ordinate systems.
{δ } {q}
[k ]: {δ } → {q} {∆} {Q} [K ]: {∆} → {Q} [N ]: {δ } → {u h } [B]: {δ } → {ε h } [C ]: {δ } → {σ h }
Vector of nodal displacements (local)
2.14
Vector of nodal forces (local)
2.25
Element stiffness matrix (local)
2.18
Vector of nodal displacements (global)
2.26
Vector of nodal forces (global)
2.26
Element stiffness matrix (global)
2.26
Shape function matrix
2.15
Nodal displacement/strain tr. matrix
2.16
Nodal displacement/stress tr. matrix
2.17 18
J : ∂ ∂x → ∂ ∂ξ det J
Jacobian matrix
2.38
Determinant of the Jacobian matrix
2.38
Quantities associated with the statically admissible stress fields
{f }
Vector of test field amplitudes
[h]: { f } → {σ }
Matrix whose columns form a basis for the 2.29
2.28
statically admissible stress fields
[ p]: { f } → {u}
Matrix whose columns represent independent 2.31 modes of displacement (corresponding to h )
[ p ]: { f } → {∆ T }
Test field/full nodal displacement tr. matrix
2.32
[p ]: { f } → {∆ }
Test field/part nodal displacement tr. matrix
2.50
[F ]: { f } → {QT }
Test field/full nodal force tr. matrix
2.49
T
Test field/part nodal force tr. matrix
2.52
Q
Test field/full nodal displacement tr. matrix
2.54
Q
Test field/part nodal displacement tr. matrix
2.53
Natural flexibility matrix
2.34
Test field/strain energy tr. matrix
2.35
Test field/strain energy tr. matrix
2.55
*
T
[F ]: { f } → {Q } [G ]: { f } → {∆ } [Q]: { f } → {∆ } *
[A]: { f } → U [A∆ ]: { f } → U ∆ [A ]: { f } → U Q Q
Parameters relating to the continuum region X0
Distance of element centre from Global origin in §2.6 X-direction
Y0
Distance of element centre from Global origin in §2.6 Y-direction
θ
Angle of orientation of element in continuum §2.6 region
l
Length of continuum region
§2.6
c
Semi-depth of continuum region
§2.6 19
t
Thickness of continuum region and element
§2.6
Error ratios of Chapter 2 e∆
Error
eQ
displacements Error ratio for case of applied nodal forces
ratio
for
case
of
applied
nodal 2.33 2.56
Error quantities of Chapter 3 Note that the tilde (~) is used throughout the text to indicate quantities that are estimated.
{σ } {σ e }
True stress field
§3.2
True error stress field
3.1
Estimated true stress field
3.2
Estimated error stress field
3.2
{σ }
Error in the estimated stress field
3.17
α
True Percentage error in strain energy
3.10
α~
Estimated percentage error in strain energy
3.11
β
Effectivity ratio
3.16
αφ
True percentage error in some quantity φ
3.20
U
True strain energy
3.3
Uh
Finite element strain energy
3.4
Ue ~ Ue
Strain energy of the true error
3.5
Strain energy of the estimated error
3.14
Estimated true strain energy
3.13
{σ~} {σ~e } )
~ U ) U
Strain energy of the error of the estimated stress 3.18 field
{s}
Vector of recovered nodal stresses
3.21
[H 1 ]: {δ } → {s}
Nodal displacement/nodal stress tr. matrix
3.22 20
{s } [H ]: {δ } → {s } g
g 1
g
Vector of recovered Gauss point stresses Nodal
displacement/Gauss
point
stress
3.23 tr. 3.23
matrix
H2
Gauss point stress/nodal stress tr. matrix
3.24
Quantities relating to the estimated stress fields Note that the ^ symbol is used to indicate matrices and vectors which apply to the whole model. N
Augmented matrix of element shape functions
4.1
{sa }
Vector of unique nodal stresses
4.1
{σ~1}
Continuous estimated stress field
4.1
Vector of recovered stresses for whole model
4.3
Vector of unique nodal stresses for whole model
4.3
{sˆ} {sˆa }
[Eˆ ]: {sˆ} → {sˆ }
Recovered nodal/unique nodal stresses tr. matrix 4.3
{s }
Vector of unique, boundary admissible nodal 4.5
a
* a
stresses
{σ~2 }
Continuous,
boundary
admissible
estimated 4.5
stress field
{g} [Q ]: {sa } → {sa* }
Vector of nodal stresses on static boundary
4.6
Tr. matrix for obtaining unique boundary 4.6 admissible stresses
{ba }
Vector of unique nodal stresses in boundary co- 4.8 ordinates
{b } * a
Vector of unique, boundary admissible nodal 4.9 stress in boundary co-ordinate system
σp
Polynomial stress surface for single component 4.11 of stress
{a}
Vector of polynomial coefficients
4.12
21
p : {a} → σ p
Row vector of polynomial terms
4.11
{b}
Vector involving superconvergent stress values
4.12
Coefficient matrix for least squares fit
4.12 5.1
L
Statically admissible estimated stress field ~ Matrix required in determining U e
M
Matrix required in determining { f }
5.8
Test field/nodal stress tr. matrix
6.10
[A]: {a} → {b} {σ~3}
[h ]: { f } → {s}
5.2
Miscellaneous
ϕ
Condition number of a matrix
ρ
Rank of a matrix
h
Characteristic length of an element
hmax
Maximum value of h in mesh of elements
n
Rate of convergence
( x, y)
Element Cartesian co-ordinate system
(x, y)
Locally normalized Cartesian co-ordinate system
( ξ , η)
Curvilinear co-ordinate system element and 2.9 parent patch
Vol
Volume of an element
ne
Number of elements in model
nf
Number of independent modes of statically
2.12
4.17
4.13
4.15
admissible stress
22
ACKNOWLEDGEMENTS
This research project was carried out jointly at the University of Exeter and the Robinson FEM Institute. The author is grateful to both these establishments and in particular to Professor J. Robinson of the Robinson FEM Institute for the initial encouragement given to undertake this project. The author is indebted to his supervisors Dr E. A. W. Maunder and Professor J. Robinson for their continued support and encouragement throughout the duration of this project. He recognises the extraordinarily generous and patient way in which his supervisors have given of their experience and time. Particular thanks is owed to Dr E. A. W. Maunder for the constructive criticism offered on the contents of this thesis. The author would like to record his gratitude to the S.E.R.C. and to Nuclear Electric plc for funding this project. For their encouragement, the author is also grateful to Dr T. K. Hellen and Mr G. W. Marshall of Nuclear Electric plc. As with any project of such duration, it is one's colleagues and friends that allow one sufficient sanity to be able to pursue ones research. For their various contributions towards this end, the author would like to record his gratitude to: The members of staff of the School of Engineering of the University of Exeter, in particular to Dr T.W. Chiu, Mr P.G. Kalaugher, Mrs C. A. Duffy and Mr M. El-Shaikh. The wives of my supervisors and to Mrs Ann Tait for the provision of many cups of tea and encouraging words. My fellow postgraduates in particular to those of Room 107. enjoyed and endured much together.
We have
The students of the ERASMUS scheme, in particular to those of the University of Stuttgart, Germany from whom I have learnt much. The musicians of the 'Anything Goes' Swing Band, the Exeter University Symphony Orchestra and the Exeter Symphony Orchestra. The Muslim brotherhood in Exeter, at the Mosque and in the Islamic Society. Finally, for their unerring love and support in whatever situation I place myself I would like to record my thanks to my parents the Reverend and Mrs M.R.M. Ramsay and to all members of my family.
23
CHAPTER 1 INTRODUCTION
1.1 Statement of aims The principle aim of the research presented in this thesis is to investigate and develop effective error estimators with which to predict the error in an approximate finite element solution. These aims will be pursued through numerical experiments conducted on plane stress linear elasticity problems using the standard four-noded Lagrangian element.
1.2 Finite element approximation It is an engineer's task to seek solutions to problems for which there is no known solution. approximations
He does this by a series of assumptions and and
hopes
that
the
resulting
solution,
although
approximate, is sufficiently close to the true solution for it to be one on which sound engineering judgements can be made.
The finite element
method is one whereby an approximate solution is obtained to the differential equations governing the behaviour of interest. In this thesis we are concerned with the behaviour of deforming linear elastic bodies and the differential equations are the Navier equations.
In a competent pair of
hands the finite element method can produce exceedingly realistic predictions of the actual behaviour.
Conversely, and because of its
approximate nature, in the wrong hands the solution achieved with the finite element method may be so far removed from the true solution that no sound judgements may be made with it.
For these reasons an
understanding of the nature of the approximations made in the finite 24
Chapter 1 element method and a rationale for detecting the existence of and quantifying the significance of errors in the finite element solution are important areas of research.
For problems governed by the Navier Equations the true solution must be such that:
i) the boundary conditions are satisfied, ii) the stress field is in equilibrium, iii) the displacement field is compatible, and iv) the constitutive relations for the material(s) should be satisfied.
Any approximate solution will, by definition, violate some or all of these conditions.
In the traditional displacement finite element method the
formulation is such that the displacements are a priori compatible. Equilibrium of stresses, however, although satisfied in a weak, integral sense is not satisfied in a strong, point by point sense. With respect to the boundary
conditions,
for
displacement
models
kinematic
boundary
conditions consistent with the assumed displacement field within an element are modelled exactly. Other kinematic boundary conditions, whilst usually being exact at nodes, are only modelled approximately between the nodes of an element. Static boundary conditions are enforced in a weak integral sense and are generally not satisfied exactly.
Assuming that the kinematic boundary conditions are modelled exactly i.e. that they conform with the element displacement field (in the author's experience this will usually be the case) then for the displacement finite element method errors in the solution are indicated by the lack of equilibrium and this may manifest itself in three ways:
25
Chapter 1 i) a lack of interelement equilibrium, ii) a lack of equilibrium on the static boundary, and iii) a lack of internal equilibrium
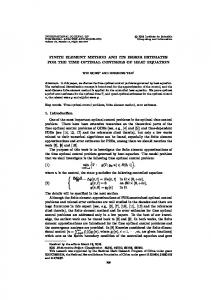
A simple example will serve to demonstrate the approximate nature of the finite element solution. The case of a rectangular continuum subjected to static boundary conditions consistent with a constant moment stress field, as given by Equation 1.1, will be investigated.
σ x = 30 y σy = 0
(1.1)
τ xy = 0
The four element model shown in Figure 1.1 will be analysed using the standard four-noded Lagrangian element being considered in this thesis. 150N/m 4
7
y
10m
8
2
3 3
4 9
x
1
6
2
1
5
2
20m
Figure 1.1 Constant moment problem
The true stress field is compared with the finite element stress field in Figure 1.2.
A comparison of these stress fields shows the approximate
nature of the finite element solution.
For the true stress field the σ x -
component of stress is the only one that is not zero. In contrast to this, all components of the finite element stress field are non-zero. The presence of stress discontinuities between elements is also seen in this figure.
The
existence of stress discontinuities between elements is an indicator of the lack of interelement equilibrium because if interelement equilibrium is to be
26
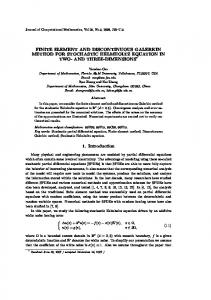
Chapter 1 satisfied then continuity of the direct stress normal to, and the shear stress tangential to an interelement boundary is required. The discontinuities in stress between elements and the way in which the static boundary conditions are violated can be seen in Figure 1.3 which shows the element tractions resulting from the finite element solution.
σx
σy y
τxy y
x
y
x
x
(a) True stress field {σ }
(b) Finite element stress field {σ h } Figure 1.2 Stress fields for the constant moment problem
Noting that the true solution for this problem has zero body forces the lack of internal equilibrium is seen though the presence of body forces in the finite element solution as shown in Figure 1.3. Note, with respect to this figure that those traction amplitudes not labelled may be deduced through considerations of symmetry.
27
Chapter 1
17.5N/m 2
5.3N/m 2
76N
40.9N/m 2
17.5N/m 2
111.7N/m 2
40.9N/m2
Figure 1.3 Element tractions resulting from the finite element solution
The lack of interelement equilibrium can be further demonstrated by considering the tractions that act on an individual interelement boundary. This has been done for the interelement boundary between nodes 8 and 9 and is shown in Figure 1.4. Note with respect to this figure that a lack of equilibrium occurs only for the normal tractions.
40.9N/m 5.3N/m
2
8
5.3N/m
10.6N/m
2
9
2
- 40.9N/m
2
2
0
Normal
Tangential
Figure 1.4 Lack of interelement equilibrium between nodes 8 and 9 28
Chapter 1 In practical terms, the engineer is interested in how much in error is the stress and/or displacement at a few selected 'critical' points in his model. The lack of equilibrium demonstrated above, although indicating the existence of error within a model does not answer this question.
The
traditional way in which this question is answered is to carry out further analyses on more refined meshes until the value of interest become independent of the mesh. This property is called convergence and means that with sufficient mesh refinement (be it h- or p-refinement) the true solution to a problem may be approached as closely as one desires. The convergent nature of the finite element method is the fundamentally desirable property that makes it an acceptable tool to engineers. It is also possible after a few mesh refinements to estimate the rate of convergence and then, from this estimate, to predict the true solution by extrapolation. Such extrapolatory methods are generally attributed to Richardson [RIC 10].
Indeed, the process of mesh refinement, if not to be carried out indiscriminately, also requires a knowledge of the distribution of error within a model. If one were able to obtain the exact error then it could simply be added to the finite element solution in order to recover the true solution. If this were possible then there would be no need for successive analysis on refined meshes since the true solution would be achieved with a single analysis. The reality of the situation, however, is that the true error cannot be established and, instead, the best that one can do is to estimate the error.
Thus, if an estimation of the error is made at the end of an
analysis the engineer is faced with two pieces of information firstly a finite element approximation to the true solution and secondly an estimation of the error in his model. If the estimation of the error is good then he may simply add it to his finite element solution to obtain a better approximation of the true solution. If the estimation of the error is bad then he might as 29
Chapter 1 well ignore it.
If, on the other hand, the estimation of the error is
somewhere in between good and bad - say reasonable - then he can use it to identify those areas of his mesh that need refining and although he knows the estimate of the error is only approximate he should have some confidence that refinement is being made in roughly the right areas of his mesh.
The reality of error estimation as it stands today is that error
estimation whilst being reasonable in an integral sense i.e. as measured in the strain energy of the error, is less good in a point by point sense. Similar to the concept of convergence in the finite element method, a desirable property of any error estimator is that as the mesh is refined the error estimator should predict the error with increasing accuracy.
Such a
property is termed asymptotic exactness.
Research into effective error estimation in the finite element method has been going on virtually since the inception of the method itself. The reasons for this are two-fold.
Firstly there is a practical need for the effective
estimation of errors by the practising engineer - effective error estimators are also required for the proper control of adaptive procedures. Secondly the area of research is an interesting and challenging one. It is likely, since the estimation of errors is itself an approximate business, that there will always be scope for improvements in error estimation and that it will remain a potentially fruitful area of research for quite some time to come. This latter point is further evidenced by the regular appearance of papers on the subject of error estimation being published in the relevant journals.
1.3 Survey of relevant literature In order to establish the current state of the art in error estimation a review of the relevant literature is required. If this is done then three distinct areas or trends of research identify themselves. These three trends will be discussed in turn. 30
Chapter 1 1.3.1 Continuous estimated stress fields The 1987 paper of Zienkiewicz and Zhu [ZIE 87] is frequently quoted in subsequent literature.
In this paper an error estimator is proposed and
discussed in the context of an adaptive procedure. The error estimator is based on the idea that the error can be estimated through the construct of an estimated stress field that is continuous across interelement boundaries. The continuous estimated stress field is achieved by interpolating from a set of unique nodal stresses over the element with its shape functions. Referring back to the way in which the finite element solution manifests its approximate nature, it is seen that continuous estimated stress fields take advantage of the lack of interelement equilibrium to reveal the error in the solution.
Many methods can be formulated for achieving a set of unique nodal stresses. In their paper, Zienkiewicz and Zhu adopt the method proposed earlier by Hinton and Campbell [HIN 74] in which the unique nodal stresses are determined through a global least squares fit between the continuous estimated stress field and the finite element stress field. The resulting error estimator is evaluated by testing it on a number of practical problems. This paper makes bold statements regarding the effectivity of the error estimation and as a pioneering work this is perfectly justified. However, later comparative studies, take for example [BEC 93], have shown that in reality the effectivity of the Zienkiewicz and Zhu error estimator is not always good when compared with others currently under research. Zienkiewicz and Zhu observed that their error estimator performed differently when used with different element types. It was for this reason that they recommended the use of empirical correction multiplying factors a different factor for each element type.
31
Chapter 1 The need for empirical correction multiplying factors begs an important question namely whether or not one should expect an error estimator to be equally effective for all element types. If the error estimator took account of all possible sources of error then this might prove to be the case. However, consider the case of an equilibrium model where the approximate nature of the solution manifests itself in a lack of compatibility whilst equilibrium of stresses is satisfied in a strong sense. For such an equilibrium model, error estimators which estimate the error through a consideration of the lack of equilibrium will, clearly, detect no error. The need to consider all possible sources of error for effective evaluation of the error is discussed by Robinson in [ROB 89b]. Clearly, unless one takes into account all possible sources of error one cannot reasonably expect an error estimator to perform equally well for all element types.
Now although in the introduction of their paper Zienkiewicz and Zhu allude to the fact that the computational cost of their error estimation is cheap, one might be tempted to question this since, in order to evaluate the unique nodal stresses one must solve a system of equations of the same order of size as those solved to obtain the original finite element solution. It is noted with respect to this point that an alternative form of error estimator is also proposed which uses a 'lumped' form of equations for which the system matrix becomes diagonal and is therefore trivial to solve. This raises an important point, namely that as well as being effective and asymptotically exact, an error estimation scheme should be computationally cheap. What does one mean by computationally cheap? This is a difficult question to answer because clearly it depends on the effectivity of the error estimation. If, for example, the error estimation was very good then one might be prepared to pay a large price in terms of computational effort to obtain the estimation. Conversely, if the error estimation is poor then one might not be prepared to expend any computational effort on obtaining the estimation. 32
Chapter 1 For error estimation that is reasonable effective the computational cost that one is prepared to allow would lie somewhere between these two extremes. The question of the asymptotic exactness of this error estimator has been investigated by researchers in the mathematics department of the University of Durham [AIN 89] who have laid down the conditions necessary for the Zienkiewicz and Zhu error estimator to be asymptotically exact.
An alternative approach for determining the unique nodal stresses is to use the nodal averaged stresses and this approach has been adopted in the ANSYS1 suite of finite element software.
Such an approach is
computationally cheap for the reason that computation of the unique nodal stresses is performed locally for each node in turn. Indeed, nodal averaged stresses are generally evaluated and reported in the post processing stage of an analysis.
Following their original paper Zienkiewicz and Zhu have developed what they term the superconvergent patch recovery scheme for obtaining a set of unique nodal stresses [ZIE 92a].
This approach determines the unique
nodal stresses locally for each individual node in turn and is therefore computationally cheap. The procedure is based on interpolating stresses evaluated at the superconvergent points surrounding a particular node, to that node, through a patch recovery scheme.
The idea that the finite
element stresses at certain points within an element are superconvergent has been propounded by a number of researchers, see for example Barlow [BAR 76]. With the superconvergent patch recovery scheme it is claimed that the unique nodal stresses will also exhibit superconvergence be they internal nodes or boundary nodes. In their paper Zienkiewicz and Zhu state 1ANSYS
is a registered trade mark for a suite of software marketed by Strucom Structures and Computers LTD, Strucom House, 40 Broadgate, Beeston, Nottingham, NG9 2WF, England.
33
Chapter 1 that the results presented 'indicate clearly that a new, powerful and economical process is now available which should supersede the currently used post-processing procedures applied in most codes'. They further claim that 'the new recovery procedures avoid certain difficulties previously encountered for quadratic elements where a large amount of adjustment was needed to obtain reasonable results'.
The implication here is that the
superconvergent patch recovery scheme produces acceptable results without the need for the empirical correction factors described in [ZIE 87].
In [BEC 93] a method of 'averaging + extrapolation' is referred to as another method for achieving a set of unique nodal stresses.
This method
determines the unique nodal stress as the weighted average of the superconvergent stresses surrounding that node.
In this method a
weighting is applied to the superconvergent stress where this weighting depends upon the included angle at the node and on the distance between the node and the (isoparametric) centre of the element. For nodes on the boundaries of the model a method of linear extrapolation is used.
More recently Wiberg et al [WIB 93a] have proposed a modification to the superconvergent patch recovery scheme of Zienkiewicz and Zhu. The major benefit of this modification is a claimed improvement in quality of the recovered stresses at boundary nodes.
The process is similar to that of
Zienkiewicz and Zhu in that unique nodal stresses are recovered from the surrounding superconvergent stresses. However, whereas Zienkiewicz and Zhu recover each component of stress individually, Wiberg does it simultaneously using, as the coupling equations, the equations of equilibrium. The claim that the recovered stresses at boundary nodes is superior to that obtained by Zienkiewicz and Zhu is an important one since, for a large class of problems it is the stresses at the boundary of a model that are the critical ones. 34
Chapter 1 In [MAS 93], Mashaie et al examine an error estimator for which the unique nodal stresses are achieved by averaging the surrounding Gauss point stresses. This concept is similar to that used by Zienkiewicz and Zhu [ZIE 92a] and by Beckers and Zhong [BEC 93]. However, for the nodes lying on the static boundary of the model the components of the stress that are affected by the static boundary conditions i.e. the direct stress normal to and the shear stress tangential to the boundary are modified according to the static boundary conditions. The results presented for this error estimator are somewhat limited, however, the conclusions would lead one to believe that this scheme results in a superior error estimation to that of Zienkiewicz and Zhu [ZIE 92a].
1.3.2 Statically admissible estimated stress fields A second trend in error estimation is that of using estimated stress fields that are statically admissible with the body forces for the true solution. It is well known that, under certain conditions, the strain energy of a compatible finite element solution is a lower bound to the true strain energy.
In
contrast to this, an equilibrium finite element solution results in an upper bound to the true strain energy. If one possesses both an upper and a lower bound to the true solution then an upper bound may be placed on the strain energy of the true error. This is the concept of dual analysis. A major problem occurring with dual analysis, and one which has restricted its use, is that although a precise upper bound is obtained, the cost of achieving this is high since for each mesh two full analyses must be performed.
This
problem is further exacerbated for the reason that the equilibrium solution for a given mesh often involves the solution of significantly larger system of equations than was required for the original displacement solution. For example, if one considers the constant moment problem of Figure 1.1 it is seen that for the displacement model there are 9 nodes × 2 dof / node = 18 dof contrast this with the equilibrium model with linear tractions for 35
Chapter 1 which there are 12 edges × 4 dof / edge = 48 dof (note this assumes that both models are assembled using a stiffness method). As a result of the high cost associated with a full re-analysis researchers have sought other approaches for obtaining equilibrium solutions to a given problem. The main theme here is to obtain an equilibrium solution for a model through local, element by element analysis.
The nodal forces resulting from a displacement finite element analysis form an equilibrium set both for the model and for each individual element as shown in Figure 1.5 for the constant moment problem. This provides the starting point for obtaining an equilibrium solution for each element. A process whereby the nodal forces for an element can be used to obtain a statically admissible stress field for each element and for the full model is now described and is attributed to Ladevèze [LAD 83].
1.6N
25N
Figure 1.5 Nodal forces for the constant moment problem
The first step in this process is to transform the equilibrium set of nodal forces into sets of boundary tractions that retain the state of element equilibrium and, in addition, are such that each interelement boundary is also kept in equilibrium. Boundary tractions that maintain interelement equilibrium are termed co-diffusive.
Having obtained equilibrating, co36
Chapter 1 diffusive boundary tractions for each element, the next step is to obtain a statically admissible stress field within each element such that it is in equilibrium with these boundary tractions. Such stress fields are achieved by local re-analysis, at the element level, using an equilibrium element. Thus, for each element a statically admissible stress field is obtained and, as a result of the co-diffusive nature of the boundary tractions, the union of these stress fields forms a statically admissible stress field for the model. This stress field may then be used to determine the upper bound on the true strain energy and, therefore, on the strain energy of the error.
In the piecewise recovery of a fully statically admissible solution two procedures are important. Firstly one must transform the nodal forces for each displacement element into sets of equilibrating, co-diffusive boundary tractions and, secondly, one must determine an elementwise statically admissible stress field corresponding to these equilibrating, co-diffusive boundary tractions. In this area of research two workers will be discussed. Ladevèze [LAD 83] proposed an method for determining equilibrating, codiffusive
boundary
tractions.
A
physically
pleasing
geometrical
interpretation of the work of Ladevèze has been given by Maunder [MAU 90].
The transformation of nodal forces into equilibrating, co-diffusive
tractions is not unique and in the interpretation of Maunder it is shown that this non-uniqueness can be represented by the position of a pole point - the pole point having two degrees of freedom for a planar problem. It is clear that for different pole point positions, different boundary tractions will be achieved and, therefore, different statically admissible stress fields. Different statically admissible stress fields will result in different upper bounds on the true strain energy.
Whilst the minimum upper bound is
achieved though re-analysis of the whole model using equilibrium elements, the piecewise approach being discussed does not generally achieve this minimum and, indeed, often results in a very high upper bound [MAU 90]. 37
Chapter 1 Currently research is being directed at bringing this upper bound down to within reasonable limits for practical error estimation [MAU 93a].
1.3.3 Error estimation through consideration of residuals Error estimation through a consideration of the force residuals is a third trend in error estimation. Two schools of thought are seen here. The first school of thought is that the strain energy of the estimated error can be determined directly through consideration of the residual quantities without recourse to the construct of an estimated stress field. The second school of thought is that by determining, for each element, an equilibrium set of residuals a statically admissible stress field corresponding to the estimated error stress field in each element can be determined by re-analysis at the element level with an appropriate equilibrium element. These two schools of thought will be discussed in more detail, however before doing this the residual quantities are defined.
The residual force quantities consist of:
i) residual body forces defined as the difference between the true body forces and the body forces resulting from the finite element solution,
ii) residual tractions on the static boundary defined as the difference between the true tractions and the tractions resulting from the finite element, and
iii) residual tractions on interelement boundaries defined as the difference between the true tractions and the tractions resulting from the finite element solution.
38
Chapter 1 i.e. in each case the residual quantity is the difference between the actual applied load and the derived load.
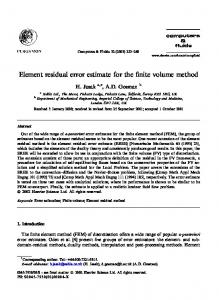
The residual quantities for the constant moment problem are shown in Figure 1.6. Note with respect to this figure that the residual tractions on the interelement boundaries are drawn showing elemental contributions. This does not mean to say that when they are subsequently redistributed to the elements the redistribution will be as shown.
5.3N/m 2
76N
38.3N/m 2
17.5N/m 2
40.9N/m 2
Figure 1.6 Residual quantities for constant moment problem
A number of researchers have investigated error estimators which determine the strain energy of the error directly from the residuals. In fact, these types of error estimators were among the very first to emerge in the field of error estimation.
Workers such as Babuška, Szabó, Rheinboldt,
Kelly and Gago are often referenced in this contest. In the 1983 paper [KEL 83] error measures defined explicitly in terms of the residuals present in and around an element were suggested and examined. More recently than 39
Chapter 1 these original papers, workers such as Zhong have examined error estimators of the type under consideration. In [ZHO 91b] an error estimator is defined for which the strain energy of the estimated error is determined explicitly in terms of residual quantities. This error estimator is compared with a number of others which use statically admissible estimated stress fields in [MAU 93a].
The second school of thought is that which adopts the concept of recovering estimated error stress fields that are statically admissible with the element residuals. In Figure 1.6 it is seen that although the residual body forces and residual tractions on the static boundary are unique to a given element, the residual tractions on the interelement boundaries, or traction jumps as they are often called, are not. Thus, the first operation required for this type of error estimator is to split the traction jumps between adjacent elements appropriately such that for each element a set of equilibrating residuals are determined. Once such a set of equilibrating residuals is obtained, a local element by element re-analysis is performed in order to obtain a statically admissible stress field which is then used as the estimated error stress field for the element. The important details of this process lie in the allocation of the traction jumps and the determination of a statically admissible stress field.
In the work of Kelly and his co-workers [YAN 93] the splitting up of the traction jumps is carried out at all interelement boundaries simultaneously. As such the method requires the solution of a global system of equations and, therefore, the computational cost is likely to be significantly more than those which use local element by element calculations. In this work the eight-noded displacement element is then used to determine the error stress field. Although for the examples shown in the paper [YAN 93] it appears to be the case, it is debatable whether one would generally achieve a strictly 40
Chapter 1 statically admissible stress field through the use of a displacement element unless it was of sufficiently high degree as to be able to return the stress field corresponding to the equilibrating residuals exactly.
A Japanese group of researchers, Ohtsubo and Kitamura [OHT 90, 92a, 92b], have also investigated error estimators of this type. In their work they opt for a local procedure for the splitting up of the traction jumps thus resulting in a much more computationally effective scheme than that proposed in [YAN 93].
Much of the work investigated makes the important point that, for the fournoded element under consideration in this thesis, it is the traction jumps that are the most significant of the residual quantities - see for example [ZIE 89].
The residual body forces contribute little to the error in the
element.
For elements such as the eight-noded element this trend is
reversed with the residual body forces making more of a contribution to the error than the traction jumps around the boundary of an element.
1.4 Precise nature of research reported in this thesis In general terms a survey of the literature demonstrates that we are still a long way off having achieved an ideal error estimator. Different strands of thought still exist and are being pursued vigorously by various groups of researchers. Thus the field of error estimation is still a potentially fruitful area of research.
Reading through the literature one observes that it is difficult to compare the performance of the various error estimators that are being investigated. The reason for this is that there appears to be no common agreement between researchers as to which problems they should use to demonstrate the effectiveness, or otherwise, of their error estimators.
Even though 41
Chapter 1 classical problems like the cantilever beam and the plate with a hole in it appear regularly, more often than not each group of researchers tend to use their own preferred geometrical and material properties. Although some papers, for example [MAU 93a] have attempted to compare the effectivity of a range of error estimators we are still a long way from the ideal situation where one can compare and contrast the performance of all the error estimators currently being researched. It might be suggested therefore that the setting down of a comprehensive set of benchmark tests be a priority for such groups as NAFEMS2. As a result of this difficulty in obtaining suitable data for comparison a part of the work undertaken in this thesis will be to lay down a series of possible benchmark tests and to examine the performance of a number of existing error estimators on these benchmark tests. This work will form a basis for comparison when, in later work, new forms of error estimator will be investigated.
It is noted also with respect to the available literature that the time elapsed between the proposed paper being received by the relevant journal and the finished product actually being published is now, for certain journals, well over a year and, indeed, two years is not unheard of. The effect of this lag in publication on the research community is at best annoyance and at worst an expenditure of effort on a line of work that has already been proved fruitful or otherwise and is therefore totally unnecessary.
Indeed this lag also
results in difficulties when corresponding over some detail in a publication. If the author has moved onto other areas of research he is unlikely to be in a good position to enter into correspondence over some detail that he worked on 18 months previously. Perhaps it is time for some of these journals to spawn new editions concentrating more exclusively on the reporting of research in error estimation.
2National
Agency for Finite Element Methods & Standards, Dept. of Trade & Industry, National Engineering Laboratory, East Kilbride, Glasgow, G75 0QU U.K..
42
Chapter 1 The research reported in this thesis is directed towards the investigation and development of effective error estimators. This work will begin with a review of the effect that element distortion can have on the performance of a single element. The recently proposed Continuum Region Element Method [ROB 89a] will be used for this purpose. This method has not yet been used for extensive testing of elements and the work carried out in this area is aimed at filling this gap. Results from a method proposed by Barlow [BAR 90a] in which the extreme capabilities of an element can be identified will also be reported. Although having been applied to the eight-noded element the author is unaware of any published results detailing Barlow's Method applied to the four-noded element under consideration in this thesis. As such the reporting of results for this element represents new work. Through the investigation of the shape sensitivity of elements an understanding of the way in which the single element performs and of how to quantify its performance is established.
The a posteriori estimation of errors through the construct of an estimated stress field will then be considered. At this point a slight deviation from the approach traditionally used in the literature will be made. This deviation takes the form of re-defining the error quantities in terms of strain energies rather than the energy norms used almost universally in the literature. The reason for this deviation is that whilst the concept of strain energy as a familiar and understandable quantity has a long and established history with practising engineers, this is not the case with the energy norm which is more favoured by mathematicians.
For
reasons discussed previously a
series of benchmark tests will then be laid down. For a series of benchmark tests to be useful they must encompass all the characteristics that one is liable to come across in real, practical finite element analysis. Thus, for example, whilst considering problems for which the true solution is smooth
43
Chapter 1 one must also examine problems involving stress concentrations and even singularities in stress.
The error estimator used in the ANSYS suite of finite element software is then used to lay down a set of sample results for these benchmark tests. Through an examination of this error estimator and its deficiencies a number of variations on the ANSYS theme are investigated and reported. The feasibility and effect of applying known static boundary conditions to the estimated stress field is then examined. The superconvergent patch recovery scheme of Zienkiewicz and Zhu [ZIE 92a] is examined and through the identification of a serious dependency on the choice of co-ordinate system reported by Sbresny [SBR 93] an improved scheme is proposed and evaluated. Although the primary objective of these studies is to lay down a set of sample results for comparison with later work, the reporting of such results represents new work and the modifications proposed in order to overcome the deficiencies observed in the ANSYS and Zienkiewicz and Zhu error estimators represents new and original work.
A new error estimator is then proposed which makes use of elementwise statically admissible stress fields. Unlike those discussed in Section 1.32 above, for which a statically admissible stress field for the whole model is obtained, the concept of local, element by element, statical admissibility is investigated here.
The statically admissible estimated stress field is
obtained by fitting it to the original finite element stress field.
The
performance of this error estimator is examined and compared with those already discussed. A number of variations on this theme is then examined. The variations investigated being the replacement in the fitting process of the original finite element stress field with other 'processed' finite element stress fields.
44
Chapter 1 As a result of the fact that equilibrium is only considered at the element level, the estimated stress field for the error estimators being proposed, whilst satisfying equilibrium at the element level, do not satisfy interelement equilibrium or equilibrium on the static boundary. In order to attempt to build a fully equilibrating estimated stress field an iterative method is proposed and examined.
Throughout this thesis it has been the aim of the author to present this research in the most physically meaningful way possible. To this end many illustrative examples of interesting phenomena are given.
The finite
element programs, error estimation routines and associated graphic routines were written by the author in FORTRAN and are available, through request, from the author.
45
CHAPTER 2 SHAPE SENSITIVITY OF SINGLE ELEMENTS
Summary The CRE-Method of [ROB 89a] is applied to the standard four-noded Lagrangian quadrilateral membrane element. In this method the performance of the element is evaluated by testing its response to boundary loadings (displacements or tractions) that are consistent with known statically and kinematically admissible stress fields. The error stress field, which is simply the difference between the known applied stress field and the finite element stress field, is quantified as a ratio of strain energy quantities. This so-called error ratio is shape dependent and the nature of the relationship between the error ratio and the element shape is investigated. In addition to being sensitive to shape, the error ratio is also dependent on the applied stress field. This dependence on the applied stress field means that one cannot predict, a priori, how an element is going to perform. In [BAR 90a] Barlow proposed a method whereby, for a given span of applied stress fields, bounds could be placed on the error ratio. This method is applied to the element being studied and the results are discussed.
2.1 Introduction For the four-noded quadrilateral element, eight nodal co-ordinates define its shape, size, position and orientation in two-dimensional space. These eight nodal co-ordinates may be combined in many ways to form new sets of parameters that define the element. Some combinations have more physical meaning than others and in [ROB 87] Robinson defines the shape of an element in terms of four parameters known as the shape parameters for an element.
These shape parameters have direct physical meanings. The
remaining four parameters define the size, position and orientation of the element.
In the isoparametric formulation the four-noded element has a bi-linear displacement field described by eight components of nodal displacements. A bi-linear field contains all polynomial terms required for a complete linear polynomial but is incomplete in the quadratic polynomial terms. As such 46
Chapter 2 the element can model all constant and linear displacement fields without error. In terms of stress fields this means that the element can model all constant stress fields exactly. The ability of this element to model constant stress fields exactly is independent of its shape. This property is required for satisfactory convergence of finite element results as a mesh is refined [IRO 72]. For stress fields other than constant ones the element can only model them approximately and the nature of this approximation is dependent on the element's shape.
The way in which the element performs in stress fields other than the constant ones is, therefore, of interest to the practising finite element analyst where the adage of 'knowing ones element' should clearly apply. The testing of single elements, see [ROB 90] for example, or patches of elements [IRO 72] has become an acknowledged method of evaluating an element. In the patch test a single element or patch of elements is loaded with boundary loadings (displacements or tractions) consistent with a known stress field.
The performance of the element(s) may thus be
monitored.
In [ROB 89a] Robinson outlines the CRE-Method of single element testing. This method provides a systematic approach to the single element test. In this chapter, the CRE-Method is applied to the four-noded Lagrangian displacement membrane. Of the many membrane elements that could have been chosen for this study, this particular element was chosen because of its popularity in use and its simplicity in formulation.
The performance of the element is examined for the linear statically and kinematically admissible stress fields which satisfy the homogeneous equations of equilibrium. The choice of linear stress fields was made for the reason that after the constant stress fields, it is predominantly the elements 47
Chapter 2 response to the linear stress fields that affects the rate of convergence [BAR 90a].
The error in an element is detected in the form of an error
displacement or stress field.
Such distributions provide exact pointwise
information regarding the error. However, so much information is often difficult to handle and interpret and, as such, a single number which characterises the error in an element is used.
This single number is
obtained in the form of a ratio of strain energy quantities and is termed the error ratio.
The way this error ratio varies with element shape is
investigated.
Since, at the pre-processing stage of an analysis one has little or no idea of the actual stress field over a particular element, it is of interest to establish upper and lower bounds on the error ratio. A method proposed by Barlow [BAR 90a] is employed here and, for a given element in a given span of test fields, bounds are established. The utility of this knowledge is discussed.
The main body of work contained in this chapter is based on concepts laid down by Robinson and by Barlow. Although the CRE-Method has been used with the four-noded Lagrangian quadrilateral membrane element, extensive testing has not been performed and, therefore, general conclusions have not been made regarding this type of testing. The work of this chapter is aimed at filling this gap. In [BAR 90a], Barlow applies his method to the eightnoded serendipity quadrilateral membrane element.
This method is
extended to the element under investigation in this chapter.
2.2 Statement of the equations of membrane elasticity The equations of membrane elasticity necessary to the work contained in this thesis are stated in this section.
48
Chapter 2 The principle of virtual work states that: T
∫ {σ } {ε } dV = ∫ {b} {u} dV + ∫ {t} {u} dS T
V
T
V
(2.1)
S
where {u} = u, v are the displacements which form a compatible set with T
the strains {ε } = ε x , ε y , γ xy such that: T
∂ ∂x {ε } = [∂ ]{u} where [∂ ] = 0 ∂ ∂y
0 ∂ ∂y ∂ ∂x
(2.2)
The stresses {σ } = σ x , σ y ,τ xy form an equilibrium set with the boundary T
tractions {t} = tn , tt
T
(t n is the traction normal to the surface and t t the
traction tangential to the surface) and the body forces {b} = bx , by such that: T
[∂ ]T {σ } + {b} = {0}
(2.3)
Note that the standard sign conventions for stress, traction and body force quantities are used (see, for example, [ROB 88]).
The boundary tractions {t } are related to the stresses {σ } through the matrix T such that:
cos 2 θ − sin θ cosθ
{t} = [T ]{σ } where [T] =
sin 2 θ sin θ cosθ
2 sin θ cos θ cos 2 θ − sin 2 θ
(2.4)
where θ is the angle a unit vector normal to the surface makes with the global co-ordinate system. All angles discussed in this thesis are measured positive according to the right hand screw convention. 49
Chapter 2
The stresses are related to the strains through the constitutive relations:
{σ } = [D]{ε }
{ε } = [D ]−1{σ }
or
where, for plane stress, the matrices D and D Young's Modulus 1 [D] = E 2 ν 1− v 0
−1
(2.5)
are given in terms of
E and Poisson's Ratio ν as: ν 0 1 1 −1 1 0 [D] = − ν E 1 −ν 0 0 2
−ν 1 0
0 2(1 + ν ) 0
The strain energy U over a given volume V is:
U=
T 1 { } {ε } dV σ 2 V∫
(2.6)
The displacements {u} in the global co-ordinate system transform into the displacements
{uˆ},
in a local co-ordinate system, through the following
relationship:
{u} = [R1 ]{uˆ}
{uˆ} = [R1 ]−1{u} (2.7)
where, for a local co-ordinate system rotated an angle α from the global coordinate system, the matrices R1 and R1
[R1 ] =
cos α
sin α
− sin α cos α
−1
are:
[R1 ]−1 =
cos α
− sin α
sin α cos α
The stresses {σ } in the global co-ordinate system transform into the stresses
{σˆ }, in a local co-ordinate system, through the following relationship: 50
Chapter 2
{σˆ } = [R2 ]{σ } cos 2 α where [R 2 ] = sin 2 α 1 − 2 sin 2α
{σ } = [R2 ]−1{σˆ } sin 2 α cos 2 α 1 sin 2α 2
(2.8)
sin 2α − sin 2α cos 2α
2.3 Shape parameters for the membrane element Figure 2.1 shows a four-noded quadrilateral element in a global Cartesian co-ordinate system (X,Y) and its associated element Cartesian co-ordinate system (x,y) and curvilinear co-ordinate system ( ξ , η) .
Y y 4 3
x,
Yc 2
Y1
1
X X1
Xc
Figure 2.1 Element co-ordinate systems
The element axes are defined such that: i) The origin of both element co-ordinate systems {X c } is at the centre of gravity of unit masses placed at each node of the element i.e. 4 {X c } = 1 ∑ {X i } where {X i } are the co-ordinates of node i . This origin is 4 i =1 called the isoparametric centre of the element. 51
Chapter 2
ii) The element x-axis is directed towards, and passes through the centre of edge 2-3. The ξ - axis is coincident with the x-axis. iii) The element y-axis is orthogonal to the x-axis. iv) The η - axis is directed towards, and passes through the centre of edge 3-4.
In contrast to the standard isoparametric mapping for this element where the element Cartesian co-ordinates are expressed as a sum of the products of the element shape functions and the nodal co-ordinates, see for example [ZIE 89], Robinson [ROB 87] writes the shape of the element in the element co-ordinate system as: x e1 e2 = y f1 f 2
e3 f3
1 e4 ξ f 4 η ξη
(2.9)
For the chosen axis system, e1 = f1 = f 2 = 0 and the remaining coefficients are: 1 ( − x1 + x 2 + x 3 − x 4 ) 4 1 = ( − x1 − x 2 + x 3 + x 4 ) 4 1 = ( + x1 − x 2 + x 3 − x 4 ) 4 1 = ( − y1 − y 2 + y3 + y 4 ) 4 1 = ( + y1 − y2 + y3 − y 4 ) 4
e2 = e3 e4 f3 f4
where x i and yi
(2.10)
are the co-ordinates of node i in the element Cartesian
system.
Thus five independent parameters define the shape of an element. These are termed the shape parameters for an element. In [ROB 87] Robinson
52
Chapter 2 proposes a new set of shape parameters which have a different and more direct geometric meaning. These new shape parameters are defined as:
Aspect Ratio
for e2 > f 3 , AR =
( AR )
for
e2 < f 3 , AR =
e2 f3 f3 e2
Skew ( S )
S =
e3 f3
Taper in x - direction ( T x )
Tx =
f4 f3
Taper in y - direction ( T y )
Ty =
e4 e2
(2. 11)
a = f3
Size ( a )
and are shown in Figure 2.2. y
y e2
e3 f3
f3 x
(a) Aspect ratio
x
(b) Skew y
y
e4
f4
x
x f3 e2 (c) Taper in x-direction
(d) Taper in y-direction
Figure 2.2 Shape parameters for the four-noded quadrilateral The extreme values of the shape parameters are limited by physical and computational considerations. For the taper parameters, Tx and Ty , as the value approaches unity the element degenerates from a quadrilateral to a triangle as shown for Tx in Figure 2.3b.
As the taper increases beyond
53
Chapter 2 unity, the element becomes a non-convex figure1 as shown in Figure 2.3c. The convexity parameter defined in [ROB 87] may be used to detect such element shapes. Apart from any computational problems such a situation might incur, there is no physical justification for allowing such an element shape and the values of these parameters are therefore limited to those given in Equation 2.13. 3 y
y
y
3
3 1 4 x
1
4
x
1
x 4
2 2 2
(a) Tx < 1
(b) Tx = 1
(c) Tx > 1
Figure 2.3 Degeneration of element shape as taper ( Tx ) is increased
In contrast, no physical limitation is placed on the values of the aspect ratio and skew parameters AR and S.
However, as these shape parameters
become large, the relative magnitude of stiffness coefficients in the element stiffness matrix k (see Equation 2.18) changes and as the element becomes increasingly distorted the stiffness matrix becomes ill-conditioned. This effect is quantified with the condition number ψ for the matrix which is defined in [PRE 89] as the ratio of the largest singular value ω max to the smallest singular value ω min :
ψ = ω max ω min
(2.12)
The physical significance of an ill-conditioned stiffness matrix is that the element will exhibit large differences in stiffness for different degrees of freedom. Computationally this will mean that the computed displacements
1a
convex figure is one in which a line drawn between any two points on the figure does not pass outside the boundary of the figure.
54
Chapter 2 will be unrealistically sensitive to round-off errors in the applied nodal forces.
Since the element stiffness matrix is singular with rank ρ k = 5 , there will always be three zero singular values irrespective of the level of distortion. The definition of the condition number is therefore modified such that ω min is taken as the smallest non-zero singular value. As the condition number tends to infinity the rank of the stiffness matrix is further reduced to
ρ k = 4 and if the condition number is large but finite the matrix is illconditioned.
The variations of condition number with aspect ratio
( S = Tx = Ty = 0 ) and skew ( AR = 1, Tx = Ty = 0 ) are shown in Figure 2.4.
Figure 2.4 Variation of ψ with shape parameters AR & S For the investigations undertaken in this chapter, the values of the aspect ratio and the skew parameters will be limited to those shown in Equation 2.13. These values are consistent with those used in commercial finite element software and, as can be seen from Figure 2.4, correspond to sensible condition numbers for the element stiffness matrix i.e. ψ AR = 5 = 27. 8, and ψ S =1 = 7. 8 to one decimal place.
1 ≤ AR ≤ 5,
− 1 ≤ S ≤ 1,
− 1 < Tx < 1,
− 1 < Ty < 1
(2.13)
In this text the distinction will be made between parallelogram elements and tapered elements. A parallelogram element has zero taper ( Tx = Ty = 0 ) and, as such, the transformation between the curvilinear co-ordinate system
55
Chapter 2 ( ξ , η) and the element Cartesian co-ordinate system (x,y) (see Equation 2.9)
is linear. In contrast, for tapered elements ( Tx ≠ 0 and / or Ty ≠ 0 ) this transformation is non-linear.
The nature of the transformation between
element co-ordinate systems has implications regarding the nature of the finite element stress field {σ h }. For parallelogram elements {σ h } is linear (or constant) whilst for tapered elements it becomes a rational function of two polynomials. This means that the nature of the stress field that can be modelled by an element is dependent upon whether it is tapered or not. With respect to this distinction between parallelogram and tapered elements, it should be noted that as a distorted mesh is refined, the magnitudes of the taper parameters decrease such that in the limit, as hmax → 0 (h is a characteristic length of an element and hmax is the largest
value of h for the mesh), all elements become parallelograms. This idea has been discussed by Barlow [BAR 87] and is demonstrated here for a rectangular continuum. Figure 2.5 shows how the magnitude of the shape parameters vary with increasing mesh refinement. Mesh 1 consists of four distorted elements and meshes 2, 3 and 4 are simply uniform refinements of this mesh. It is observed that whilst the aspect ratio and skew parameters can actually increase in certain areas of the mesh, the taper parameters decrease uniformly throughout the mesh as the mesh is refined.
56
Chapter 2
57
Chapter 2 2.4 Finite element formulation for a single element For the four-noded Lagrangian quadrilateral membrane element a bi-linear finite element displacement field {uh } 2, in terms of ξ , η , is assumed:
{u} ≈ {u h } = [N ]{δ }
(2.14)
(2x8)
where {δ } are the nodal displacements in the element Cartesian co-ordinate system and N is the matrix of shape functions such that:
[N ] =
N1 0 N 2
0 N3
0 N1 0 N 2
0 0 N 4
0 N4
0 N3
where: (2.15) 1 N1 = (1 − ξ )(1 − η ) 4 1 N 2 = (1 + ξ )(1 − η ) 4 1 N 3 = (1 + ξ )(1 + η ) 4 1 N 4 = (1 − ξ )(1 + η ) 4
The finite element strains {ε h } are given as:
{ε h } = [∂ ]{uh } = [∂ ][N ]{δ } = [B ]{δ }
(2.16)
(3x8)
and the corresponding stresses {σ h } as:
2the
subscript h will be used to denote finite element quantities.
58
Chapter 2
{σ h } = [D]{ε h } = [D][B ]{δ } = [C ]{δ } The nodal forces
{q}
(2.17)
corresponding to the nodal displacements {δ } are
obtained through the stiffness matrix k for the element:
{q} = [k ]{δ }
(2.18)
(8x8)
where [k ] = ∫ [B] [D ][B ]dV . T
V
The stiffness relation of Equation 2.18 can be derived in a number of ways as shown in, for example, [ZIE 89]. However, for the purpose of this work it is illuminating to do so through a consideration of the error stress field which is defined as the difference between the true stress field and the finite element stress field:
{σ e } = {σ }− {σ h }
(2.19)
The strain energy of the error, or simply the error energy is:
Ue =
T 1 { } {ε e }dV σ e 2 V∫
(2.20)
The error energy may also be written as:
Ue =
T T T 1 {ε } {σ }dV − ∫ {ε h } {σ }dV + 1 ∫ {δ } [B]T [D][B]{δ }dV ∫ 2V 2V V
(2.21)
59
Chapter 2 From the principle of virtual displacements3 (PVD) and in the absence of body forces
T
∫ {ε } {σ }dV = ∫ {δ } [N ] {t}dS T
T
h
V
and recognising the third term of
S
Equation 2.21 as
1 T {δ } [k ]{δ } we have: 2
Ue =
1 {ε }T {σ }dV − {δ }T ∫ [N ]T {t}dS + 1 {δ }T [k ]{δ } ∫ 2V 2 S
(2.22)
Minimising the error energy U e with respect to the nodal displacements {δ } requires:
∂U e = ∂ {δ }
∂
1 {σ e }T [D]−1{σ e }dV ∫ 2V
∂ {δ }
= {0}
(2.23)
and this results in:
∫ [N ] {t}dS = [k ]{δ } T
(2.24)
S
Comparing Equation 2.24 with Equation 2.18 shows that:
{q} = ∫ [N ]T {t}dS
(2.25)
S
This equation defines the nodal forces {q} in terms of the true tractions {t } . Nodal forces derived in such a manner are termed consistent nodal forces. In this derivation it is shown that provided consistent nodal forces are used, the corresponding nodal displacements are those that minimise the error energy.
3the
principle of virtual displacements states that
∫ {σ } {ε }dV = ∫ {t} {u }dS + ∫ {b} {u }dV T
T
h
V
and
T
h
S
h
where
{σ }, {t} and {b} form an equilibrium set
V
{uh }and {ε h } are an arbitrary but compatible set. 60
Chapter 2 In the global Cartesian co-ordinate system, the nodal displacements and
{∆}and {Q} respectively.
corresponding nodal forces are
The stiffness matrix
K relates these quantities as:
{Q} = [K ]{∆} [R1 ] [0] [0] [0] [R ] [0] T 1 where [K ] = [R1 ] [k ][R1 ], [R1 ] = [0] [0] [R1 ] [0] [0] [0]
(2.26)
[0] [0] [0] [R1 ]
and R 1 is defined in
Equation 2.8. 2.5 Continuum region test fields The CRE-Method requires statically and kinematically admissible stress fields4 to be defined over a continuum region.
The continuum region is
simply a region of two-dimensional space defined by its geometric parameters,
length ( l ) , semi-depth ( c ) , thickness ( t ) , and its elastic
material properties, Young's Modulus ( E ) and Poisson's Ratio ( ν ) , as shown in Figure 2.6. Y,v c X,u c
L
Constraint u=0
Constraint v=0
Figure 2.6 Continuum region The finite element stress field of Equation 2.17 is defined in terms of eight nodal displacements. For an element properly restrained against rigid body motion, only five of these nodal displacements are independent. As such, the element can model five independent stress fields. Three of these stress fields are the constant ones as required for convergence and are independent
4a
statically admissible stress field is one which is in equilibrium with a given set of body forces i.e. it satisfies the equations of equilibrium Equation 2.3. A kinematically admissible stress field is one whose corresponding strains are compatible.
61
Chapter 2 of element shape.
The two remaining stress fields are not statically
admissible with zero body forces (see Appendix 1 for a proof of this for the rectangular element) and are dependent on element shape. The constant stress fields can always be modelled exactly by the element irrespective of its shape. However, the element will only model the linear stress fields approximately and the nature of this approximation will be shape dependent.
This approximation leads to the errors which are to be
examined in this chapter.
Although one could consider stress fields of
higher degree than linear, it has been noted by Barlow [BAR 90a], for the eight-noded membrane element, that it is the linear stress fields that 'are most important as the rate of convergence is determined primarily by the response to linear stresses.' This is also the case for the four-noded element considered in this chapter and for this reason polynomial stress fields spanning the complete constant and linear stress fields will be considered.
There are nine independent constant and linear stress fields. For static admissibility the two equations of equilibrium, Equation 2.3, must be satisfied and this requirement reduces the number of independent stress fields to seven of which four are linear. For the studies conducted in this chapter, cases where the body forces {b} = {0} are considered. Since all linear stress fields are automatically kinematically admissible, no additional constraints need to be applied.
The displacement fields corresponding to these stress fields are unique to within a rigid body motion. It is convenient to define the corresponding displacement fields such as to satisfy the three planar rigid body constraints shown in Figure 2.6:
62
Chapter 2 X =0 = 0 u Y = ±c (2.27)
X =0 = 0 v Y = −c
The statically and kinematically admissible stress fields are defined by:
{σ } = [h]{ f }
(2.28)
(3x7)
where { f } is a vector of test field amplitudes and the matrix h contains the modes of admissible stress:
constant
linear
L 0 (X − ) 0 1 0 0 Y 2 [h] = 0 1 0 0 ( X − L ) 0 Y 2 L 0 0 1 0 0 −Y − ( X − ) 2
(2.29)
The first three stress fields ( f1 , f 2 & f3 ) are the constant ones. The stress fields corresponding to f 4 and f 5 are those that would be observed in a beam under pure bending and are thus termed the constant moment stress fields [ROB 79]. The stress fields corresponding to f 6 and f 7 are termed the linear endload stress fields [ROB 90]. The boundary tractions resulting from a constant moment and linear endload stress field are shown in Chapter 3, Figures 3.4a and 3.3a respectively. The displacements {u} corresponding to these stresses are:
{u} = [ p ]{ f }
(2.30)
(2x7)
63
Chapter 2
where
{f }
is the same vector of test field amplitudes, and the matrix p
contains the modes of corresponding displacement: constant stress
[ p] =
1 [{p1}, 2E
linear stress
{p2 }, {p3 }, {p4 }, {p5 }, {p6 }, {p7 }]
where
(2.31)
{p1} =
, − 2ν (c + Y )
{p4 } =
{p2 } =
− 2νX , 2(c + Y )
2X
{p3 } =
4(1 + ν ) X
, 2 2 2 − X + ν ( c − Y )
0
− LX ) + (c 2 − Y 2 ) (2 X − L)Y − Lc
{ p5 } = − ν ( X
2 XY
X ( X − L) + (2 + ν )(c 2 − Y 2 ) { p6 } = , ν ((−2 X + L)Y + Lc)
{p7 } =
2
2(1 + ν ) LX − (2 + ν ) X − (c − Y ) − 2νXY
2
2
2
2.6 The CRE-Method with applied nodal displacements In the CRE-Method proposed by Robinson, the element, with its associated shape parameters, is placed into a continuum region as shown in Figure 2.7.
Y y
Y0
X
x
X0 Figure 2.7 Element within continuum region The position and orientation of the element within the continuum region is defined by two position parameters X 0 , Y0 (defining the isoparametric centre 64
Chapter 2 of the element) and an orientation parameter θ as shown. Collectively, these parameters will be called the configuration parameters.
Testing of an element now proceeds in the following manner. For a chosen test field
{ f },
the nodal displacements
{∆T } 5
are evaluated using an
augmented form of Equation 2.30:
{∆T } = [ p ]{ f }
(2.32)
(8x7)
where p =
p
T 1
, p
T 2
, p
T 3
, p
T 4
T
and p i is the matrix p evaluated at node i.
These nodal displacements are applied to the element and the corresponding nodal forces {Q∆ } are evaluated through Equation 2.26.
An error ratio e ∆ is defined in [ROB 89a] as a ratio of the true strain energy
U over the volume of the element to the finite element strain energy U ∆ over the same volume:
e∆ =
U U∆
(2.33)
This error ratio is a single number which characterises the error in the elements response to a given test field.
The true strain energy is6:
5the
subscript T indicates that the nodal displacements are the true ones. Finite element quantities resulting from applied nodal displacements will now be denoted with a ∆ rather than the h subscript used thus far. 6the matrix A is known as the natural flexibility matrix [ROB 88].
65
Chapter 2 U=
1 { f }T [A]{ f } where [A] = ∫ [h]T [D]−1[h] dV 2 V
(2.34)
(7x7)
and the finite element strain energy is:
U∆ =
1 { f }T [A∆ ]{ f } where [A∆ ] = [ p ]T [K ][ p ] 2
(2.35)
(7x7)
In order to integrate Equations 2.34 & 2.35 over an arbitrary quadrilateral area, a numerical integration scheme (NIS) is used.
A discussion of the
numerical integration schemes used in this thesis is given in Section 2.7.
The error ratio is thus a function of all the parameters thus far defined:
5
Shape parameters
3
Configuration parameters
7
Test field parameters
There is a linkage, or coupling between the stress states and the configuration parameters. stress field defined by
For example, consider the constant moment
{ f } = 0,0,0M1,0,0,0T
and the position parameter Y0 as
shown in Figure 2.8.
66
Chapter 2 Element B Y
Y0 X
Element A
Figure 2.8 Variation of boundary tractions with Y0
For Element A with Y0 = 0 the boundary tractions are purely linear. In contrast, Element B is positioned such that Y0 ≠ 0 and, therefore, is subject to combined, constant and linear, tractions. The tractions on Element B can be uncoupled into constant and linear components as shown in Figure 2.9.
Figure 2.9 Uncoupling the boundary tractions for Element B
As Y0 is increased, the constant component of the tractions becomes increasingly significant and will tend to dominate.
It is shown that
although the test field being applied is purely linear, by adjusting the configuration parameters components of other stress fields can be applied to an element.
Similar arguments apply for the other configuration
parameters X 0 and θ . In order to uncouple the effect of the configuration parameters on the applied test field, they shall be kept constant as shown in Table 2.1. Configuration parameter
Value
X0
L 2
Y0
0
θ
0
Table 2.1 Configuration parameters used for all tests 67
Chapter 2 Since the element under consideration can model all constant stress states exactly irrespective of its shape, it need not be tested under conditions of constant stress.
2.7 Numerical integration schemes For the work contained in this thesis a number of numerical integration schemes will be used and are defined in this section. Two basic types of numerical integration scheme will be considered. Nodal quadrature is a cheap and crude integration scheme in which the integrand need only be evaluated at the nodes of an element. Gauss quadrature, on the other hand, is a more sophisticated scheme and can provide a much higher degree of accuracy than that achieved by nodal quadrature. However, in order to achieve this higher degree of accuracy many more evaluations of the integrand at the so-called Gauss points are required.
Nodal quadrature approximates the integration of the true strain energy (for example) as: U=
1 1 Vol 4 T { } { } {σ }Ti {ε }i σ ε dV ≈ ∑ ∫ 2V 2 4 i =1
(2.36)
where Vol is the volume of the element and the summation is taken over all nodes i.
This integration scheme will be discussed in more detail in Chapter 4 (§4.4).
Gauss quadrature approximates the same integral as:
U=
1 t n n T { } { } σ ε dV ≈ ωiω j {σ }Ti , j {ε }i , j det[J ]i , j ∑∑ ∫ 2V 2 i =1 j =1
(2.37)
68
Chapter 2 where ω is a weighting factor, det J
is the determinant of the Jacobian
matrix and the summation is taken over all n × n Gauss points.
The
Jacobian matrix is defined as: ∂x [J ] = ∂ξ ∂x ∂η
∂y ∂ξ ∂y ∂η
(2.38)
where the x and y functions are taken from Equation 2.9.
Gauss quadrature requires evaluation of the integrand at the n × n Gauss points.
The curvilinear co-ordinates of these points, together with the
corresponding weighting factors ω for the n × n Gauss points are available in many standard texts, for example in [ROB 88]. It is useful to note that these co-ordinates and weighting factors can also be obtained, to full machine precision, from a program given in [PRE 89].
An nxn Gauss quadrature scheme integrates a polynomial of degree d = 2 n − 1 exactly.
In order to establish which nxn Gauss scheme is
required for the integrations of Equation 2.34 and Equation 2.35 it is necessary to determine the nature of the function to be integrated.
For Equation 2.34, the integrand is a cubic polynomial irrespective of the element shape. As such, a 2x2 point Gauss scheme is sufficient to integrate the true strain energy exactly.
For the finite element strain energy of Equation 2.35, components of J
−1
are contained in the integrand. As such, the integrand will be a rational polynomial function with det J in the denominator. For a parallelogram element ( Tx = Ty = 0 ), det J
is a constant and 2x2 Gauss quadrature is
sufficient to integrate Equation 2.35 exactly. When the element is tapered, 69
Chapter 2 however, det J is a linear function and, as such, Gauss quadrature cannot integrate Equation 2.35 exactly.
The choice of integration scheme was
based on experience gained through a convergence test in which the finite element strain energy for different Gauss quadrature schemes was monitored. Table 2.2 shows the true strain energy and the finite element strain energy for various Gauss quadrature schemes.
The element was
distorted with AR = 1, S = 0 , Tx = 0 . 9, Ty = 0 and a = 1m where a is the element size (see Equation 2.11). This element was placed in the centre of the standard continuum (see Figure 2.11) with θ = 0 and the material properties E = 210 N m 2 and ν = 0 . 3 were used. A material thickness of t = 0 .1m was used, the test field was
{ f } = 0,0,0M100,0,0,0T
and the element
was loaded with applied nodal displacements. Gauss scheme
U
Uh
It should be noted with respect to
1x1
0
1.4538
Table 2.2 that since the element
2x2
5.7460
1.6867
cannot recover the stress field
3x3
"
1.7317
corresponding to the applied
4x4
"
1.7506
loading exactly then U h does not
5x5
"
1.7584
10x10
''
1.7636
converge to U .
Table 2.2 Convergence of strain energies with Gauss scheme
The finite element strain energy is plotted for the various integration schemes in Figure 2.10. The results of Table 2.2 confirm that a 2x2 scheme is sufficient to exactly integrate the true strain energy. From Table 2.2 and Figure 2.10 it is seen that U h converges as the order of the Gauss quadrature scheme is increased. For this example 5x5 Gauss quadrature gives U h to three significant figures. A 5x5 Gauss quadrature scheme has been used by other workers in the field, for example [BAR 90a], and will be deemed sufficiently accurate for the purposes of this work.
70
Chapter 2
Figure 2.10 Convergence of U h with integration scheme The three numerical integration schemes that will be used in this thesis are given in Table 2.3. NIS1
Nodal quadrature
NIS2
2x2 Gauss quadrature
NIS3
5x5 Gauss quadrature
Table 2.3 Numerical integration schemes
2.8 A series of tests using the CRE-Method With the configuration parameters fixed and the elimination of the need to test the element under conditions of constant stress, it remains to examine the shape sensitivity of the element to the linear stress fields. For reasons of symmetry it is sufficient to vary the shape parameters as
1 ≤ AR ≤ 5, 0 ≤ S ≤ 1, 0 ≤ Tx < 1, 0 ≤ Ty < 1
(2.39)
Table 2.4 details the tests required to cover all possible permutations.
71
Chapter 2
Test
1
2
3
4
5
6
7
8
9
10
11
12
13
14
15
16
AR S Tx Ty
V
V
V
V
1
1
1
1
1
1
1
1
1
1
1
1
0
0
0
0
V
V
V
V
0
0
0
0
0
0
0
0
0
0
0
0
0
0
0
0
V
V
V
V
0
0
0
0
0
0
0
0
0
0
0
0
0
0
0
0
V
V
V
V
a f4 f5
1
1
1
1
1
1
1
1
1
1
1
1
1
1
1
1
1
0
0
0
1
0
0
0
1
0
0
0
1
0
0
0
0
1
0
0
0
1
0
0
0
1
0
0
0
1
0
0
f6
0
0
1
0
0
0
1
0
0
0
1
0
0
0
1
0
f7
0
0
0
1
0
0
0
1
0
0
0
1
0
0
0
1
(i) V indicates the parameter to be varied during each test (Equation 2.39)
Table 2.4 Independent tests to be performed for the CRE-Method
Figure 2.11 shows the standard continuum region chosen for these tests and the square base element positioned in the centre of the continuum region and with θ = 0 .
y
Y 2m 1m
x
X 2m X 0 =5 m
L=10m
Figure 2.11 Standard continuum region and base element for tests
It is noted that the error ratio, being a ratio of two strain energies, is independent of Young's Modulus and the material thickness. It is however dependent on the value of Poisson's Ratio. The nature of this dependency can be investigated by explicitly evaluating the error ratio and this has been done for the square element of Figure 2.11 for both constant moment and linear endload stress fields (these expressions were obtained using the
72
Chapter 2 algebraic manipulation package DERIVE7 and checked with numerical results generated from another source). Table 2.5 shows the error ratio e ∆ as a function of Poisson's Ratio and the values for e ∆ with ν = 0 . 3 . e∆ = e∆ ( ν )
Constant moment f 4 & f 5 Linear endload f 6 & f 7
2
2 (1 − ν ) (3 − ν) 2 (1 − ν 2 ) ( 2 ν + 3 ) ⋅ (3 − ν) ν2
e∆ ( ν = 0. 3)
0.6741 26.9630
Table 2.5 Error ratios for the square element of Figure 2.11 The variation of error ratio e ∆ for sensible values of Poisson's Ratio is shown in Figure 2.12.
Figure 2.12 Variation of error ratio e ∆ with Poisson's Ratio From Equation 2.33 it is seen that the finite element strain energy U ∆ is a factor 1 e∆ of the true strain energy. As such, for the square element under consideration, and for a Poisson's Ratio of ν = 0 . 3 it is seen that for the constant moment stress fields U ∆ = 1. 484U , whilst for the linear endload stress fields U ∆ = 0 . 037U .
2.9 Results from the CRE-Method with applied nodal displacements In Figure 2.13 the error ratio e ∆ has been plotted against the various shape parameters and for the different test fields. Figure 2.13a shows the results for the constant moment stress fields whilst Figure 2.13b shows the results 7Soft
Warehouse, Inc. Honolulu, Hawaii, USA (Version 1.62).
73
Chapter 2 for the linear endload stress fields. Each curve represents a single test as detailed in Table 2.4 and is designated as such in the figure (e.g. the curve
T1 refers to Test 1 as defined in Table 2.4). T2 T6
(e )
(e )
(e )
T9,T14
T5 T1
T10,T13
(a) Constant moment stress fields
T12,T15 (e )
(e )
(e )
T4
T3 T8
T7
T11,T16
(b) Linear endload stress fields Figure 2.13 Results from the CRE-Method (applied nodal displacements)
With respect to the CRE-Method with applied nodal displacements a number of observations are made:
i) From the results shown in Figure 2.13 it is clear that the error ratio can be strongly shape dependent. This phenomenon is known as shape sensitivity. However, the degree of shape sensitivity is dependent on the applied test fields. For example, it can be shown that for the test field
{ f } = 0,0,0M1,1,0,0T
the error ratio is independent of aspect ratio. The
degree of shape dependence is different for the various shape parameters considered. It is also seen that the error ratio varies greatly between the different test fields: it is noted that the constant moment loadings 74
Chapter 2 ( f 4 and f 5 ) produce significantly lower error ratios than the linear endload types ( f 6 and f 7 ). This fact is evident from Figure 2.12 which shows that for sensible values of Poisson's Ratio the error ratio due to a linear endload stress field is significantly greater than that due to a constant moment stress field.
ii) When the error ratio was defined, it was tacitly assumed by Robinson [ROB 89a] that an error ratio of unity ( e ∆ = 1 ) implied that the element was modelling the applied displacement field exactly.
Clearly, if
e ∆ = 1 then U = U ∆ however, it does not necessarily follow that the element
is modelling the test field exactly i.e. that {u∆ } = {u} in a pointwise sense. This can be demonstrated by comparing the true displacement field {u} with the finite element displacement field {u∆ } for a situation where e ∆ = 1 . The element and continuum region shown in Figure 2.11 will be
used. The combined test field { f } = 0,0,0 M 0,1,0,0.3735 gives an error ratio T
of e∆ = 1. 000 to 3 decimal places. Figures 2.14a and 2.14b shows the test displacement fields in the form of surface plots.
The test displacement fields are clearly non-linear and for the base element centred in the continuum the true displacements between the nodes will be quadratic. With the type of element under investigation such a displacement field cannot be modelled exactly. In Figures 2.14c and 2.14d the finite element displacement fields are plotted above the true displacement fields.
{u h } = {u}
It is seen from these figures that although
at the nodes, the displacement fields are different elsewhere
over the element.
75
Chapter 2 This example highlights the potential danger of using integral error measures: it is possible that even though two distributions may be different, in a pointwise sense, the integrals of those distributions may be equal. In contrast to this example, if any linear combination of the constant stress fields had been applied to the element, an error ratio of unity would also have been achieved. In such cases however, since the element can model constant test fields exactly, the error ratio would be indicative of zero pointwise error. Now, even though the integrals of two different distributions may be the equal, the integral of the difference of the distributions is only equal to zero when the distributions are equal in a pointwise sense.
This latter point is the case for the error energy
which is defined later in Equation 2.42. u
v
y
y
x
x
(a) u - displacement surface y
(b) v - displacement surface y
x
x
(c) u - displacement contours
(d) v - displacement contours
Figure 2.14 Test displacement field for observation (ii) 76
Chapter 2 iii) For the case of applied nodal displacements an error ratio of e ∆ = ∞ can be achieved if U ∆ = 0 and U ≠ 0 . To obtain such an error ratio a test field that induces a rigid body motion of the element is required. Rigid body displacement fields are not contained within the span of displacement fields considered, however, as far as the element is concerned any displacement field which has displacements at the elements nodes corresponding to a rigid body motion may be considered as a rigid body motion. The displacement field of Equation 2.40 possesses two curves for which u = 0 , v = 0 . An element placed such that its nodes lie on these curves will be unstrained. u = (1 - ν )X 2 + ( ν − 1) lX + 2 ( c 2 − Y 2 ) v=0
and is given by the test field { f } = −
(2.40)
1 T 0,0,0M 0,ν ,1,0 . ν +1
The two curves for which u = 0 , v = 0 are then Y = ±
2 2
(1 − ν ) X 2 + ( ν − 1) lX + 2 c 2 .
Figure 2.15 shows the u -displacement field for the continuum region shown in Figure 2.11. In Figure 2.15a the surface plot of u is shown whilst Figure 2.15b shows the contours of u - displacement together with a possible element positioned such that its nodes lie on the curves u = 0 . u
y y
x
x
(a) Surface plot of u - displacement
(b) Contours of u - displacement
Figure 2.15 u -displacement field with zero's at the nodes of the element
77
Chapter 2 2.10 Bounds on the error ratio for applied nodal displacements8 The finite element displacements may be written as the difference between the true displacements and an error displacement field {u e } = {u}− {u ∆ } :
{u ∆ } = {u}− {ue }
(2.41)
The finite element strain energy would then be: U ∆ = U + U e − ∫ {σ } {ε e } dV T
(2.42)
V
where U e =
T 1 {σ e } {ε e } dV and {ε e } is the error strain field corresponding to ∫ 2V
{u e } . The potential energy of the finite element loads V∆ is: T
V∆ = V + ∫ {t } {ue } dS
(2.43)
S
where V is the potential energy of the true loads.
Considering the nature of the error displacement field {u e } there are three possible scenarios:
1)
{ue } = {0}
over the volume V i.e. the element conforms to the true
displacements over the volume.
This implies that the error strain {ε e }
would be zero over the volume of the element. As such, from Equation 2.42, the true strain energy is equal to the finite element strain energy and the error ratio is therefore equal to unity:
8The
author would like to make a particular acknowledgement of the help of his supervisor Dr E.A.W. Maunder in formalising these proofs on the bounds of the error ratios.
78
Chapter 2
(2.44)
e∆ = 1
2)
{ue } = {0}
over the boundary S i.e. the element conforms to the true
displacements on the boundary. This implies that the second term on the RHS of Equation 2.43 would be zero.
From the principle of virtual
displacements:
∫ {σ } {ε } dV = ∫ {t} {u } dS = 0 T
T
e
V
e
(2.45)
S
As such, Equation 2.42 reduces to U ∆ = U + U e and since U e ≥ 0 (positive definite property of strain energy quantities), it follows that U ∆ ≥ U. This puts the following bounds on the error ratio:
e∆ ≤ 1
3)
{ue } = {0}
(2.46)
only at the nodes i.e. the element conforms to the true
displacements only at the nodes. In this case, since the finite element strain energy is bounded as U ∆ ≥ 0 , and for an element of finite dimensions U > 0 , the bounds on the error ratio are:
0 < e∆ ≤ ∞
(2.47)
In general therefore for applied nodal displacements:
Ue ≠ U − U ∆
(2.48)
i.e. the energy of the error does not equal the error of the energy.
79
Chapter 2 2.11 The CRE-Method with applied nodal forces The CRE-Method as proposed by Robinson considers the case of applied nodal displacements. The dual of this approach is to load the element with applied nodal forces and this approach will now be examined.
The element is loaded by nodal forces {QT }9 that are derived in a consistent manner (§2.4, Equation 2.25): T
{QT } = ∫ [N ] [T ][h]{ f } dS = [F ]{ f }
(2.49)
S
where [F ] = ∫ [N ] [T ][h] dS . T
S (8x7)
In order to solve for the corresponding nodal displacements {∆ Q }, the three planar rigid body motions must be restrained. This is done by applying three of the known displacements {∆T } such that:
{∆ } = [p ]{ f } *
T
(2.50)
(3x7)
where the three rows of p * are contained in p .
The nodal reactions corresponding to {∆T } are {R}.
Having prescribed sufficient displacements it is now possible to solve Equation 2.26 for the remaining displacements {∆Q }:
R K11 = QT K 21
K12 ∆T K 22 ∆Q
(2.51)
where {QT } are the nodal forces corresponding to {∆Q } and can be written as:
{Q } = [F ]{ f } *
T
(2.52)
(5x7)
9the
subscript T indicates that the nodal forces have been derived in a consistent manner from the true tractions. Finite element quantities resulting from applied nodal forces will now be denoted with a Q subscript.
80
Chapter 2
where the five rows of F * are contained in F .
Solving Equation 2.51 for {∆Q } gives:
{∆ } = [K ] {[F ]− [K ][p ]}{ f } = [S ]{ f } −1
Q
*
*
22
21
(5x5)
(5x3)
(2.53)
(5x7)
hence:
{∆ }= ∆∆ Q
[ ]
p* = { f } = [G ]{ f } Q [S ] T
(2.54)
(8x7)
The finite element strain energy due to applied nodal forces is then:
UQ =
1 {QT }T {∆Q } = 1 { f }T [G ]T [K ][G ]{ f } = 1 { f }T AQ { f } 2 2 2
[ ]
(2.55) (7x7)
For the case of applied nodal forces, the error ratio eQ will be defined as:
eQ =
UQ U
(2.56)
This definition is the inverse of that used for applied nodal displacements in that the finite element strain energy is now in the numerator. The reason for this is that it will be shown (§2.13) that with this definition the bounds on the error ratio lie between zero and unity. 2.12 Results from the CRE-Method with applied nodal forces The same series of tests that were carried out for the case of applied nodal displacements is also performed for the case of applied nodal forces and the results are shown in Figure 2.16.
With respect to the CRE-Method with applied nodal forces a number of observations are made: 81
Chapter 2
(i) It is seen that the bounds on the error ratio eQ appear to be different from those on e ∆ , the error ratio eQ varies widely with shape parameter and test field. In general the curves of eQ are different to the corresponding curves of e ∆ . However, it is seen by comparing Figure 2.16 with Figure 2.13a that
the curves T 1 and T 2 are identical. This means that for the rectangular element in a constant moment stress field the error ratios are identical i.e. e ∆ = eQ . A proof of this equality is given in Appendix 2.
T4
T10,T13
(eQ )
(eQ )
(eQ )
T2 T5
T9, T14 T7 T8
T12,T15 T11,T16
T1 T6
T3
Figure 2.16 Results from the CRE-Method (applied nodal forces) (ii) From Figure 2.16 it is seen that the error ratio eQ never exceeds unity. Proof that this is always the case is given in the following section (§2.13) where the bounds on the error ratio are formally established.
(iii) An error ratio of eQ = 0 can be obtained if the consistent nodal forces for the element are identically zero.
Figure 2.17 shows a square element
centred in the standard test continuum and rotated at an angle of θ =
Y
y
π 4
.
x
X
Figure 2.17 Square element rotated in continuum 82
Chapter 2
For a test field of
{ f } = 0,0,0 M1,0,0,0T
the boundary tractions for a square
element of side length L and thickness t are shown in Figure 2.18 (note, in this figure S = BLt 3 ).
Tractions Tangential to Surface
B
s
s
s
s
2
2
Consistent Nodal Loads
B
Distributions
Tractions Normal to Surface
Figure 2.18 Boundary tractions and corresponding consistent loads
The consistent nodal forces corresponding to the normal and tangential tractions have been drawn and it is seen that the net nodal forces resulting from both normal and tangential tractions are zero i.e. {QT } = {0} . 2.13 Bounds on the error ratio for applied nodal forces The total potential of the true solution is given as:
Π =U +V
(2.57)
For the finite element the total potential is:
83
Chapter 2
(2.58)
Π Q = U Q + VQ
From the principle of virtual displacements: T
T
V = − ∫ {t } {u} dS = − ∫ {σ } {ε } dV = −2U S
(2.59)
V
and10: VQ = − ∫ {t } {u Q }dS = − ∫ {σ } {ε Q }dV = −2U Q T
T
S
(2.60)
V
hence Π = − U and Π Q = − U Q and, since Π Q ≥ Π , U Q ≤ U . In terms of the error ratio this means that eQ ≤ 1 also, since U Q ≥ 0 , it is clear that the error ratio is bounded as: (2.61)
0 ≤ eQ ≤ 1
For the case when eQ = 1 the finite element strain energy is equal to the true strain energy and in the case of applied (consistent) nodal forces it will be shown that this implies a strong, pointwise, equality between the finite element stress field and the true one. That this is the case can be proved by arguing the counter-case (reductio ad absurdum). Let us assume that for eQ = 1 the two stress fields are not equal and that an error stress field {σ e }
exists:
{σ e } = {σ }− {σ Q }
(2.62)
The strain energy of this error stress field is: 10the
final equality in Equation 2.60 follows as a result of the definition of consistent nodal
1 T { ∆ Q } {QT } and noting from 2 1 T T T Equation 2.25 that {QT } = ∫ [N ] {t }dS we may write U Q = ∫ {∆ Q } [N ] {t}dS . Now, 2S S forces: Writing the finite element strain energy as
since
{∆ } [N ] = {u } T
Q
T
T
Q
it is clear that
UQ =
UQ =
1 {uQ }T {t}dS . Thus, it is seen that this ∫ 2S
equality holds for the case of consistent nodal forces.
84
Chapter 2
Ue =
1 {σ e }T {ε e }dV = 1 ∫ {σ }T {ε }dV + 1 ∫ {σ Q }T {ε Q }dV − ∫ {σ }T {ε Q }dV (2.63) ∫ 2V 2V 2V V
or U e = U + U Q − ∫ {σ } {ε Q }dV T
(2.64)
V
Since, for consistent nodal forces we have
∫ {σ } {ε }dV = 2U T
Q
Q
(see Equation
V
2.60) then it follows that for consistent nodal forces:
Ue = U − UQ
(2.65)
Expressed in words Equation 2.65 tells us that the energy of the error equals the error of the energy and it is seen that when U = U Q , U e = 0 . Thus, when the error ratio eQ = 1, U = U Q and this means a strong pointwise equality between the finite element stress field and the true one i.e. {σ e } = {0}.
2.14 Barlow's Method applied to the four-noded quadrilateral It has been demonstrated in previous sections (§2.9 and 2.12) that the error ratios e ∆ and eQ are dependent on the shape of an element and on the test field which is applied to it. However, although bounds have been placed on the error ratios and examples of the type of test field that produce these bounds have been found, a systematic method for identifying all possible test fields that give bounding values of the error ratios has not been investigated. In [BAR 90a] Barlow introduces such a method and applies it to the eight-noded quadrilateral membrane element. Barlow's Method will now be applied to the four-noded element being considered in this thesis.
The strain energy quantities have been defined previously but are tabulated in Table 2.6 for convenience.
85
Chapter 2 True strain energy
1 { f }T [A]{ f } 2 1 T U ∆ = { f } [ A∆ ]{ f } 2
U=
FE Strain energy due to applied nodal displacements FE Strain energy due to applied nodal forces
UQ =
1 { f }T AQ { f } 2
[ ]
Equation 2.34 Equation 2.35 Equation 2.55
Table 2.6 Summary of strain energy quantities
The following generalised eigenproblem can be defined:
([Ah ] − λ [A]){ f λ } = {0}
(2.66)
where λ is an eigenvalue, { f λ } its corresponding eigenvector, and Ah = A∆ or AQ .
Rearranging Equation 2.66 gives:
λ=
{ f λ }T [Ah ]{ f λ } { fλ }T [A]{ fλ }
(2.67)
For an arbitrary test field { f } we have:
λmin ≤
where the quotient
{ f }T [Ah ]{ f } ≤ λ { f }T [A]{ f } max
(2.68)
{ f }T [Ah ]{ f } is termed the Rayleigh quotient [BAR 90b]. { f }T [A]{ f }
Recognising the Rayleigh quotient to be the ratio of the finite element strain energy and the true strain energy:
{ f }T [Ah ]{ f } = U h { f }T [A]{ f } U
(2.69)
86
Chapter 2 it becomes clear that the maximum and minimum eigenvalues provide bounds for the strain energy ratio and, therefore, for the error ratios. The relationships between the eigenproblems and their corresponding error ratios are shown in Table 2.7.
Eigenproblem
Applied nodal
Applied nodal forces
displacements ([A∆ ] − λ∆ [A]){ f λ } = {0}
([A ] − λ [A]){ f } = {0}
λ∆ =
Eigenvalue e∆ =
Error ratio
Q
U∆ U
λ
Q
λQ =
UQ U
1
λ∆
eQ = λ Q
Table 2.7 Eigenproblems and their corresponding error ratios
The extreme values of the error ratios are related to the extreme values of the eigenvalues in the following manner:
min eQmax = λmax = λmin Q and eQ Q
(2.70) e ∆max =
1 min ∆
λ
and e∆min =
1
λmax ∆
The eigenvectors { f λ } corresponding to these extreme eigenvalues represent the test fields that produce the extreme error ratios.
Let us consider the type of results achieved by Barlow's Method.
The
method is applied to the undistorted element detailed in Figure 2.11. The eigensolutions can be summarised in the form of the spectral matrix S , which is a diagonal matrix containing the eigenvalues on the diagonal, and
87
Chapter 2 the modal matrix M whose columns are the eigenvectors. The diagonals of the spectral matrices for the two types of applied loading are:
S∆
i, i
= 1, 1, 1, 1. 484, 1. 484, 0, 0
, SQ
i, i
= 1, 1, 1, 0. 768, 0. 768, 0, 0
and the corresponding modal matrices are: 1 0 0 [M ∆ ] = 0 0 0 0
0 0 0 0 1 0 0 0 0 1 0 0 0 0 1 0 0 0 0 1 0 0 0 0 0 0 0 0
0 0 0 0 0 1 0 0 0 0 0 0 0 0 0 1 0 0 0 1 0 0 0 0 0 0 0 0.3 , M Q = 0 0 0 1 0.414 − 0.68 1 0 0 0 − 0.414 1 1 0.68 0.3 0 1 0 1 0.68 0 0 0 0.088 − 0.212 0 0 0 − 0.212 − 0.088 − 0.68 0 1 1 0
[ ]
For both types of applied loading three eigenpairs with unit eigenvalues are recovered. These solutions correspond to the three constant stress states which the element can model exactly.
The four remaining eigensolutions are linear combinations of the four linear test stress fields. The element under consideration has five independent stress fields of which three are the constant stress states.
Thus, the
remaining two stress fields are all that is available to the element for it to cope with the four applied linear stress fields.
For each type of applied loading two eigenpairs with zero eigenvalues are found.
In the case of applied nodal displacements, these eigensolutions
correspond to test displacement fields that cause the element to move in an unstrained, rigid body, manner (§2.9, Observation (iii)).
For the case of
applied nodal forces, these solutions correspond to test stress fields that have boundary tractions producing zero consistent nodal forces (§2.12, Observation (iii)). These eigensolutions represent test fields for which the element does not deform and U h = 0 .
Since we know, for the case of
consistent nodal forces, (§2.4, Equation 2.23), that the finite element stress 88
Chapter 2 field {σ h } is chosen such as to minimise the error energy U e , then it is clear for these cases that the best the element can do is to do nothing i.e.
{σ h } = {0} : any other finite element solution i.e. {σ h } ≠ {0} would increase the error energy above the minimum value.
The two remaining eigenpairs have eigenvectors that represent the applied test field which the element is best able to model measured in terms of the error ratio.
Thus, for example, for the case of applied nodal forces, the
element considered will never achieve a finite element strain energy greater than 76.8% of the true value when modelling linear stress test fields
2.15 A series of tests using Barlow's Method Since Barlow's Method spans all the test fields considered, only four tests need to be performed. However, by recognising that variations of Tx and Ty will give the same extreme values of error ratio, only one of the tapers need be considered. For this purpose variations of Tx only shall be considered. Thus the three tests to be performed are detailed in Table 2.8.
Test
1
2
3
AR S Tx Ty
V
1
1
0
V
0
0
0
V
0
0
0
a
1
1
1
Table 2.8 Independent tests to be performed for Barlow's Method
2.16 Results from Barlow's Method Since, in general, the error ratio e ∆ can lie between zero and infinity, there is little justification in examining the results for the case of applied nodal displacements. For the case of applied nodal forces the maximum non-unit (the constant stress fields are not considered) eigenvalue has been plotted in 89
Chapter 2 Figure 2.19. This value is equal to the maximum error ratio eQ that can be achieved when the element is loaded with consistent nodal forces corresponding to a linear statically admissible stress field.
The regions
lying below these curves represents the region of possible values of eQ when linear stress test fields are applied and have been hatched.
Figure 2.19 Regions of possible error ratio eQ (applied nodal forces)
The following observations are made:
(i) From the variation of maximum error ratio with aspect ratio in Figure 2.19 it is seen that the maximum error ratio actually increases with increasing aspect ratio. This trend is also observed for the skew parameter up to a value of about 0.5.
Above this value the maximum error ratio
decreases but for the range investigated remains above the value obtained for the square element. This means that for certain linear stress fields the parallelogram element gives a better approximation than the square element. This point is illustrated in the closure to this chapter.
(ii) For the variation of maximum error ratio with taper the reverse appears to be the case with the maximum error ratio decreasing uniformly with increasing taper. This fact is not surprising since it was noted (§2.3) that for tapered elements the finite element stress field {σ h } is a rational, rather than a polynomial function. Had we tested the element with rational test stress fields then perhaps this trend would have been reversed. 90
Chapter 2
2.17 Closure This chapter has investigated the response of single elements to boundary loadings which are consistent with known statically and kinematically admissible stress fields.
The CRE-Method was used to investigate the
response to particular stress fields whilst Barlow's Method enabled us to identify those stress fields to which the element responds most and least well. In both methods two types of applied loading were considered.
The conclusions drawn from these investigations are that the element under consideration has a response that is:
i) dependent on the shape of the element, ii) dependent on the applied stress field, iii) dependent on the value of Poisson's Ratio, and iv) dependent on the way in which the element is loaded.
The first two conclusions are well known.
The fact that the elements
response is dependent upon the applied stress field means that at the preprocessing stage of an analysis, where the analyst has little or no idea of the nature of the stress field for the problem, he cannot predict, a priori, how his element is going to perform.
The investigations in this chapter have been performed with a single value of Poisson's Ratio of ν = 0 . 3 . It was observed in Section 2.8 that the error ratio e ∆ for a given test field, whilst being independent on Young's Modulus and the material thickness, was dependent on the value of Poisson's Ratio. This is also true for the error ratio eQ . In addition to this, it is also the case that the maximum error ratio obtainable for the linear stress fields is also a function of Poisson's Ratio.
The nature of the relationship between the 91
Chapter 2 maximum error ratio and Poisson's Ratio is shown in Figure 2.20 for the case of applied nodal forces and for the different shape parameters. The curves for three value of Poisson's Ratio ranging between 0 and 0.5 have been plotted. Although it is appreciated that the value of Poisson's Ratio can vary widely between different materials (for some materials e.g. cork it is even negative) this range of values was chosen to be representative of typical engineering materials.
Figure 2.20 Variation of maximum eQ with shape parameter and Poisson's Ratio In this figure the curve for ν = 0 . 3 is identical to that shown in Figure 2.19 in the previous section.
It is also noted that, for a particular shape of
element, the test field that produces the maximum error ratio varies with Poisson's Ratio.
From Figure 2.20 it is seen that the difference in the maximum error ratio eQ for different values of Poisson's Ratio is quite significant. Although, for
rectangular and tapered elements, it is seen that the maximum error ratio increases the smaller the value of Poisson's Ratio, for skewed elements this trend, whilst holding for small values of skew, reverses for higher values of the skew shape parameter. Although the value of Poisson's Ratio will be dictated be ones choice of material, the fact that the behaviour of ones element is affected by Poisson's Ratio should be borne in mind.
In the
closure of Chapter 3 an interesting practical example of the effect that Poisson's Ratio can have on ones results is shown. 92
Chapter 2
In the investigations carried out in this chapter it was seen that the method of applying the boundary loadings to the element had a significant effect on how the element was able to respond to a given test field. It should be noted that the methods of applying the boundary loadings studied in this chapter constitute only two of the possibilities that exist. Cases where different boundaries of the element are subjected to different types of applied loading, and cases where mixed boundary conditions are applied to a single boundary have not been considered. It was observed that only when the model is force driven (i.e. only when consistent nodal forces are applied to the entire boundary) can one make the strong statement that the finite element stress field is chosen as the one that is nearest to the true stress field in a strain energy sense i.e. the strain energy of the error is minimised. This is generally not the case when the model is loaded with boundary displacements. Thus even though in practical finite element analyses where the nature of the applied loading is dictated by the problem being analysed it is as well to be aware of the fact that the nature of the applied loading may effect one's results.
Let us now return to the question of the element response being dependent on its shape. Although commercial finite element software vendors tend to prescribe some form of limit on the level of distortion allowed for particular elements and, as discussed previously (§2.3), for purely logical and for computational reasons these limits may appear to be sensible, it has been observed (§2.16) that for particular stress fields the distorted element may perform better than the undistorted square element.
It was noted, in
particular, that for linear stress fields the rectangular element could provide a better approximation than the square element. This knowledge can be used
to
advantage.
{ f } = 0,0,0M120,0,0,0T
Consider
the
constant
moment
stress
field
applied to the square continuum shown in Figure 2.21. 93
Chapter 2 A
10m
Y
X
10m
Figure 2.21 Continuum and tractions for constant moment stress field
With E = 210 N m 2 , ν = 0 . 3 and t = 1m , the two meshes shown in Figure 2.22 are considered. In both cases the meshes are loaded with consistent nodal forces.
Mesh A
Mesh B
Figure 2.22 Meshes A & B (undisplaced and displaced)
For both Meshes A & B the elements are rectangular with AR = 4 . However, from the results of the single element test shown in Figure 2.16 (curves
T1 & T2 with aspect ratio), it is clear that Mesh B should produce superior results to those of Mesh A. This is also the case for the mesh of elements as can be seen from the displaced shapes of the meshes shown in Figure 2.22.
It is clear from the figure that Mesh B is more capable of modelling this problem since there are more element edges positioned on the edge which takes up a curved shape than the edge which remains straight. This result 94
Chapter 2 is also borne out in the model strain energies and the σ x -component of the finite element stress at point A which are shown in Table 2.9. Mesh
Uh
σ hX @ point A
A
21131
407
B
25443
587
U = 28572
σ X = 600
Table 2.9 Finite element results for constant moment stress field
For tapered elements it was seen (§2.16) that, in general, for linear stress fields the elements performance decreased with increasing taper although, for a particular linear stress field, it may be the case (§2.12, Figure 2.16, curves T10 and T13 ) that the response actually improves with increasing taper. It is clear, therefore, that for a particular problem, and given mesh discretisation the optimal mesh may contain distorted elements.
This
thinking lies behind the so-called r-adaptivity approach where the nodes of a mesh are relocated without excessive consideration of element shape in order to achieve an optimal approximation. This idea is now demonstrated.
Figure 2.23 shows a mesh of four elements subjected to boundary tractions consistent with the quadratic stress field shown in Equation 2.71. σ x = 12 y (10 − x )
σy = 0
(2.71)
τ xy = 6 ( y 2 − 25)
This stress field has a parabolic shearing traction and, as such is called the parabolic shear stress field.
95
Chapter 2 4.7m 3.9m
4
7
3
9
6
5
2
8
1
X
10m
Y
10m
Figure 2.23 Mesh and tractions for r-adaptivity example
With E = 210 N m 2 , ν = 0 . 3 and t = 1m the strain energy for this problem is U = 16952 Nm .
The model is loaded with consistent nodal forces and is
restrained against rigid body motion as shown in the figure.
For this problem the X co-ordinates of nodes 5,7 & 9 are taken as variables and the objective function, which is to be maximised, is the total strain energy of the solution U h . It is sufficient for the purpose of this discussion to show that relocation of the nodes increases U h . The finite element strain energy for the undistorted model is U h = 14204 Nm . By relocating nodes 5,7 & 9 the elements become distorted as shown by the dotted lines in Figure 2.22.
For this distorted mesh the finite element strain energy is
U h = 14331 Nm .
This mesh configuration was found, by numerical
experiment, to produce the maximum value for U h . Since this strain energy is nearer to the true value than that obtained for the undistorted mesh the solution resulting from the distorted mesh is clearly better in an integral sense. This improvement may also be monitored in the prediction of the σ x component of the stress at node 4.
The true stress at this point is
σ X = 600 N m 2 whilst for the two finite element models the stress at this point are compared in Table 2.10.
96
Chapter 2 FE model
Uh
σ hX @ node 4
Undistorted
14204
415
Distorted
14331
467
U = 16952
σ X = 600
Table 2.10 Finite element results for parabolic shear stress field
In conclusion then it is seen that many interesting and useful points have been teased out of the investigations into the single element carried out in this chapter. These points, together with the experience gained in using the element in practical situations, form a body of knowledge which is invaluable to the practising engineer. The fact that one can not predict a priori, without a knowledge of the actual stress field for the problem, how the element is able to perform means that error estimation can only be done after a finite element analysis.
The remaining part of this thesis
investigates a number of schemes for the a posteriori estimation of errors in the finite element method.
97
CHAPTER 3 A POSTERIORI ERROR ESTIMATION THROUGH THE USE OF ESTIMATED STRESS FIELDS
Summary In this chapter the philosophy for a posteriori error estimation laid down in [ROB 92a] is detailed. This philosophy makes use of the physically meaningful concepts of an estimated stress field and error measures based on strain energy quantities. A series of benchmark tests are defined on which error estimators defined and discussed in subsequent chapters will be evaluated. The finite element results for these tests are reported and discussed.
3.1 Introduction Chapter 2 of this thesis considered the errors in the finite element approximation for a single element.
The true solutions for the problems
investigated in that chapter were always known and, therefore, it was possible to evaluate the true error.
In practical finite element analysis,
however, one is concerned with multi-element models for which the true solution is unknown. The true error for such models is thus unavailable and the best that can be done is to estimate an error.
The aim of such so called a posteriori error estimation is to determine an estimated error that is representative, in some sense, of the true error. The concept of an estimated true stress field is used and error measures are formed using physically meaningful strain energy quantities rather than the more mathematical error norm quantities that are often used in the literature. The philosophy of error estimation discussed in Section 3.2 of this chapter has also been reported in [ROB 92a].
98
Chapter 3 In order to evaluate a new error estimator it must be tested on problems with known solutions. If it is effective for such problems then a degree of confidence is afforded when using it for problems where the solution is not known. Chapter 4 of this thesis investigates a number of error estimators that use a continuous estimated stress field whilst Chapters 5 and 6 investigate new forms of error estimator for which the estimated stress field is statically admissible at the element level. In order to evaluate these error estimators a series of benchmark tests are defined.
3.2 A philosophy for estimated error measures The majority of the literature in this area of research, for example [SZA 91], makes use of the more mathematical concepts of the error norm when defining error measures. In contrast to this, and for the reason that it has more physical meaning and may therefore be more approachable to the practising engineer, the concept of strain energy will be used in describing error measures in this thesis.
Given the true stress field {σ } and the finite element stress field {σ h }, the true error in stress {σ e } is defined as:
{σ e } = {σ }− {σ h }
(3.1)
In practical situations where the true stress field is not known, an estimated one {σ~}1 is used. The estimated error in stress {σ~ } is then given as: e
{σ~e } = {σ~} − {σ h }
(3.2)
The true and estimated error stress fields are in the form of distributions. In order to quantify the total error in a single element, the distribution over 1The
tilde will be used throughout to indicate estimated quantities.
99
Chapter 3 the whole element must be represented by a single number. achieved using the concept of strain energy.
This is
The true strain energy for
element i is:
Ui =
T 1 { } {ε }i dVi σ i 2 Vi∫
(3.3)
where U and V represent the strain energy and volume respectively.
The finite element strain energy is:
U hi =
T 1 {σ h }i {ε h }i dVi ∫ 2 Vi
(3.4)
Therefore, the strain energy of the true error U ei is:
U ei =
T 1 {σ e }i {ε e }i dVi ∫ 2 Vi
(3.5)
It is noted that for models loaded with consistent nodal forces and homogeneous kinematic boundary conditions that the error in strain energy is equal to the strain energy of the error:
U ei = U i − U hi
(3.6)
~ and the strain energy of the estimated error U ei is:
T 1 ~ U ei = ∫ {σ~e }i {ε~e }i dVi 2 Vi
(3.7)
100
Chapter 3 There are thus two single numbers representing the true and the estimated error in element i . Summing these errors over a mesh of ne elements gives the strain energy of the true error U e as: ne
U e = ∑ U ei
(3.8)
i =1
~ and, likewise, the strain energy of the estimated error U e as: ne ~ ~ U e = ∑ U ei
(3.9)
i =1
Having determined the strain energy of the error for the model it is now necessary to evaluate the significance of this error. This is achieved by comparing the strain energy of the error with the true strain energy U in the form of the percentage error in strain energy:
α=
Ue × 100% U
(3.10)
The larger the value of α , the greater the significance of the error in the model.
In an analogous manner the estimated values are compared as: ~ Ue ~ α = ~ × 100% U
(3.11)
~ where U is an estimated strain energy for the model.
The estimated strain energy may be defined in two ways. Since the estimated stress field {σ~} is known, an estimated strain energy for the ~ whole model U1 may be defined as:
101
Chapter 3 T ~ 1 U1 = ∫ {σ~} {ε~}dV 2V
(3.12)
However, the more commonly used definition is:
~ ~ U2 = Uh + Ue
(3.13)
where
~ 1 U e = ∫ ({σ~} − {σ h })T ({ε~} − {ε h })dV 2V
(3.14)
~ It is seen that the estimated stress field {σ~} is used directly in U1 but only ~ comes into U 2 indirectly through the error stress field. In other words the ~ stress field corresponding to U 2 is undefined and is not the same as {σ~}. In
general therefore: ~ ~ U1 ≠ U 2
(3.15)
~ In the following work the estimated strain energy will be taken as U 2 and
~ henceforth will be denoted simply as U .
The parameters α and α~ are the error measures that will be used in this text.
Different error estimators will result from different estimated stress fields and the effectivity of a particular error estimator can be measured with the effectivity ratio β which is defined as:
β=
~ Ue Ue
(3.16)
102
Chapter 3 The nearer this ratio is to unity, the more effective is the error estimator.
Now, because of the nature of integral quantities such as strain energy, it is possible that many different estimated stress fields will yield the same ~ strain energy of the estimated error U e and, therefore, the same effectivity ratio β . It is desirable therefore to measure the quality of an estimated stress field in terms of its closeness to the true stress field. The error of the ) estimated stress field {σ } is defined as the difference between the true stress field {σ } and the estimated stress field {σ~} such that:
{σ)} = {σ }− {σ~}
(3.17)
Thus, integrating over the volume of element i the strain energy of the error of the estimated stress field for element i is: ) 1 )T ) U i = ∫ {σ }i {ε }i dVi 2 Vi
(3.18)
and summing for a model of ne elements gives us the strain energy of the error of the estimated stress field for the model: ) ne ) U = ∑U i
(3.19)
i =1
) The nearer U is to zero, the nearer the estimated stress field is to the true
one in an integral sense.
The pointwise percentage error in some quantity φ (typically a component of stress or displacement) is defined as:
αφ =
φ − φh × 100% φ
(3.20)
where φ h is the finite element value.
103
Chapter 3 3.3 Stress recovery schemes The nodal stresses consistent with the finite element stress field {σ h } are determined by evaluating Equation 2.17 at the element nodes. However, it is common practice in commercial finite element systems to recover the nodal stresses by extrapolating from points within the element. The use of such stress recovery schemes (SRS) is justified on the basis of the superconvergent properties of the resulting recovered stress, or simply for reasons of computational efficiency. For the element under investigation several SRS have been used and a number of these are discussed by Maunder in [MAU 89]. In this thesis we shall be interested in two such stress recovery schemes and these are defined in Table 3.1.
SRS1
Direct evaluation at nodes
SRS2
Bi-linear extrapolation from 2x2 Gauss points Table 3.1 Stress recovery schemes
In later work it will be convenient to define the recovered nodal stresses for an element as a single vector {s} such that for SRS1 we have:
{s} = σ h 1 , σ h 2 , σ h 3 , σ h 4 T
(3.21)
(12x1)
where σ h
i
is the row vector of finite element stresses evaluated at node i .
Thus, in terms of the nodal displacements {δ } we have:
{s} = [H 1 ]{δ }
(3.22)
(12x8)
[D ][B ]1 [D ][B ] 2 where [H1 ] = and B i is the matrix B evaluated at node i . [D ][B ]3 [D ][B ]4 104
Chapter 3
{ } are
For SRS2 the Gauss point stresses s g
given in terms of the nodal
displacements as:
{s }= [H ]{δ } g
g 1
(3.23)
where the matrix H1g is of the same form as the matrix H1 except that in this case the matrices B i are evaluated at the four Gauss points.
The nodal stresses are then obtained through bi-linear extrapolation from the 2x2 Gauss points:
{s} = [H 2 ][H 1g ]{δ }
(3.24)
(12x12)
where a 0 0 c 0 0 [H 2 ] = b 0 0 c 0 0
and a = 1 +
0 0 c
0 0 b 0 0 c
a 0 0 c
0 0 b 0 0
0 a 0 0 c
0 0 b 0
0 0 a 0 0 c c
0 0 a 0 0 c
0 c
0
0 0 a 0 0 c
b 0 0 c
0 0 a 0 0
0 b 0 0 c
0 0 a 0
0 0 b 0 0 c
0 0 a
0 0 b 0 0 c
0 c
0 0
0 0 a 0 0 c
0 0 c
c
0 0 b
0 0
0 0 b 0 0 c
0
0 0 c 0 0 c 0 0 b 0 0 b 0 0 c 0 0 c 0 0 a 0 0 a
3 3 1 , b = 1− , and c = − . 2 2 2
It is noted that SRS1 is equivalent to SRS2 for parallelogram elements.
It has been observed by Tenchev [TEN 91] that the quality of the nodal stress is strongly dependent on the stress recovery scheme employed 105
Chapter 3 especially at stress concentrations.
This observation was made for the
eight-noded serendipity quadrilateral membrane but is also valid for the four-noded standard Lagrangian quadrilateral membrane as will be discussed in Section 3.5.
3.4 A series of plane stress elasticity benchmark tests A benchmark test (BMT) is defined by a continuum problem, with its associated boundary conditions, material and geometric properties, and a series of meshes. The majority of benchmark tests considered in this thesis will be convergence type tests in which the convergence of selected quantities will be monitored as a mesh is refined. In addition, a distortion type test, in which the level of refinement is held constant whilst the mesh is progressively distorted will also be considered.
All the problems considered are force driven with zero body forces. As such the analytical solutions all satisfy the homogeneous equations of equilibrium.
The models are loaded with nodal forces derived in a
consistent manner (§2.4, Equation 2.25). For the case of a general traction distribution, the consistent nodal forces are as shown in Figure 3.1. q2 L/2 L/2 q1
tn thickness t
Figure 3.1 Consistent nodal forces for the general case and are determined by evaluating Equation 3.25. L
L
t 2 t 2 q1 = ∫ tn dS − ∫ S tn dS , 2 L L L −
2
−
2
L
L
t 2 t 2 q2 = ∫ tn dS + ∫ S tn dS 2 L L L −
2
−
(3.25)
2
106
Chapter 3 where S is a boundary ordinate whose origin is at the midpoint of the element edge.
For the particular cases of linear and quadratic boundary tractions the consistent nodal forces q 1 and q 2 are given explicitly in terms of a set of independent parameters describing the traction distribution. For the linear case, the parameters A and B are used whereas for the quadratic case an additional parameter C is required. These parameters are the values of the traction at the nodes and the centre of the element edge respectively. Figure 3.2 shows the consistent nodal forces for the particular case of linear and quadratic boundary tractions.
True boundary tractions
Consistent forces
Linear
Lt(2A+B)/6 L/2 L/2 Lt(A+2B)/6
Quadratic
thickness t
B
A
Lt(A+2C)/6 L/2 L/2 Lt(2C+B)/6 B C
A
Figure 3.2 Consistent nodal forces for linear and quadratic traction distributions
With the exception of BMT5 all benchmark tests possess known analytical solutions. This is important because in investigating the performance of an error estimator one needs an accurate picture of the true error. BMT's 1 & 2 use analytical solutions in stress that are linear polynomials (the linear endload and constant moment stress fields of Chapter 2 respectively). 107
Chapter 3 BMT's 3 & 4 have analytical solutions in stress that are quadratic polynomials. BMT 5 was chosen because whilst the boundary tractions are linear (or constant) the internal stress field is highly non-linear. Stress concentrations and singularities occur regularly in practical stress analysis and BMT's 6 & 7 have analytical solutions in stress with concentrations and singularities respectively. All the tests thus far considered have been of the convergence type and, with the exception of BMT6, have used rectangular elements. To examine the performance of error estimators with distorted elements a distortion problem (BMT8) is also considered. Finally, BMT9 investigates how the error measures converge with refinement for a mesh of distorted elements.
In the following sub-sections the various benchmark tests are defined and the finite element results presented. For rectangular elements the finite element stress field recovered through SRS1 is identical to that recovered by SRS2 i.e. SRS1 ≡ SRS2 . In addition, 2x2 Gauss quadrature is sufficient to integrate the finite element strain energy exactly. In contrast, for tapered elements SRS1 is not equivalent to SRS2 and all Gauss quadrature schemes are approximate. The values of the finite element strain energy U h reported in the following sub-sections are obtained using 2x2 Gauss quadrature (NIS2). In order to obtain an accurate value for the true percentage error α , it has been evaluated using a finite element strain energy obtained using 5x5 Gauss quadrature (NIS3).
In contrast to this, and in order to be
consistent with the values reported by standard finite element systems, the value of U used for the estimated percentage error α~ is evaluated using h
2x2 Gauss quadrature [ROB 92b].
108
Chapter 3 3.4.1 Benchmark test number 1 This problem, shown in Figure 3.3, consists of a rectangular continuum subjected to static boundary conditions consistent with a linear endload stress field as defined in Chapter 2 (§2.5) of this thesis. This problem has also been examined in [ROB 92b]. 2
2
60N/m
60N/m
2
30N/m
y
A
x
10m
Mesh 1
Mesh 2
Mesh 3
Mesh 4
2
30N/m
20m
(a) The problem
(b) The meshes
Figure 3.3 Benchmark test 1 For this problem the analytical solution in stress is given as:
σ x = 6 x − 60 σy = 0 τ xy = −6 y
(3.26)
and for a Young's Modulus of E = 210 N m 2 , a Poisson's Ratio of ν = 0 . 3 and a material thickness of t = 0 .1m , the strain energy for the problem is:
U=
660 ≈ 94 . 286 Nm 7
(3.27)
The finite element results for this problem are given in Table 3.2.
Mesh
dof
h
Uh
Ue
α
ασ
0
8
20
2.9885
91.2972
96.8304
106.90
1
18
10
71.3607
22.9250
24.3144
54.52
2
50
5
88.5492
5.7365
6.0842
27.17
3
162
2.5
92.8509
1.4348
1.5218
13.67
4
578
1.25
93.9269
0.3588
0.3806
6.86
(i) α σ is the percentage error in stress σ x at point A (ii) Mesh 0 is the single element. (iii) h is the length of an element in the x-dirn.
Table 3.2 Finite element results for BMT1 109
Chapter 3 3.4.2 Benchmark test number 2 Figure 3.4 shows a rectangular continuum subjected to static boundary conditions consistent with a constant moment stress field as defined in Chapter 2 (§2.5). 15m
A
2
150N/m
y B
2.5m
x
10m
Mesh 1
Mesh 2
Mesh 3
Mesh 4
20m
(a) The problem
(b) The meshes
Figure 3.4 Benchmark test 2
For this problem the analytical solution in stress is:
σ x = 30 y σy = 0
(3.28)
τ xy = 0 and for a Young's Modulus of E = 210 N m 2 , a Poisson's Ratio of ν = 0 . 3 and a material thickness of t = 0 .1m , the strain energy for the problem is:
U=
2500 ≈ 357.14 Nm 7
(3.29)
For this problem the finite element results are shown in Table 3.3.
Mesh
dof
h
Uh
Ue
α
ασ
0
8
20
135.4167
221.7262
62.083
58.33
1
18
10
253.4113
103.7315
29.045
25.54
2
50
5
324.4390
32.7038
9.157
9.60
3
162
2.5
348.3061
8.8367
2.474
4.05
4
578
1.25
354.8810
2.2618
0.633
1.96
(i) α σ is the percentage error in stress σ x at point A (ii) Mesh 0 is the single element. (iii) h is the length of an element in the x-dirn.
Table 3.3 Finite element results for BMT2 110
Chapter 3 3.4.3 Benchmark test number 3 Figure 3.5 shows a rectangular continuum subjected to static boundary conditions consistent with a quadratic stress field.
2
25N/m
y x
10m
Mesh 1
Mesh 2
Mesh 3
Mesh 4
A
2
400N/m
20m
(a) The problem
(b) The meshes
Figure 3.5 Benchmark test 3 For this problem the analytical solution in stress is:
σ x = y2 σy = − x2
(3.30)
τ xy = 0 and for a Young's Modulus of E = 210 N m 2 , a Poisson's Ratio of ν = 0 . 3 and a material thickness of t = 0 .1m , the strain energy for the problem is:
U=
98375 ≈ 1561. 507 Nm 63
(3.31)
The finite element results for this problem are given in Table 3.4.
Mesh
dof
h
Uh
Ue
α
ασ
0
8
20
1412.904
148.604
9.5167
287.36
1
18
10
1520.358
41.150
2.6353
209.60
2
50
5
1550.474
11.034
0.7066
127.74
3
162
2.5
1558.654
2.854
0.1828
70.12
4
578
1.25
1560.784
0.724
0.0464
36.34
(i) α σ is the percentage error in stress σ x at point A (ii) Mesh 0 is the single element. (iii) h is the length of an element in the x-dirn.
Table 3.4 Finite element results for BMT3 111
Chapter 3 3.4.4 Benchmark test number 4 Figure 3.6 shows a rectangular continuum subjected to static boundary conditions consistent with a quadratic stress field. This problem has been chosen because results for it have been published in [BEC 93] and a comparison can thus be made. 2
93.75N/m 2
750N/m
4m
Y
4m
B X
Mesh 1
Mesh 2
Mesh 3
Mesh 4
A
8m
(a) The problem
(b) The meshes
Figure 3.6 Benchmark test 4 For this problem the analytical solution in stress is:
σ x = 46. 875 xy σy = 0
(3.32)
τ xy = 93. 75 − 23. 4375 y 2 and for a Young's Modulus of E = 3 × 10 7 N m 2 , a Poisson's Ratio of ν = 0 . 3 and a material thickness of t = 1m , the strain energy for the problem is:
U=
239 ≈ 0 . 03983' Nm 6000
(3.33)
The finite element results for this problem are shown in Table 3.5.
Mesh
dof
Uh
Ue
α
ασ
0
8
0.01490
0.02494
62.6046
79.17
1
30
0.03488
0.00496
12.4485
18.88
2
90
0.03847
0.00136
3.4180
9.05
3
306
0.03948
0.00035
0.8784
4.46
4
1122
0.03975
0.00009
0.2214
2.23
(i) α σ is the percentage error in stress σ x at point A (ii) Mesh 0 is the single element.
Table 3.5 Finite element results for BMT4 112
Chapter 3 3.4.5 Benchmark test number 5 This problem is shown in Figure 3.7. The boundary tractions are linear and are determined from the following stress field (note that this field is only valid on the model boundary)
σx = x2 σy = y2
(3.34 )
τ xy = −2 xy
This stress field, although satisfying the equations of equilibrium, is not kinematically admissible. The analytical solution in stress to this problem is non-linear and unknown. However, a finite element approximation to the analytical solution obtained using equilibrium elements and Mesh 4 is shown in the left hand column of Figure 3.8. The right hand column of this figure shows the stress fields given in Equation 3.34.
2
2
400N/m
25N/m
2
200N/m
y
10m
x
Mesh 1
Mesh 2
Mesh 3
Mesh 4
A
20m
(a) The problem (b) The meshes Figure 3.7 Benchmark test 5
Without a known analytical solution the strain energy for this problem cannot be determined in the usual manner (i.e. exact integration of the analytical stress fields). Instead, highly refined finite element models and dual analysis have been used to obtain bounds on the strain energy. For the dual analysis, the piecewise linear stress field equilibrium element of, for example Maunder [MAU 90] will be used along with the four-noded displacement element being discussed in this thesis.
The finite element 113
Chapter 3 strain energies U h are shown in Table 3.6. The superscripts C and E refer, respectively, to the compatible and equilibrium models. Three additional meshes over and above the ones shown in Figure 3.7 have been considered. These meshes are successively uniform refinements on Mesh 4. The results for the compatible model are given for all seven meshes whereas the results for the equilibrium model are only given for the first five meshes.
The
reason for this is that the equilibrium element program written by the author is only suitable for running on the PC and as such is limited in the number of elements it can analyse.
The values of finite element strain
energy for the most refined models analysed provide bounds on the strain energy and for a Young's Modulus of E = 210 N m 2 , a Poisson's Ratio of
ν = 0. 3 and a material thickness of t = 0.1m , the strain energy for the problem is: (3.35)
2041. 519 ≤ U ≤ 2041. 603 Nm
The finite element results for this problem are given in Table 3.6.
Mesh
dof
U hC
U hE
Ue
α
ασ
0
8
851.327
2168.651
1190.27 (1190.19)
58.30 (58.30)
70.13
1
18
1702.598
2050.423
339.01 (338.92)
16.61 (16.60)
52.05
2
50
1953.359
2042.310
88.25 (88.16)
4.32 (4.32)
31.08
3
162
2019.156
2041.655
22.45 (22.36)
1.10 (1.10)
16.61
4
578
2035.951
2041.604
5.65 (5.57)
0.28 (0.27)
8.25
5
2178
2040.186
2041.603
\
\
\
6
8450
2041.244
\
\
\
\
7
33282
2041.519
\
\
\
\
(i) α σ is the percentage error in stress σ x at point A, (ii) Mesh 0 is the single element.
Table 3.6 Finite element results for BMT5
In the columns headed U e and α two numbers are tabulated. The first value represents that achieved using the upper bound of the true strain energy
114
Chapter 3 and the value in parenthesis, the value achieved using the lower bound value.
(a) Stress component σ x
(b) Stress component σ y
(c) Stress component τ xy
Note: the left hand column of this figure shows the finite element approximation obtained using an equilibrium model whilst the right hand column shows the stress fields as defined in Equation 3.34.
Figure 3.8 Stress fields for BMT5 115
Chapter 3 3.4.6 Benchmark test number 6 In this benchmark test the classical problem of an unstressed circular hole in the centre of a membrane of infinite dimensions subjected to a uniform tension is considered. The tractions on the infinite membrane are shown in Figure 3.9.
σ
y
2
=10,000N/m
r x
a
X=-
X=+
Figure 3.9 The infinite membrane For this problem the analytical solution in stress is given as [SZA 91]:
a2 3 3 a4 ( cos 2 θ + cos 4 θ ) + cos 4 θ} r2 2 2 r4 a2 1 3 a4 cos 4 θ} σ y = σ ∞ {0 − 2 ( cos 2 θ − cos 4 θ ) − r 2 2 r4 a2 1 3 a4 sin 4 θ} τ xy = σ ∞ {0 − 2 ( sin 2 θ + sin 4 θ ) + r 2 2 r4
σ x = σ ∞ {1 −
(3.36)
and has been plotted out, for the finite region being considered, in Figure 3.12. For the purposes of comparison of stress fields shown in Chapter 6, Figure 3.12 shows two plots using different ranges of stress. The parameter a is the radius of the circular hole.
Instead of the infinite membrane we shall consider a finite square of side length 20m and hole radius a = 2 m centred at the origin of the problem as shown in Figure 3.10.
116
Chapter 3 y
A
B
5m
20m
45
o
x Mesh 1 (18 DOF)
Mesh 2 (50 DOF)
Mesh 3 (162 DOF)
Mesh 4 (578 DOF)
20m
(a) The geometry (b) The meshes Figure 3.10 The finite membrane and meshes
By applying tractions consistent with the analytical solution for the infinite membrane, the same analytical solution will be applicable to the finite membrane. The tractions for the finite membrane {t}f are the sum of those for the infinite membrane {t}∞ and a set of tractions {t}d defined by:
{t}d = {t}f − {t}∞
(3.37)
Clearly, as the dimensions of a finite membrane tends to infinity, the tractions {t}d will tend to zero. However, for the finite membrane being considered, {t}d are shown in Figure 3.11. 2
576N/m
2
220N/m
2
450N/m
2
976N/m
(a) Normal
(b) Tangential
Figure 3.11 Boundary tractions {t}d 117
Chapter 3 Although the analytical solution in stress is known for this problem, the strain energy is difficult to determine in a fully analytical manner. The reasons for this is that the integrand contains trigonometrical terms in the variable θ and the upper limit of the integral over the radius is a function of the angle θ .
Numerical integration in two dimensions could be used to
evaluate the strain energy and, indeed, this method was investigated by the author. However, the number of integration points required to achieve a reasonable level of accuracy turned out to be extremely large (in the order of millions). A far more efficient method for integration was used in which the integration with respect to the radius r was performed analytically whilst the integration with respect to the angle θ was carried out numerically. This 'semi-analytical' approach to the integration resulted in machine precision accuracy with just ten integration points. For a Young's Modulus of E = 10 × 10 6 N m 2 , a Poisson's Ratio of ν = 0 . 25 and a material thickness of t = 0 . 01m the strain energy is given as:
(3.38)
U = 5.188448459 Nm
and is accurate to the number of digits quoted.
The finite element results for this problem are shown in Table 3.7.
Mesh
dof
Uh
Ue
α
ασ
1
18
5.0517744
0.13495
2.6010
23.32 (31.54)
2
50
5.1350701
0.05297
1.0208
10.09 (15.77)
3
162
5.1711387
0.01725
0.3325
1.59 (4.40)
4
578
5.1835750
0.00487
0.0938
-1.09 (-0.04)
(i) α σ is the percentage error in stress σ x at point A. The first value is for SRS1 whilst the value in parenthesis is for SRS2.
Table 3.7 Finite element results for BMT6
118
Chapter 3
(a) Stress component σ x
(b) Stress component σ y
(c) Stress component τ xy
Figure 3.12 Analytical stress fields for BMT6 119
Chapter 3 3.4.6 Benchmark test number 7 This problem involves a rectangular continuum into which a infinitesimally thin crack of length 5m has been introduced as shown in Figure 3.13.
10m
10m
y
10m
x
Mesh 1
Mesh 2
Mesh 3
Mesh 4
Crack of length 5m
(a) The geometry (b) The meshes Figure 3.13 Geometry and meshes for BMT7
The boundary tractions for this problem are evaluated from the following stress field: 100 θ θ cos {1 − sin sin 2 2 r θ θ 100 cos {1 + sin sin σy = 2 2 r θ θ 100 3θ τ xy = sin cos cos 2 2 2 r
σx =
3θ } 2 3θ } 2
(3.39 )
This stress field was taken from [SZA 91] (p178) and represents a Mode 1 (symmetric) stress pattern of the type typically associated with a crack tip in linear elastic fracture mechanics. This stress field has been plotted in Figure 3.15 and, similarly to BMT6, for the purposes of comparison of stress fields shown in Chapter 6 two plots with different ranges of stress are shown. 120
Chapter 3 The stress field is statically and kinematically admissible and the true strain energy for this problem is given by the integral of these stress fields over the domain. The true strain energy was evaluated using the semianalytical approach discussed in the previous section and for a Young's Modulus of E = 210 N m 2 , a Poisson's Ratio of ν = 0 . 3 and a material thickness of t = 0 .1m , the strain energy for the problem is: (3.40)
U = 124 . 885926020 Nm
and is accurate to the number of digits quoted. 2
38.8N/m
2
13.3N/m
2
44.7N/m
Figure 3.14 Boundary tractions for BMT7
The finite element results for this problem are shown in Table 3.8.
Mesh
dof
Uh
Ue
α
1
20
96.2429
28.6430
22.9353
2
54
107.1966
17.6894
14.1644
3
170
114.5405
10.3454
8.2839
4
594
119.1384
5.7475
4.6022
Table 3.8 Finite element results for BMT7
121
Chapter 3
(a) Stress component σ x
(b) Stress component σ y
(c) Stress component τ xy
Figure 3.15 Analytical stress fields for BMT7 122
Chapter 3 3.4.8 Benchmark test number 8 In addition to observing the behaviour of error estimators as a mesh is refined, we shall also be interested in how it behaves as a mesh is distorted. This test uses the same problem as BMT2 but investigates the behaviour as a mesh is distorted. Figure 3.16 shows the problem and the meshes to be considered. This problem was also studied in [ROB 92c].
A
150N/m
2
10m
y
Mesh 1
Mesh 2
Mesh 3
Mesh 4
x
20m
Mesh 5
(a) The problem
(b) The meshes Figure 3.16 Benchmark test 8
For this problem the analytical solution in stress is: σ x = 30 y
σy = 0
(3.41)
τ xy = 0 and for a Young's Modulus of E = 210 N m 2 , a Poisson's Ratio of ν = 0 . 3 and a material thickness of t = 0 .1m , the strain energy for the problem is: 2500 U= ≈ 357.14 Nm 7
(3.42)
The finite element results for this problem are shown in Table 3.9.
Mesh
d
Uh
Ue
α
ασ
1
0
253.41
103.73
29.05
26.0
2
1
246.07
110.38
30.91
30.2
3
2
224.48
130.33
36.49
38.4
4
3
190.78
162.61
45.53
49.0
5
4
149.63
203.74
57.05
60.7
(i) α σ is the percentage error in stress σ x at point A
Table 3.9 Finite element results for BMT8
123
Chapter 3 3.4.9 Benchmark test number 9 Similar to the previous problem, BMT9 also uses the constant moment stress field of BMT2. In this case, however, the effect of mesh refinement on a distorted mesh will be examined. Mesh 1 of this problem is identical to Mesh 5 of BMT8
A
2
150N/m
y x
10m
Mesh 1
Mesh 2
Mesh 3
Mesh 4
20m
(a) The problem
(b) The meshes Figure 3.17 Benchmark test 9
For this problem the analytical solution in stress is:
σ x = 30 y σy = 0
(3.43)
τ xy = 0
and for a Young's Modulus of E = 210 N m 2 , a Poisson's Ratio of ν = 0 . 3 and a material thickness of t = 0 .1m , the strain energy for the problem is: 2500 U= ≈ 357.14 Nm 7
(3.44)
For this problem the finite element results are shown in Table 3.10.
Mesh
dof
Uh
Ue
α
ασ
1
18
149.63
203.74
57.05
60.7
2
50
269.11
86.94
24.34
14.6
3
162
329.39
27.61
7.73
2.7
4
578
349.55
7.58
2.12
1.0
(i) α σ is the percentage error in stress σ x at point A
Table 3.10 Finite element results for BMT9
124
Chapter 3 3.5 Closure The work contained in this chapter prepares the way for the study of error estimators conducted in the remaining portion of this thesis.
The error
measures, effectivity indices and other quantities defined in Section 3.2 will be used to compare these error estimators. The benchmark tests defined in Section 3.4 form a set of problems which encompass many of the characteristics that one might reasonably expect to encounter in practical situations. Thus as well as linear and quadratic polynomial stress fields problems involving stress concentrations and singularities in stress have also been considered. In most, if not all, practical analyses distortion of the elements will occur and, as such, meshes of distorted elements have also been considered. Before closing this chapter two points of interest will be noted.
It is interesting to note that in the case of BMT6, the prediction of the stress concentration at Point A is strongly dependent on the stress recovery scheme that is used. It is seen in this example that, with the exception of Mesh 4, the stress recovered by SRS1 is nearer to the true value than that recovered by SRS2 ( α σ is smaller for SRS1 see Table 3.8).
This is
particularly evident for the coarser meshes with both values tending to the true value as the mesh is refined. For Mesh 4 this observation does not hold, however, since both values of recovered stress are very close to each other, and also to the true value, this is of little significance: what happens for the coarser meshes is of importance here. This observation reinforces that made by Tenchev [TEN 91] in which he examined the eight-noded serendipity element.
In Chapter 2 it was noted that the single elements response to a given test field was dependent, among other things, on the value of Poisson's Ratio.
125
Chapter 3 This is also the case for a mesh of elements and it is interesting to see just what effect ν has on the results in a 'real' problem.
It is illuminating to write the strain energy U as the sum of four terms:
(3.45)
U = Ua + Ub + Uc + Ud
where Ua =
1 σ x2 dV ∫ 2E V
Ub = −
ν
E V∫
σ xσ y dV
Uc =
1 σ y2 dV ∫ 2E V
Ud =
(1 + ν ) τ xy dV E V∫
Now, the true strain energy will be a function of Poisson's Ratio only when U b or U d are non-zero. For BMT1 it is seen that since τ xy ≠ 0 then the strain
energy is a function of Poisson's Ratio. In contrast to this, for BMT2 it is seen that since σ x is the only non-zero component of stress U is not a function of Poisson's Ratio. From numerical experiment it is found that the finite element results for both BMT's 1 and 2 are dependent on the value of
ν . The finite element strain energy U h for BMT2, and for three different values of ν are shown in Table 3.11.
Mesh
Uh ( ν = 0)
U h ( ν = 0. 3)
Uh ( ν = 0. 5)
0
119.05
135.42
133.93
1
238.10
253.41
252.10
2
318.02
324.44
323.94
3
346.42
348.31
348.15
4
354.39
354.88
354.84
Table 3.11 Finite element strain energy for various values of ν (BMT2) 126
Chapter 3 Thus even though the strain energy of the true solution is independent of the value of Poisson's Ratio, it is seen that the finite element approximation is dependent on this value and, although this dependency tends to become small with mesh refinement, it is quite significant for the coarse meshes.
127
Chapter 3
128
CHAPTER 4 ERROR ESTIMATION USING ESTIMATED STRESS FIELDS THAT ARE CONTINUOUS
Summary In this chapter error estimators that use an estimated stress field which is continuous across element interfaces are discussed. The continuous estimated stress field is achieved by interpolating unique nodal stresses over an element with its shape functions. A number of so-called simple error estimators in which the unique nodal stresses are achieved by simple nodal averaging of the finite element stresses are evaluated. The idea of applying known boundary stresses is explored and an error estimator making use of this idea is examined. This idea represents new work which has only recently become a subject of research for other workers e.g. [MAS 93]. Results from the recently proposed error estimator of Zienkiewicz and Zhu [ZIE 92a] in which the unique nodal stresses are obtained through a patch recovery scheme are also reported and discussed.
4.1 Introduction One of the properties which reveals the approximate nature of the finite element solution, and may therefore be used as an error indicator, is the lack of continuity of stress between elements. The reason for this is that a lack of continuity in stress is indicative of a lack of interface equilibrium. A component of a typical discontinuous finite element stress field is shown in Figure 4.1a
(a) Discontinuous σ h
(b) Unique nodal stresses
(c) Continuous σ~
Figure 4.1 Transforming from a discontinuous σ h to a continuous σ~ by interpolating unique nodal stresses over an element with the element shape functions
129
Chapter 4 These discontinuities, and the associated multi-valued nodal stresses, make the unprocessed results from a finite element analysis difficult to interpret and, for this reason, it has long been normal practice to obtain a set of unique nodal stresses, produced typically by simple nodal averaging, as shown in Figure 4.1b.
Stresses at points other than the nodes can be obtained by interpolating this set of unique nodal stresses over each element with the element shape functions.
The resulting stress field is then continuous across element
interfaces as shown in Figure 4.1c.
This continuous stress field can be used as the estimated stress field in an error estimator and is defined as:
{σ~1} = [N ]{sa }
(4.1)
(3x12)
N1 where [N ] = 0 0
0
0
N2
0
0
N3
0
0
N4
0
N1 0
0 N1
0 0
N2 0
0 N2
0 0
N3 0
0 N3
0 0
N4 0
0 0 , the N i N 4
are defined in Equation 2.15 and {sa } is the vector of unique nodal stresses.
In their 1987 paper Zienkiewicz and Zhu [ZIE 87] use such an estimated stress field and they choose to obtain the set of unique nodal stresses by performing a global least squares fit between the estimated stress field {σ~ } 1
and the finite element stress field {σ h } ([HIN 74]).
A simplified version of this error estimator in which the set of unique nodal stresses are obtained by simple nodal averaging has been used commercially
130
Chapter 4 in the ANSYS1 suite of finite element software and will be investigated in this chapter. However, before doing this, it is necessary to discuss the exact nature of the finite element stress field that will be used.
4.2 Finite element stress schemes Up to this point it has been tacitly assumed that the finite element stress field {σ h } is the basic element stress field as given by Equation 2.17. However, this need not be the case and in practice a different stress field is often used.
In commercial finite element systems nodal stresses are
commonly recovered by extrapolation from points within the element as discussed in Chapter 3 (§3.3). A stress field defined by interpolating the nodal stresses recovered by SRS2 over the element with its shape functions may also be used. Two finite element stress schemes (FESS) are defined in Table 4.1.
FESS1 FESS2
{σ h } = [D][B]{δ } {σ h } = [N ]{s}
Table 4.1 Finite element stress schemes
Thus, FESS1 is the basic finite element stress field as given by Equation 2.17, whilst FESS2 interpolates nodal stresses (unaveraged) recovered by SRS2 over the element with the element shape functions. It is noted that for parallelogram elements FESS1 is equivalent to FESS2.
4.3 A group of simple error estimators A group of simple error estimators in which the estimated stress field is defined by interpolating a set of unique nodal stresses obtained by simple nodal averaging over each element of the model using the element shape
1ANSYS
is a registered trade mark for a suite of software marketed by Strucom Structures and Computers LTD, Strucom House, 40 Broadgate, Beeston, Nottingham, NG9 2FW, England.
131
Chapter 4 functions is defined in this section.
These error estimators were also
studied in the series of articles beginning with [ROB 92a].
The use of different numerical integration schemes, stress recovery schemes and finite element stress schemes will result in different error estimators. Four such variants are considered and are defined in Table 4.2.
Error estimator
NIS
SRS
FESS
CF
EE1
1
2
2
x
EE2
2
2
2
x
EE3
2
1
1
x
EE4
1
2
2
√
Table 4.2 Simple error estimators
The nodal averaged stresses are obtained in the following manner. For a i single component of stress, say s xi , at node i the averaged value sax is
determined as: i s ax =
1 ne i ∑ s xj ne j =1
(4.2)
where s xji is s xi for element j and the summation is taken over all ne elements connected to node i .
It is convenient to write this process in matrix form such that the vector of recovered stresses for the whole model
{sˆ}
is mapped into a vector of
averaged stresses for the whole model {sˆa } through the relationship:
{sˆa } = [Eˆ ]{sˆ}
(4.3)
(12ne x12ne)
[]
T T where {sˆ} = s 1, s 2 L s ne , {sˆa } = sa 1, sa 2 L sa ne and the matrix Eˆ is
determined from the model connectivity. 132
Chapter 4
Although, in the context of this section, it is appropriate to define Equation 4.3 at this juncture, use of this equation will not actually be made until Chapter 6.
It is noted that in models where only one parallelogram element is connected to a node, the estimated stress fields for EE1,2 & 3 will give no stress error at that node i.e. {σ~e } = {0} at such nodes. For quadrilaterals, EE1 & EE3 only will give zero error. In general, the true error at such a node will not be zero.
The fourth error estimator EE4 addresses this
potential deficiency by assigning to such nodes the average value of the stress error at the remaining nodes of that element. The use of this so called correction factor (CF) is indicated in the fifth column of Table 4.2. This error estimator is the one used by ANSYS and in all other respects is identical to EE1.
The details of EE4 have been confirmed in a private
correspondence with Shah Yunis of Swanson Analysis Systems Inc.2.
The performance of these error estimators for BMT's1 & 8 has been discussed in detail in [ROB 92b & 93a]. This investigation is now extended to include the additional benchmark tests considered in this thesis (see Chapter 3).
4.4 Performance of the simple error estimators The performance of the simple error estimators is discussed in this section. The convergence characteristics may be presented in a number of ways. For example, in Figure 4.2a the error measures are plotted against degrees of freedom for BMT2 using a linear-linear graph.
It is observed from this
figure that as the mesh is refined, the error measures become small and appear to be mutually convergent. 2Swanson
Analysis Systems, Inc., Johnson Rd., P.O. Box 65, Houston, PA 15342-0065.
133
Chapter 4
True value EE1 EE2 & EE3 EE4
True value EE1 EE2 & EE3 EE4
(a) linear-linear graph
(b) log-log graph
Figure 4.2 Error measures for BMT2
In practice, however, as observed from Figure 4.2b in which the same information is plotted but in a, perhaps, more conventional log-log format, it is seen that although ultimately appearing to possess the same rate of convergence (i.e. the same gradient) the error estimators fall into two distinct groups as manifest by the tendency towards two curves on the graph, and that these two curves are displaced by a constant shift. This behaviour is important and for this reason the results will be presented using log-log graphs.
The error measures and effectivity ratios for the convergence benchmark tests considered have been tabulated in Table 4.3 and plotted in Figures 4.3 and 4.4 respectively.
With respect to the convergence tests involving rectangular elements, a number of observations are made:
(i)
An important property of any error estimator is that it should be
asymptotically exact.
An asymptotically exact error estimator is one for
which the effectivity ratio β converges to unity as the mesh is refined i.e. 134
Chapter 4
β → 1 as h → 0 . An error estimator for which β converges to some value other than unity as the mesh is refined is termed asymptotically inexact. With respect to the rectangular continuum convergence tests, it is observed that the error estimators considered fall into two distinct groups: those which appear to be asymptotically exact (EE2 & EE3), and those which appear to be asymptotically inexact (EE1 &EE4).
The significant difference between these two groups of error estimators is ~ the way in which the estimated error strain energy U e is integrated i.e. the NIS that is used. Those error estimators which appear to be asymptotically inexact use nodal quadrature (NIS1) whilst those which appear to be asymptotically exact use 2x2 Gauss quadrature (NIS2), which is exact for the rectangular element being considered.
It is seen that the error
measures were obtained with values decreasing as follows
α~4 ≥ α~1 > α~2 = α~3
(4.4)
The equality between α~2 and α~3 results from the equivalence of SRS2 and SRS3 for the rectangular element. The inequality between α~4 and α~1 is due to the use of the correction factor and is discussed further in observation (ii). The inequality between α~ and α~ in Equation 4.4 is due solely to the 1
2
different numerical integration schemes used. It can be proved that nodal quadrature produces an upper bound for the integration of the error energies and this proof is given for the rectangular element in Appendix 3.
135
Chapter 4
BMT
BMT1
BMT2
BMT3
BMT4
BMT5
BMT6
BMT7
BMT8
BMT9
Error measures ~ α α~ α~
Effectivity ratios
α~
β1
β2
β3
β4
Mesh
α
1
24.314
32.482
24.284
24.284
39.078
1.50
1.00
1.00
2.00
2
6.084
12.735
6.088
6.088
13.346
2.25
1.00
1.00
2.38
3
1.522
3.900
1.522
1.522
3.944
2.63
1.00
1.00
2.66
4
0.381
1.063
0.381
0.381
1.066
2.81
1.00
1.00
2.82
1
29.045
30.346
22.508
22.508
36.745
1.06
0.71
0.71
1.42
2
9.157
17.116
8.378
8.378
17.874
2.05
0.91
0.91
2.16
3
2.474
6.096
2.406
2.406
6.158
2.56
0.97
0.97
2.60
4
0.633
1.749
0.628
0.628
1.753
2.80
0.99
0.99
2.80
1
2.635
3.451
2.075
2.075
4.549
1.32
0.78
0.78
1.76
2
0.707
1.484
0.647
0.647
1.568
2.12
0.92
0.92
2.24
3
0.183
0.462
0.177
0.177
0.468
2.54
0.97
0.97
2.57
4
0.046
0.128
0.046
0.046
0.128
2.76
0.99
0.99
2.77
1
12.449
18.096
9.193
9.193
19.993
1.55
0.71
0.71
1.76
2
3.418
7.208
3.176
3.176
7.462
2.20
0.93
0.93
2.28
3
0.878
2.232
0.861
0.861
2.255
2.58
0.98
0.98
2.60
4
0.221
0.614
0.220
0.220
0.615
2.78
1.00
1.00
2.79
1
16.60
20.142
13.996
13.996
25.166
1.27
0.82
0.82
1.69
2
4.32
8.301
4.060
4.060
8.795
2.0
0.94
0.94
2.14
3
1.10
2.637
1.070
1.070
2.687
2.4
0.97
0.97
2.49
4
0.27
0.742
0.274
0.274
0.746
2.8
1.0
1.0
2.73
1
2.601
1.431
0.734
0.844
2.181
0.54
0.28
0.32
0.83
2
1.021
0.919
0.458
0.482
1.012
0.90
0.45
0.47
0.99
3
0.333
0.418
0.195
0.198
0.428
1.26
0.59
0.60
1.29
4
0.093
0.153
0.066
0.067
0.154
1.63
0.71
0.71
1.64
1
22.935
12.795
6.470
6.470
16.363
0.49
0.23
0.23
0.66
2
14.164
12.925
6.852
6.852
13.510
0.90
0.45
0.45
0.95
3
8.284
8.723
4.424
4.424
8.756
1.06
0.51
0.51
1.06
4
4.602
5.443
2.694
2.694
5.444
1.19
0.57
0.57
1.19
1
29.05
30.35
22.51
22.51
36.75
1.06
0.71
0.71
1.42
2
30.91
28.50
21.14
21.89
34.70
0.89
0.60
0.63
1.18
3
36.49
23.76
17.81
20.82
29.36
0.54
0.37
0.45
0.72
4
45.53
19.01
14.76
21.48
23.84
0.28
0.20
0.32
0.37
5
57.05
19.55
15.31
29.04
24.47
0.18
0.13
0.30
0.24
1
57.047
19.551
15.311
29.044
24.473
0.18
0.13
0.30
0.24
2
24.344
29.096
17.520
20.049
29.869
1.27
0.66
0.78
1.32
3
7.731
15.535
6.999
7.246
15.608
2.19
0.90
0.93
2.21
4
2.122
5.387
2.051
2.070
5.392
2.63
0.97
0.98
2.63
1
2
3
4
Table 4.3 Error measures and effectivity ratios for EE1, EE2, EE3 and EE4
136
Chapter 4
137
Chapter 4
138
Chapter 4 This proof, which is for rectangular elements, is also applicable to parallelograms, but not to tapered elements where {σ h } is not necessarily linear, and the Jacobian is not constant. However, comparing α~1 and α~2 for BMT6, 8 and 9 indicates that similar effects may occur in generally distorted elements.
It is noted that in practical terms, an error estimator that over-estimates the true extent of the error is a safe one in that the true error will always be less than predicted. However, it should also be realised that, for a predefined level of accuracy, reliance on such an error estimator would lead to a mesh that was more refined than was really necessary and this would be unnecessarily expensive in terms of computational effort.
This point is
explained in Figure 4.5 which shows how, for a pre-defined level of accuracy (say 5%), the error estimators EE1 and EE4 would require more degrees of freedom than EE2 and EE3. In the case of BMT1 (as depicted in Figure 4.5) approximately twice the number of degrees of freedom are required for EE1 and/or EE4.
True value EE1 EE2 & EE3 EE4
5%
60
120
Figure 4.5 Degrees of freedom for 5% accuracy (BMT1)
139
Chapter 4 (ii) The correction factor (CF) used by EE4 means that α~4 ≥ α~1 . This point is particularly evident for the courser meshes (e.g. Mesh 1). However, as the mesh is refined α~4 → α~1 and the effect of the correction factor becomes negligible. The reason for this is that whilst initially, for the coarse meshes, the four corner elements to which the correction factor is applied make up a significant portion of the whole mesh (infact, for Mesh1 they constitute the entire mesh), as the mesh is refined the corner elements become increasingly less significant.
In terms of the effectivity of the error
estimator, it is observed that since the error estimator to which the correction factor is applied uses nodal quadrature and thus, as proved in Appendix 3 already over-estimates the true extent of the error, the effectivity is further removed from the ideal value of unity. In other words the correction factor applied to EE4 tends to decrease the error estimator's effectivity. In contrast, if the correction factor had been applied to those error estimators that use an exact integration scheme, then, since the effectivity ratio converges from below unity, the correction factor would improve the effectivity of such error estimators.
(iii) Let us now consider the way in which the error measures converge for BMT's 6 and 9.
In this case where tapered elements are used the
equivalence between SRS1 and SRS2 no longer exists. The error measures α~1 , α~2 , α~3 and α~4 are shown in Table 4.3 and are plotted in Figure 4.3. It is seen from these results that although initially, for the coarser meshes, the behaviour is somewhat erratic, as the mesh is refined trends similar to those observed for the rectangular continuum tests are seen to occur.
The error estimators form two distinct groups depending on the numerical integration scheme used, with NIS1 giving the higher value. It is seen that for the heavily distorted elements of Mesh 1, EE2 and EE3 produce significantly different error measures. However, as the mesh is refined this 140
Chapter 4 difference is reduced and for the refined mesh (Mesh 4) it is seen that the difference is very small. This observed behaviour is a result of two coupled phenomena. Firstly, as the mesh is refined the level of taper distortion in the elements is decreased. This point was demonstrated in Chapter 2 (§2.3, Figure 2.5) for the meshes used in BMT9. It is also true for the meshes used in BMT6. This is demonstrated by considering how the shape parameters vary as the mesh is refined for a single element. Table 4.4 shows how the shape parameters vary as the mesh is refined for the 'corner' element which has as one of its node points the point r = 2 m , θ = 0 . It is seen from these results that the taper parameter Tx (note that the taper parameter Ty is sensibly zero) decreases as the mesh is refined. Secondly, as the mesh is refined, the stress field over an element becomes sensibly constant and the error becomes small.
Mesh
AR
S
Tx
Ty
1
1.0347
0.0000
0.4286
0.0000
2
1.3711
0.0000
0.2727
0.0000
3
1.6031
0.0001
0.1579
0.0000
4
1.7449
0.0002
0.0858
0.0000
Table 4.4 Variation of shape parameters with refinement for an element (BMT6)
For the distortion test BMT8, the error measures and effectivity ratios are shown in Tables 4.3 and plotted in Figure 4.6a and 4.6b respectively.
For this test it is seen that the true percentage error in strain energy α increases with distortion.
This is to be expected because, through
considerations of symmetry, the optimum position of node 9 must be in the centre as is the case when d = 0 . The error measures, although different in magnitude, all follow a similar trend and tend to decrease as the level of 141
Chapter 4 distortion increases. The reason for this was shown to be [ROB 92c] that whilst the finite element stress field {σ h } moves further away from the true one as the distortion increases, it also becomes smoother.
An error
estimator that relies for its effectivity on the lack of smoothness in the finite element solution will thus fair badly in this situation.
EE1 EE2 EE3 EE4
True value EE1 EE2 EE3 EE4
0
1
2
3
4
(a) Error measures
0
1
2
3
4
(b) Effectivity ratios
Figure 4.6 Error measures and effectivity ratios for BMT8
BMT8 reinforces the observations already made for the convergence BMT's. It is seen that for d = 0 , EE2 and EE3 yield the same result but that as the distortion increases the error measures α~2 and α~3 diverge. The effect of the correction factor on coarse meshes is particularly evident with α~4 >> α~1 independent of the level of distortion.
142
Chapter 4 4.5 Simple error estimators with applied static boundary conditions Many problems in static stress analysis are force driven i.e. the static boundary conditions are applied. If the SBC's are known then so too are the direct stresses normal to the surface and the shear stresses tangential to the surface. The remaining component of stress (the direct stress tangential to the surface) is usually the component of interest in any stress analysis.
It would seem sense, therefore, if certain components of the true stress are known on the boundary, that the estimated stress field is modified accordingly. This work represents new work that has only recently become a topic of study for other researchers e.g. [MAS 93]. The resulting estimated stress field is defined as:
{σ~2 } = [N ]{sa* }
(4.5)
The vector of modified nodal averaged stresses {s a* } is obtained from the nodal averaged stresses
{sa }
such that for any component i
that is
unaffected by the SBC's, s ai* = s ai whilst those components that are affected by the SBC's are modified. For a single element this modification process may be written conveniently in matrix form:
{s }= [Q]{s }+ {g} * a
(4.6)
a
where the matrix Q is diagonal and binary such that for any component i that is unaffected by the SBC's, Qi,i = 1 whilst for those components j that are affected by the SBC's, Q j , j = 0 .
The vector
{g}
has zeros for all
components except those components that are affected by the SBC's. Stress fields such as {σ~2 } which satisfy the static boundary conditions are termed boundary admissible stress fields.
143
Chapter 4 The determination of the values of those components of {g } that are affected by the SBC's must now be considered.
Perhaps the simplest method of
determining the value of these components might be to simply replace them by the relevant component of the true boundary traction {t } evaluated at that node. This static boundary scheme (SBS) will be termed SBS1. For true boundary tractions that are linear, because the estimated stress field {σ~2 } is also linear along an element boundary, SBS1 guarantees a strong, point by point equilibrium between the static boundary conditions and the estimated stress field. This case is shown in the first row of Figure 4.7.
True boundary tractions
Consistent tractions
Linear
A L/2 L/2 B thickness t
B
A
Quadratic
(2A+2B-C)/3 L/2 L/2 (-A+2B+2C)/3 C B
A
Figure 4.7 Consistent tractions for linear and quadratic traction distributions
In contrast to this, if we consider the case where the true boundary tractions are non-linear, then it is seen that strong, point by point equilibrium cannot be achieved. The best that can be done is to enforce a weak equilibrium requirement in which the resultant forces (and resultant moments) of the true boundary tractions are equated with those of the tractions of the estimated stress field {σ~2 }. In this way the nodal stresses can be determined. However, as demonstrated in the second row of Figure 4.7 for the case where {t } is quadratic, these nodal stresses are not the same as
144
Chapter 4 those that would have been achieved by SBS1. As such, requiring weak equilibrium constitutes a different static boundary scheme and is termed SBS2.
For the general case where the distribution of the traction is arbitrary, as shown in Figure 4.8 (for the normal traction as typical), the nodal stresses
σ n1 and σ n2 are given by Equation 4.7.
σn2 L/2 L/2
σn1
tn thickness t
Figure 4.8 Consistent nodal stresses for the general case L 2
σ n1 =
1 6 tn dS − 2 ∫ L L L −
2
L 2
∫ S t dS , n
L − 2
L 2
σ n2 =
1 6 tn dS + 2 ∫ L L L −
2
L 2
∫ S t dS n
(4.7)
L − 2
where S is a boundary ordinate whose origin is at the midpoint of the element edge.
For boundary tractions which are linear SBS1 is equivalent to SBS2. However, for a general traction distribution, the two static boundary schemes are different. In this chapter we shall only consider SBS1. The second scheme will be considered in more detail in Chapter 6.
For the benchmark tests whose domain is rectangular it is clear how the static boundary conditions are applied.
For BMT7, static boundary
conditions are applied on all of the model boundaries including the two faces of the crack where the normal and tangential tractions are zero. At the root 145
Chapter 4 of the crack ( x = y = 0 ) where all three components of stress are theoretically infinite, the averaged nodal stress is left unaltered. For BMT6, however, the way in which the static boundary conditions are applied around the circular hole needs to be defined in more detail.
The following procedure is adopted for applying the static boundary conditions to nodes lying on the circular portion of the boundary of BMT6.
1) The components of the nodal averaged stresses for the node of interest form a vector {sa } .
This vector is then transformed from the global co-
ordinate system into a local boundary co-ordinate system through the transformation defined in Chapter 2 (Equation 2.8):
{ba } = [R2 ]{sa } where {ba } = ban , bat , bas
T
(4.8)
such that ban is the direct stress normal to the
surface, bat is the direct stress tangential to the surface and bas is the shear stress.
Note here that the boundary co-ordinate system is defined such that the ordinates of the co-ordinate system are normal and tangential to the true surface (i.e. the circular arc in the case of BMT6) and not to the discretised polygonal surface at the node of interest which has discontinuous slope.
2) The true values of the direct stress normal to the surface bn and the shear stress bs are defined by the static boundary conditions and the vector
{ba } is now modified with these known values in the following manner: 0 0 0 bn b = 0 1 0{ba } + 0 b 0 0 0 s
{} * a
(4.9)
146
Chapter 4
{ }
where ba* is the vector of nodal averaged stresses modified by the static boundary conditions.
{ }
3) Finally, the vector ba* is transformed back into the global co-ordinate system:
{s } = [R ] {b } * a
−1
2
* a
(4.10)
In this way the static boundary conditions are applied to the circular portion of the boundary in BMT6.
A new error estimator for which the static boundary conditions are applied is now defined. This error estimator is identical to EE2 but uses SBS1 on the static boundary. This error estimator will be termed EE2 b where the superscript b indicates that the static boundary conditions have been applied. Since both EE2 and EE3 are asymptotically exact then either of these error estimators could have been chosen for this study. However, in order to reduce the quantity of data to be presented EE2 has been chosen for an examination of the effect of applying the static boundary conditions. This choice can be seen to be reasonable on the grounds that since EE2 and EE3 are only different when the elements are tapered, even when generally distorted meshes are used the results from these error estimators will tend to each other as the mesh is refined.
4.6 Performance of simple error estimators with applied SBC's Error estimator EE2 b has been applied to the BMT's considered and the error measures and effectivity ratios are shown in Table 4.5 and plotted in
147
Chapter 4
BMT
BMT1
BMT2
BMT3
BMT4
BMT5
BMT6
BMT7
BMT8
BMT9
Error measures α~ α~ b
Effectivity ratios
α~
β2
β b2
βp
24.284
1.00
1.02
1.00
6.211
6.077
1.00
1.02
1.00
1.522
1.543
1.521
1.00
1.01
1.00
0.381
0.383
0.381
1.00
1.01
1.00
29.045
22.508
25.119
22.508
0.71
0.82
0.71
2
9.157
8.378
8.523
8.424
0.91
0.92
0.91
3
2.474
2.406
2.416
2.407
0.97
0.98
0.97
4
0.633
0.628
0.629
0.628
0.99
0.99
0.99
Mesh
α
1
24.314
24.284
24.765
2
6.084
6.088
3
1.522
4
0.381
1
2
2
p
1
2.635
2.075
3.039
3.873
0.78
1.16
1.49
2
0.707
0.647
0.729
0.957
0.92
1.03
1.36
3
0.183
0.177
0.184
0.204
0.97
1.01
1.12
4
0.046
0.046
0.047
0.048
0.99
1.00
1.03
1
12.449
9.193
13.405
9.578
0.71
1.09
0.75
2
3.418
3.176
3.589
3.233
0.93
1.05
0.94
3
0.878
0.861
0.895
0.866
0.98
1.02
0.99
4
0.221
0.220
0.223
0.221
1.00
1.01
1.00
1
16.60
13.996
17.890
14.626
0.82
1.09
0.86
2
4.32
4.060
4.544
4.074
0.94
1.05
0.94
3
1.10
1.070
1.131
1.073
0.97
1.03
0.98
4
0.27
0.274
0.281
0.275
1.0
1.02
1.00
1
2.601
0.734
2.288
4.078
0.28
0.88
1.57
2
1.021
0.458
1.157
0.704
0.45
1.13
0.68
3
0.333
0.195
0.347
0.247
0.59
1.04
0.74
4
0.093
0.066
0.087
0.074
0.71
0.93
0.78
1
22.935
6.470
13.618
i
0.23
0.53
i
2
14.164
6.852
9.566
8.900
0.45
0.64
0.59
3
8.284
4.424
6.210
5.448
0.51
0.73
0.64
4
4.602
2.694
3.740
3.297
0.57
0.81
0.71
1
29.05
22.51
25.12
22.51
0.71
0.82
0.71
2
30.91
21.14
26.75
24.57
0.60
0.81
0.73
3
36.49
17.81
32.00
30.21
0.37
0.81
0.75
4
45.53
14.76
41.00
37.88
0.20
0.82
0.73
5
57.05
15.31
52.47
45.65
0.13
0.81
0.63
1
57.047
15.311
52.470
ii
0.13
0.81
ii
2
24.344
17.520
20.695
ii
0.66
0.81
ii
3
7.731
6.999
7.264
ii
0.90
0.93
ii
4
2.122
2.051
2.080
ii
0.97
0.98
ii
(i) For this problem there is no internal patch recovery point (§4.7) (ii) The results are not available for this problem
Table 4.5 Error measures and effectivity ratios for EE2, EE2 b and EEp
148
Chapter 4
149
Chapter 4
150
Chapter 4 Figures 4.9 and 4.10. In addition to the results for EE2 b , the results for EE2 and EEp have also been tabulated and plotted. Error estimator EEp will be defined in Section 4.7. Considering first the rectangular continuum convergence tests, it is seen that application of the SBC's can improve the prediction of the error. This is particularly evident for the coarser meshes where this improvement is quite marked. This fact is not surprising when one realises that for the coarser meshes application of the SBC's means that a large proportion of the total nodal stress variables will be replaced with true values. For example, with Mesh 1 there are 3 × 9 = 27 nodal stress variables of which 20 will be modified by application of the SBC's. As the mesh is refined this effect becomes less pronounced. This is a coupled effect due to the fact that the boundary nodes become a less significant proportion of the total nodes as the mesh is refined, and the fact that the finite element stresses on the boundary become nearer to the true values as the mesh is refined. For the distortion problem BMT8, the effect of applying the SBC's is dramatic as shown in Figure 4.11.
It is seen from this figure that,
whereas without SBC's the wrong trend is observed in the error measures with the effectivity ratio decreasing with distortion, with the simple expedient of applying the SBC's this trend is reversed and the effectivity ratio remains sensibly constant i.e. β 2b appears to be independent of distortion.
The fact that the error estimator EE2 b proves (generally) to be more effective than EE2 should be evident in the quality of the estimated stress field. The various stress fields considered have been plotted for Mesh 1 and for BMT1 and BMT2 in Figures 4.13 and 4.14 respectively. Within each of these figures the same scale is used for each stress field and for each component of stress. Thus, since the true stress fields have been defined in Chapter 3 (Equations 3.26 and 3.28), point values of stress for the other stress fields shown may be determined by scaling from the true stress fields. 151
Chapter 4 The four elements of Mesh 1 have been exploded (drawn separately) in order to show the discontinuities of stress between elements.
True value EE2 EE2b EEp
EE2 EE2b EEp
Figure 4.11 Error measures and effectivity ratios for BMT8
Considering BMT1, it is seen that the finite element stress field {σ h } looks to be a fairly poor representation of the true stress field {σ } - observe that the two non-zero components of stress ( σ x and τ xy ) which should be linear are approximated as predominantly constant. In contrast, the estimated stress field {σ~ } looks to be much nearer to the true one with the correct mode 1
shapes for these two components of stress being recovered. This intuitive opinion is reinforced through the effectivity of the error estimator EE2. By applying the SBC's, an estimated stress field {σ~ } is produced which, with 2
components σ x and τ xy being identical to the true ones, looks even nearer to the true one than {σ~1}. However, it is observed from the results for EE2 b that this error estimator is less effective than EE2. This difference is small and it is suggested that when the error estimator EE2 is already effective (β 2 is close to unity) then the effect of applying the SBC's may be marginal. We have here a situation where although the two estimated stress fields {σ~1} and {σ~2 } are significantly different in a pointwise sense, their corresponding effectivity ratios are nearly identical. The superior quality exhibited by {σ~ } can be detected through a comparison of the corresponding 2
152
Chapter 4 strain energy of the error of the estimated stress field i.e. by comparing ) ) ) U1 with U 2 . Such a comparison reveals (see Table 4.6) that U 2 is significantly ) less than U1 , in fact, the difference is about two orders of magnitude. Thus, where two estimated stress fields are clearly different in a pointwise sense yet yield effectivity ratios that are close together, the strain energy of the error of the estimated stress field may be used to reveal the better stress field.
For BMT2 it is seen that, apart from some relatively small amplitude modes of σ y - and τ xy -components of stress, the finite element stress field {σ h } might be considered as a reasonable approximation to the true one. At least in this case the mode shape of the predominant stress ( σ x in this case) is well represented (c.f. BMT1) even if the amplitude is not returned exactly. The estimated stress field {σ~1} is close to {σ h } in that only the σ y - and τ xy components of stress are significantly changed and these are small in comparison to σ . In contrast to this, through application of the SBC's, {σ~ } x
2
possesses σ y - and τ xy -components of stress identical to the true stress field. The third component of stress σ x also appears to be nearer to the true one. In this case where error estimator EE2 is not very effective it is seen that the effect of applying the SBC's is significant.
The improvement in the quality of the estimated stress field {σ~2 } due to applying the static boundary conditions to the estimated stress field {σ~1} can also be seen by comparing the strain energy of the error of the estimated ) ) stress fields U1 and U 2 respectively. This quantity measures the proximity of the estimated stress field to the true one in an integral sense such that ) the smaller the value of U the closer the estimated stress field is to the true one. Table 4.6 shows the strain energy of the error of the estimated stress for a selection of error estimators discussed in this thesis. Note here that ) although the quantity U has been tabulated for error estimators EE8 and 153
Chapter 4 EE10 in Table 4.6, these error estimators are not defined until Chapter 5. ) The variation of U with degrees of freedom is plotted in Figure 4.12. With the exceptions of BMT6, Mesh 1 and BMT4, Mesh 4 it is seen that ) ) application of the static boundary conditions reduces U i.e. U 2 is less than ) U1 . In some cases (c.f. BMT1 and BMT2) this reduction is quite large. In ) ) the case of BMT4, Mesh 4 it is seen that the difference between U1 and U 2 is small enough to be considered insignificant. For BMT6, Mesh 1, on the other hand the difference is more significant. It is seen that for the more refined meshes in BMT6 this trend is reversed and it is therefore felt that the reason for the anomaly observed for Mesh 1 lies in the fact that this mesh represents a very crude discretisation both in terms of its ability to model stress gradients and in its approximation of the geometry of the circular arc.
It will be noted in other sections that this mesh tends to
produce other anomalies.
Thus, in conclusion, it has been demonstrated that by the simple expedient of applying the known static boundary conditions, the effectivity of an error estimator is greatly improved. In addition to this the resulting estimated stress field becomes closer to the true one in an integral sense.
154
Chapter 4
Strain energy of the error of the estimated stress field BMT
BMT1
BMT2
BMT3
BMT4
) U2
) U 2b
) U 36
) U 38
) U 310
(EE2)
( EE2 b )
(EE6)
(EE8)
(EE10)
1
22.93
0.36
22.72
22.87
0.28
2
2.862
0.094
5.679
2.694
0.089
3
0.358
0.016
1.420
0.326
0.015
4
0.0449
0.0024
0.3549
0.0402
0.0023
1
103.73
7.76
84.54
98.93
6.73
2
17.56
1.52
25.04
16.90
1.48
3
2.341
0.146
6.604
2.260
0.144
4
0.2933
0.0122
1.6775
0.2836
0.0121
1
36.96
14.63
7.88
28.61
13.77
2
5.557
1.044
1.424
4.576
1.017
3
0.795
0.075
0.302
0.681
0.074
4
0.1075
0.0066
0.0704
0.0939
0.0065
1
378e-5
171e-5
269e-5
341e-5
179e-5
2
66e-5
20e-5
69e-5
61e-5
21e-5
3
9.43e-5
1.68e-5
17.4e-5
8.65e-5
1.72e-5
4
1.25e-5
0.126e-5
4.35e-5
1.14e-5
0.129e-5
Mesh
1 BMT5
2
Results for BMT5 are not given because there
3
is no analytical expression for the true stress field
4
BMT6
BMT7
BMT8
BMT9
1
0.1498
0.1590
0.1301
0.1562
0.1427
2
0.0469
0.0459
0.0417
0.0461
0.0476
3
0.0115
0.0078
0.0125
0.0109
0.0083
4
0.00234
0.00094
0.00346
0.00219
0.00098
1
32.386
28.561
27.180
30.369
29.526
2
19.016
17.999
16.653
18.737
18.490
3
10.361
9.957
9.689
10.192
10.250
4
5.333
5.046
5.350
5.240
5.240
1
103.73
7.76
84.54
98.93
6.73
2
114.75
20.31
91.75
102.82
17.75
3
146.62
54.32
115.20
117.01
47.66
4
196.77
100.50
154.83
143.58
87.94
5
272.10
147.34
203.19
178.15
127.59
1
272.10
147.34
203.19
178.15
127.59
2
88.98
45.37
71.44
69.44
43.08
3
14.12
7.55
20.14
12.03
7.16
4
1.809
0.909
5.233
1.587
0.844
) Table 4.6 U for selected error estimators
155
Chapter 4 4.7 Error estimators based on patch recovery schemes Up to this point we have considered error estimators based on interpolating over the element with a set of unique nodal stresses. The element shape functions are used for interpolation and the unique nodal stresses are determined by simple nodal averaging of the finite element stresses at a node. Other methods exist for determining these unique nodal stresses e.g. the global least squares fit of [ZIE 87], and the patch recovery scheme of [ZIE 92a] which is also used by [WIB 93a].
In particular, the recently
proposed patch recovery scheme of Zienkiewicz and Zhu [ZIE 92a] will now be discussed.
The work detailed in this section was presented by the author at the Seventh World Congress on Finite Element Methods1 and is to be published as a series of articles in Finite Element News beginning with [RAM 94]. This work is based on the recommendations made by Zienkiewicz in [ZIE 92a]. However, the method laid down in this paper leads to an unreliable error estimator. In order to overcome this problem the author proposes the use of what he calls the parent patch concept.
The problems with the
method proposed in [ZIE 92a], the reasons for these problems and the parent patch concept, which was devised in order to overcome these problems, are described in this section.
In the patch recovery scheme, for each component of stress, a polynomial stress surface σ p (shown hatched in Figure 4.15), with the same polynomial terms as the element shape functions, is fitted in a least squares manner to the finite element stresses at the superconvergent (stress) points [BAR 76] in the elements of the patch. For the element under consideration there is a single superconvergent point at the isoparametric centre of the element.
11st
- 5th November 1993, Beach Plaza Hotel, Monte-Carlo, Monaco.
159
Chapter 4
stress surface
σP
Figure 4.15 Patch recovery scheme for a patch of four elements
The stress surface is defined as:
σ p = P {a}
(4.11)
(1x4) (4x1)
where σ p = σ px , σ py or τ pxy and, for the element under consideration in which the shape functions are bi-linear, the row vector P = 1, x , y , xy .
The component of unique nodal stress (recovered stress) is determined by evaluating Equation 4.11 at the appropriate node (patch recovery point). The vector {a}, which is different for each component of stress, is determined by solving the matrix equation resulting from the least squares fit:
[A]{a} = {b} (4x4)
n
n
(4.12)
(4x1)
where [ A] = ∑ P i P i , {b} = ∑ P i σ hi , the summation is taken over all n T
i =1
T
i =1
elements in the patch and σ hi = σ hx , σ hy or τ hxy evaluated at superconvergent point i . For the configuration considered in this thesis n = 4.
Investigations into this method [SBR 93] showed that the matrix A and, therefore, the recovered stress are dependent on the choice of co-ordinate system used to define the vector
P .
Three types of dependency were
isolated and defined as:
160
Chapter 4
i) dependence on the position of the patch (l-dependence) ii) dependence on the size of the patch (r-dependence) iii) dependence on the orientation of the patch ( θ -dependence)
In a subsequent article [ZIE 93] a normalized local co-ordinate system was proposed which avoids the problems associated with l- and r-dependency. This co-ordinate system is shown in Figure 4.16 and the equations of transformation between a co-ordinate system ( x , y ) and this normalized local patch co-ordinate system ( x , y ) are:
x = −1 + 2
x − x min x max − x min
y − y min y max − y min
y = −1 + 2
and
1 2
(4.13)
1 2
The origin of this co-ordinate systems is x 0 = ( x max + x min ) and y 0 = ( y max + y min ) .
The row vector P used in Equations 4.11 and 4.12 is now written in the co-ordinates ( x , y ) such that P = 1, x , y , xy . y
y
y max
+1
superconvergent point patch recovery point centre of superconvergent points
x -1
y0 +1
y min
-1
x x min
x max
x0
Figure 4.16 The normalized local patch co-ordinate system of [ZIE 93]
Although the use of a normalized local patch co-ordinate system avoids the potential problems associated with the position and size of the patch i.e. l161
Chapter 4 and r-dependence, problems associated with the orientation of the element patch ( θ -dependence) with respect to this co-ordinate system can still occur. In order to demonstrate this phenomenon consider the patch of elements shown in Figure 4.17. y superconvergent point patch recovery point
x
centre of superconvergent points IV
III
θ
2r2 I
V
II
2r1
Figure 4.17 Element patch to show dependence on orientation of the patch
In this figure the x -axis of the normalized local patch co-ordinate system r ( x , y ) is rotated an angle θ from a vector v that is fixed in the element patch such that its origin is at the patch recovery point and is directed through the centre of a line running between the superconvergent points II and III.
For this configuration the matrix A , which is defined in the co-ordinate system ( x , y ) , is singular when θ =
π
π
+ n . Now, although this singularity 4 2
occurs only at these angles, the value of the recovered stress is strongly dependent upon the angle θ . This point is now demonstrated. Consider the rectangular
patch
r1 = 80 m and r2 = 40 m .
of
elements
shown
in
Figure
4.17
with
The values of the finite element stress at the four
superconvergent points are chosen arbitrarily as:
σ hI = 200 MPa, σ hII = 100 MPa, σ hIII = 500 MPa and σ hIV = 150 MPa .
(4.14)
162
Chapter 4 The condition number (defined as the ratio of the largest singular value to the smallest singular value) of the matrix A has been plotted in Figure 4.18b and the singularity at θ = 45 o is clearly visible. The singularity is localised to this angle alone but for angles that are very close to 45 o the matrix A is ill-conditioned.
The bi-linear stress surface σ p is fitted to the superconvergent stress values and it is seen, by observing Figure 4.18a, that even though the finite element stresses at the superconvergent points to which the surface is fitted are always the same, independent of the orientation, the recovered stress is strongly dependent on the angle θ even where the matrix
A
is well
conditioned (i.e. away from 45 o). The reason for this behaviour is that the bi-linear stress surface defined in Equation 4.11 is not invariant to rotation. This is demonstrated graphically in Figures 4.18c-h which show the stress surface σ p for various angles between 0 and 90 o .
The recovered stress
values are also shown.
In order to remove the dependence of the recovered stress on the orientation of the patch co-ordinate system ( x , y ) , the concept of the parent element [BUR 87], as used in the isoparametric mapping of four-node quadrilateral elements, is appropriated and applied to the element patch. The resulting parent patch and its associated curvilinear co-ordinate system ( ξ , η) are shown in Figure 4.19.
163
Recovered stress
Condition number of [A]
Chapter 4
Angle
(degrees)
(a) Recovered stress versus θ lines of constant y
Angle
(degrees)
(b) Condition number versus θ
y y
Θ
lines of constant x
x,v
x v
(c) θ = 0 , σ p = 237. 5 MPa
(d) θ = 20 o , σ p = 308. 3 MPa
(e) θ = 40 o , σ p = 716. 0 MPa
(f) θ = 50 o , σ p = −241. 0 MPa
(g) θ = 70 o , σ p = 166. 7 MPa
(h) θ = 90 o , σ p = 237. 5 MPa
Figure 4.18 Dependence of the stress surface on orientation of patch 164
Chapter 4 y
y
y max
+1
superconvergent point patch recovery point (1,1)
centre of superconvergent points
III
(-1,1)
II IV
x
(1,-1)
-1 I
y0
(-1,-1)
+1
y min
-1
x x min
x max
x0
Figure 4.19 The parent patch and associated curvilinear co-ordinate system
The origin of the curvilinear co-ordinate system ( ξ , η) is at the centre of the superconvergent points. The ξ -axis is directed through the intersection of the line running between the superconvergent points II and III and its bisector whilst the η -axis is directed through the intersection of the line running between the superconvergent points III and IV and its bisector. The equations of transformation between a co-ordinate system ( x , y ) and this curvilinear patch co-ordinate system ( ξ , η) are: x = e1 + e2 ξ + e3 η + e4 ξη
y = f1 + f 2 ξ + f3 η + f 4 ξη
(4.15)
where the e and f coefficients are linear combinations of the Gauss point coordinates: 1 ( + x I + x II + x III + x IV ) 4 1 e 2 = ( − x I + x II + x III − x IV ) 4 1 e 3 = ( − x I − x II + x III + x IV ) 4 1 e 4 = ( + x I − x II + x III − x IV ) 4 e1 =
1 ( + y I + y II + y III + y IV ) 4 1 f 2 = ( − y I + y II + y III − y IV ) 4 1 f 3 = ( − y I − y II + y III + y IV ) 4 1 f 4 = ( + y I − y II + y III − y IV ) 4 f1 =
165
Chapter 4 In the curvilinear co-ordinate system ( ξ , η) the superconvergent points then have the simple unit co-ordinates as shown in the figure.
The row vector
P = 1, ξ , η, ξη .
P
is now written in terms of the co-ordinates ( ξ , η) as
The matrix A becomes 4 I where I is the identity
matrix and is independent of the real patch of elements. As such, the vector
{a} may be written explicitly as: 1 ( + σ hI 4 1 a 2 = ( − σ hI 4 1 a 3 = ( − σ hI 4 1 a 4 = ( + σ hI 4
a1 =
+ σ hII + σ hIII + σ hIV ) + σ hII + σ hIII − σ hIV )
(4. 16 )
− σ hII + σ hIII + σ hIV ) − σ hII + σ hIII − σ hIV )
It is observed that the value of the stress surface σ p at the centre of the superconvergent points ( ξ = η = 0 ) , as given by the coefficient a1 , is simply the average of the values at the four superconvergent points. Thus, for four elements having superconvergent points forming a parallelogram, the superconvergent point is coincident with the patch recovery point and the recovered stress is simply the average of the values of the finite element stress at the four superconvergent points.
For an arbitrary distribution of superconvergent points, the centre of the superconvergent points is no longer coincident with the patch recovery point and the recovered stress is determined by evaluating Equation 4.11 at the stress recovery point after first solving Equation 4.15 for the curvilinear coordinates of the patch recovery point. This requires the solution of a pair of non-linear equations and can be done using a simple iterative technique such as Newton-Raphson (see [PRE 89] for example).
166
Chapter 4 With the parent patch concept the matrix
A
is never singular or ill-
conditioned (in fact since it is always four times the identity matrix it always has perfect condition) and there is always a unique value for the recovered stress σ p .
Thus far we have only considered the patch recovery scheme as it applies to internal nodes.
The recovered stress for internal nodes is obtained by
interpolating from the stress surface σ p . For boundary nodes the recovered stress is obtained by extrapolating from the appropriate stress surface. For corner nodes, i.e. those nodes belonging to a single element, the appropriate stress surface is the one defined using the superconvergent point for that element. appropriate
For other boundary nodes belonging to two elements the stress surface
is the one that is defined using the
superconvergent points of both elements.
The way in which the nodal
stresses are recovered is shown schematically in Figure 4.20 where the arrows lying inside the patch represent interpolation, and those lying outside the patch represent extrapolation. interpolation to internal node
extrapolation to ordinary boundary node extrapolation to corner boundary node
Figure 4.20 Recovery of nodal stresses by interpolation and extrapolation
In summary then, the patch recovery scheme of Zienkiewicz and Zhu [ZIE 92a] has been applied, verbatim, to the element under consideration in this thesis. In doing this the problem of orientation dependence was observed. 167
Chapter 4 The parent patch concept was then developed to overcome this problem. In private communications between the author and Professor Zienkiewicz it transpires that although he did indeed recommend the use of an incomplete bi-linear polynomial for the stress surface in [ZIE 92a] he is now of the opinion that a complete linear polynomial should be used for the stress surface.
This change of direction has not, as far as the author is aware, been made public and, as a such, the author is at present in negotiations with Professor Zienkiewicz regarding the publication of a short communication to the Journal for Numerical Methods in Engineering. This publication is likely to take the form of a comparative study of the patch recovery scheme for different polynomial stress surfaces and applied to the element under consideration in this thesis. The results from this comparative study are presented in the following section. However, before presenting any results it is necessary to define the error estimators that will be investigated.
A number of error estimators will now be defined. The error estimators all use an estimated stress field {σ~} that is continuous and is determined by interpolating a set of unique nodal stresses over each element with its shape functions. The unique nodal stresses are obtained using a patch recovery scheme the details of which are given in Table 4.7.
We shall also
investigate the effect that application of the static boundary conditions has on the error estimators. Thus, similarly to EE2 b in the previous section we shall indicate the fact that the static boundary conditions have been applied with a superscript b.
The strain energy quantities used in defining the error measures and effectivity ratios are all evaluated using 2x2 Gauss quadrature which is exact for parallelogram elements. 168
Chapter 4
Error estimator
Co-ordinate system
Stress surface
Application of SBC's
EEL
Cartesian
linear
no
EELb
Cartesian
linear
yes
EEb
Cartesian
bi-linear
no
EEb b
Cartesian
bi-linear
yes
EEp
curvilinear
bi-linear
no
curvilinear
bi-linear
yes
EEp
b
Table 4.7 Definition of error estimators using a patch recovery scheme
Although not investigated further in this thesis, it is interesting to note at this point that in [WIB 93a] and [WIB 93b] Wiberg et al, who also use a patch recovery scheme choose to use statically admissible stress fields as their stress surface σ p . Thus, since the statically admissible stress fields, although also being polynomial in nature, are coupled between the three components of stress their recovery scheme will involve simultaneously solution for all three components of recovered stress at a node. Contrast this with the scheme used by Zienkiewicz where since the components of recovered stress are not coupled, stress recovery is performed separately for each component of stress.
4.8 Performance of error estimators based on patch recovery schemes In this section the error estimators which use a patch recovery scheme are compared with each other and with those already investigated in this chapter. Three benchmark tests (BMT's 2, 4 and 6) will be investigated. The effectivity ratios and strain energy of the error of the estimated stress field for the error estimators considered in this section are tabulated in Tables 4.8 and 4.9 respectively. In addition to the integrated quantities ) β and U we shall also be interested in point values of the recovered stress. The reason for this interest lies in the claim made in [ZIE 92a] that all
169
Chapter 4 nodal stresses recovered from a patch recovery scheme are superconvergent. This claim is investigated.
It is known that as a mesh is refined and hmax → 0 , the rate of convergence of a point values stress tends to a constant value termed the asymptotic rate of convergence n. For a point value of stress in a finite element approximation using the element under consideration in this thesis the asymptotic rate of convergence can be shown [ZIE 89] to be unity i.e. n = 1.
In the pre-
asymptotic range, where hmax is not sufficiently small for asymptotic convergence to be observed, the rate of convergence cannot be predicted theoretically and will generally be different from the asymptotic rate. The term superconvergent means that the actual rate of convergence observed is one order higher than that predicted theoretically. Thus, for a point value of stress to be superconvergent means that the asymptotic rate of convergence should be n = 2 .
Thus, in summary, for the element under investigation in this thesis we would expect the rate of convergence of an arbitrary point value of stress to tend to n = 1 as the mesh is refined. At the superconvergent point within the elements (the isoparametric centre for this element) we would expect to achieve n = 2 as the mesh is refined. The claim made by Zienkiewicz [ZIE 92a] is that all nodal stresses recovered through a patch recovery scheme are superconvergent. In order to examine this claim we shall investigate the way in which the error in the recovered stress at certain selected nodes converges with mesh refinement.
A formal definition of the rate of
convergence is now given in terms of the estimated error in stress:
n=
i i log σ~e j − log σ~e j +1
log h j − log h j +1
(4.17)
170
Chapter 4 i where σ~e j is the modulus of the error in a component of the recovered
stress at node i and for mesh j, and h j is the characteristic length of an element in mesh j.
It should be noted that this definition is only suitable for cases where uniform mesh refinement is employed.
As such it will not be used for
BMT6.
The rate of convergence can be observed by plotting the log of the modulus of the estimated stress error against the log of the characteristic length h . If this is done then the gradient of the resulting curve is the rate of convergence n.
The value of the recovered stress at selected points for BMT2 and BMT4 are tabulated in Tables 4.10 and 4.11 respectively and the error in the recovered stress at these points is plotted in Figures 4.21 and 4.22 respectively. In these figures a triangular wedge to indicate the superconvergent rate of convergence is included and the values of the gradient for selected curves are also shown.
171
Chapter 4
Without applied SBC's BMT
BMT2
BMT4
BMT6
With SBC's
β bL
β bb
β bp
0.819
0.806
0.806
0.806
0.913
0.924
0.922
0.922
0.922
0.972
0.972
0.976
0.975
0.975
0.975
0.991
0.992
0.992
0.993
0.992
0.992
0.992
0.7120
0.8291
0.7450
0.7450
1.0887
1.0338
1.0338
1.0338
2
0.9270
0.9334
0.9442
0.9442
1.0518
1.0177
1.0177
1.0177
3
0.9804
0.9823
0.9853
0.9853
1.0188
1.0053
1.0053
1.0053
4
0.9947
0.9954
0.9960
0.9960
1.0062
1.0012
1.0012
1.0012
1
0.2768
1.3825
3.8637
1.5718
0.8766
0.8392
0.9254
1.3729
2
0.4456
0.7521
3238.3
0.6814
1.1349
1.2106
24.84
1.2527
3
0.5855
0.7831
9.3791
0.7358
1.0429
1.1282
7.7591
1.1320
4
0.7054
0.7974
398.06
0.7839
0.9309
0.9880
214.86
0.9894
Mesh
β2
βL
βb
βp
β
1
0.710
0.710
0.710
0.710
2
0.907
0.900
0.913
3
0.972
0.969
4
0.992
1
b 2
Table 4.8 Effectivity ratios for error estimators using patch recovery
BMT
BMT2
BMT4
BMT6
Without applied SBC's
With SBC's
) UL
) Ub
) Up
) U 2b
) U Lb
) U bb
) U bp
Mesh
) U2
1
103.73
30.13
30.13
30.13
7.76
10.04
10.04
10.04
2
17.56
3.03
3.28
3.28
1.52
2.05
2.05
2.05
3
2.341
0.256
0.281
0.281
0.146
0.199
0.199
0.199
4
0.2933
0.0195
0.0211
0.0211
0.0122
0.0161
0.0161
0.0161
1
378e-5
278e-5
149e-5
149e-5
171e-5
143e-5
143e-5
143e-5
2
66e-5
18e-5
16e-5
16e-5
20e-5
15e-5
15e-5
15e-5
3
9.43e-5
1.32e-5
1.28e-5
1.28e-5
1.68e-5
1.20e-5
1.20e-5
1.20e-5
4
1.25e-5
0.09e-5
0.09e-5
0.09e-5
0.13e-5
0.09e-5
0.09e-5
0.09e-5
1
0.1498
0.3148
0.6412
0.2731
0.1590
0.1677
0.1663
0.2039
2
0.0469
0.0526
171.67
0.0453
0.0459
0.0507
1.2955
0.0514
3
0.0115
0.0097
0.157
0.0091
0.0078
0.0091
0.1223
0.0091
4
0.0023
0.0012
1.9318
0.0012
0.0009
0.0011
1.043
0.0011
) Table 4.9 U for error estimators using patch recovery
172
Chapter 4
σ x @ Point A (boundary) σ x = 150
σ~
σ~
σ x @ Point B (internal) σ x = 75 σh
σ~L
σ~b
σ~ p
106.43
\
\
\
\
134.39
134.39
69.62
68.47
68.47
68.47
144.70
142.29
142.29
73.48
73.30
73.30
73.30
147.39
146.10
146.10
74.57
74.56
74.56
74.56
Mesh
σh
σ~
1
111.70
106.43
106.43
2
135.60
136.61
3
143.92
4
147.05
L
b
p
Table 4.10 Recovered stresses at Points A and B for BMT2
EEL 1 2
2
n=0.98 1
n=1.95 n=1.82 n=1.02
finite element EEL, EEb and EEp
(a) Point A
(b) Point B
Figure 4.21 Convergence characteristics of error in recovered stress (BMT2)
For BMT6, where the mesh refinement is not uniform, we cannot determine the rate of convergence of point values of stress. Instead, however, the point values of the error in recovered stress are plotted against the mesh number. These graphs are shown in Figure 4.23. The corresponding point values of recovered stress are given in Tables 4.12 - 4.15.
σ x @ Point A (boundary) σ x = −750
τ xy @ Point B (internal) τ xy = 93. 75
Mesh
σh
σ~L
σ~b
σ~ p
σh
σ~L
σ~b
σ~ p
1
-608.42
-501.40
-667.33
-667.33
50.89
62.50
62.50
62.50
2
-682.14
-682.19
-721.77
-721.77
82.18
85.24
85.24
85.24
3
-716.53
-728.35
-735.89
-735.89
90.79
91.58
91.58
91.58
4
-733.30
-742.12
-742.93
-742.93
93.01
93.20
93.20
93.20
Table 4.11 Recovered stresses at Points A and B for BMT4 173
Chapter 4
finite element EEL, EEb and EEp
finite element EEL EEb and EEp n=1.00
n=1.46
n=2.00
2
n=1.00 1
2 n=1.98
1
(a) Point A
(b) Point B
Figure 4.22 Convergence characteristics of error in recovered stress (BMT4)
EEL
(a) σ x at Point A
EEL
(c) σ y at Point B
EEL
(b) σ x at Point B
EEL
(d) τ xy at Point B
Figure 4.23 Convergence characteristics of error in recovered stress (BMT6) 174
Chapter 4
σ x @ Point A (boundary) σ x = 30 , 000 σ 2h
σ~L
σ~b
σ~ p
23004.2
20539.2
10884.6
13191.6
17979.5
2
26973.0
25269.4
17585.2
22776.8
23065.2
3
29522.9
28681.2
23942.2
26270.3
26386.8
4
30325.9
30012.9
27813.2
28451.1
28468.5
Mesh
σ
1
1 h
Table 4.12 Recovered stresses at Point A for BMT6
σ x @ Point B (internal) σ x = 11216 . 02 Mesh
σ 1h
σ 2h
σ~L
σ~b
σ~ p
1
9762.57
9477.41
10016.48
10094.42
10016.80
2
10829.13
10734.18
10684.81
20687.06
10684.87
3
11118.59
11090.96
11044.98
10924.94
11045.89
4
11206.11
11198.52
11168.79
8313.12
11168.16
Table 4.13 Recovered stresses at Point B ( σ x - component) for BMT6
σ y @ Point B (internal) σ y = −1216. 02 Mesh
σ 1h
σ 2h
σ~L
σ~b
σ~ p
1
-296.46
-309.10
-63.50
-69.85
-63.49
2
-912.96
-879.23
-714.62
-2366.91
-714.66
3
-1111.68
-1100.11
-1053.74
-1061.11
-1053.96
4
-1189.42
-1186.14
-1172.12
-773.15
-1172.34
Table 4.14 Recovered stresses at Point B ( σ y - component) for BMT6
τ xy @ Point B (internal) τ xy = −800 . 02 Mesh
σ 1h
σ 2h
σ~L
σ~b
σ~ p
1
-784.60
-701.17
-716.11
-694.50
-716.21
2
-770.92
-752.55
-740.15
-3439.73
-739.96
3
-782.20
-777.39
-784.89
-843.67
-784.75
4
-790.58
-789.29
-796.26
-449.37
-796.81
Table 4.15 Recovered stresses at Point B ( τ xy - component) for BMT6 1
2
With respect to Tables 4.12 - 4.15 the values tabulated in the columns headed σ h and σ h are the nodal averaged stress for the two stress recovery schemes SRS1 and SRS2 respectively.
175
Chapter 4 With respect to the problems investigated the following observations are made:
i) A comparison of the results for BMT's 2 and 4, in which rectangular elements are used, shows that:
a) for internal nodes the recovered stresses for all error estimators using a patch recover scheme (EEL, EEb and EEp) are identical i.e. σ~ = σ~ = σ~ . L
b
p
b) for boundary nodes it is seen that σ~b = σ~ p ≠ σ~L . The results shown in Tables 4.13 - 4.15 demonstrate that even for the distorted elements of BMT6 σ~ and σ~ are very close to each other. L
p
ii) The equivalence between EEb and EEp is only retained so long as the orientation of the model in the global co-ordinate system does not cause illconditioning of the [A] matrix for EEb. Thus we see an equivalence for BMT's 2 & 4 but in BMT6 we see the phenomenon of θ dependence having a marked effect on the recovered stresses and, therefore, on the effectivity of EEb. The same phenomenon could be forced to occur for BMT's 2 and 4 by rotating the model 45 o in the global co-ordinate system.
iii) With respect to the rate of convergence of the recovered stress, based on the results for BMT's 2 and 4 we observe:
a) that for internal nodes the rate of convergence tends to be superconvergent (i.e. the gradient of the slopes of the curves in Figures 4.21b and 4.22b tends to 2) as the mesh is refined.
176
Chapter 4 b) that for boundary nodes the rate of convergence tends to the normal rate expected (i.e. the gradient of the slopes of the curves in Figures 4.21a and 4.22a tends to 1) for an arbitrary point value of stress as the mesh is refined.
It is thus seen that the claim made by Zienkiewicz in [ZIE 92a] that all nodal stresses recovered with a patch recovery scheme are superconvergent whilst appearing to hold for internal nodes does not hold for boundary nodes.
With respect to this point it is recorded here that the scheme
detailed in [ZIE 92a] for recovering the stresses at boundary nodes may now not be the recommended one. This will be the subject of further studies. What is interesting to note is that even for internal nodes the quality and rate of convergence of the stress recovered by a patch recovery scheme is generally no better than that achieved by simple nodal averaging of the finite element values.
For BMT6 it is seen that the quality of the σ x -component of the stress at Point A is strongly dependent upon the recovery scheme with the raw finite element stresses giving superior results to those achieved by the patch recovery schemes (see Figure 4.23a). With respect to this last point, note the observation already made in the closure of Chapter 3 that SRS1 yields superior results at points of stress concentration. For the internal Point B the difference is less marked with all recover schemes tending to give the same value as the mesh is refined. ) iv) Let us now look at the integral measures β and U . These quantities are
tabulated in Tables 4.8 and 4.9 respectively for BMT's 2, 4 and 6. The effectivity ratios for EEp are tabulated for all the benchmark tests in Table 4.5 and have been plotted in Figure 4.11. From these results it is seen that:
177
Chapter 4 a) all error estimators that use a patch recovery scheme appear to be asymptotically exact. b) as with the improvement noted in EE2 b over EE2 which was obtained through the simple expedient of applying the static boundary conditions, similar trends are also observed for the error estimators considered in this section with those that have had the static boundary conditions applied to them giving, in general, superior results to those that have not had the static boundary conditions applied.
(v)
Comparing the error estimator EEp, which uses a patch recovery
scheme, with those that use simple nodal averaging i.e. EE2 and EE2 b , it is seen that:
a) For the linear stress field benchmark tests (BMT's1 & 2) EEp is no more effective than the simple error estimator EE2 and, in the case of BMT2, is ) ) ) less effective than EE2 b . In terms of U it is seen for BMT2 that U 2b U p indicating that EEp produces an estimated stress field that is nearer to the true one than EE2 b .
d)
For BMT's 6 &7, for which we expect a slower rate of convergence
because of the strong stress gradients involved, it is again seen that EE2 b performs better than EE2 and EEp. In these cases, however, EEp performs significantly better than EE2. 178
Chapter 4 4.9 Comparison with other published results In this section the results for BMT4 are compared with those of other error estimators investigated by a group of researchers in Belgium [BEC 93]. The effectivity ratios for a number of error estimators discussed in this chapter are compared with those of these researchers in Table 4.16. ~ σ~( L2 ) σ~( Lm ) σ (α e Le )
Mesh
dof
EE1
EE2
EE4
EE 2 b
EEp
~ G
Jr
1
30
1.55
0.71
1.76
1.09
0.75
\
\
\
\
\
2
90
2.20
0.93
2.28
1.05
0.94
0.81
0.29
0.81
1.23
0.94
3
306
2.58
0.98
2.60
1.02
0.99
0.81
0.34
0.90
1.12
0.98
4
1122
2.78
1.00
2.79
1.01
1.00
0.81
0.37
0.96
1.06
1.00
Table 4.16 Comparison of β 's with published results [BEC 93] for BMT4 (four-noded element)
~ The error estimator denoted G is defined in [ZHO 91a] and is based on a nodal superconvergence assumption of the finite element displacement field. The error estimator denoted Jr is an extension by Kelly [KEL 83] of the error estimator proposed by Gago [GAG 82] and determines the error measures explicitly in terms of body force residuals and traction jumps. These error estimators are discussed in [BEC 93] and both quantify the error directly in terms of equilibrium defaults (residuals §1.3.3 of Chapter 1). In the context of the work contained in this chapter, in which error estimators using continuous estimated stress fields are examined, these error estimators will not be discussed further. The error estimators denoted σ~ ( L2 ) , σ~ ( Lm ) and σ~ (α e Le ) all use continuous estimated stress fields as defined in Equation 4.1 but differ in the way in which the unique nodal stresses are determined. Error estimator σ~ ( L2 ) is the one proposed by Zienkiewicz and Zhu [ZIE 87] in which the unique nodal stresses are determined by a global least squares fit between the 179
Chapter 4 estimated stress field of Equation 4.1 and the finite element stress field. Error estimator σ~ ( Lm ) is identical to σ~ ( L2 ) except that a so-called lumped mass approach is used for determining the system of equations which define the unique nodal stresses. The error estimator denoted σ~ (α L ) uses a e
e
method of averaging and extrapolation for determining the unique nodal stresses and is discussed in detail in [ZHO 90 & ZHO 91b]. In this method the unique nodal stress for an internal node is determined as a weighted average of the finite element stresses evaluated at the isoparametric centres of the surrounding elements. The weighting depends on the included angle at the node and the distance between the isoparametric centre and the node. For the rectangular elements considered in this problem the weighting factors are unity and, at least for internal nodes, the recovered stresses are identical to those that are achieved by EEp (note that it was observed (§4.7) that the unique nodal stresses for rectangular elements were simply the average of the Gauss point stresses). Although the effectivity ratios for error estimators σ~ ( L2 ) and σ~ ( Lm ) appear to be converging to unity, these error estimators are not as effective as error estimators EE2, EE2 b , EEp and error estimator σ~ (α e Le ) . It is seen that for Meshes 2,3 and 4, EEp and σ~ (α e Le ) are no more effective than EE2. For the coarser meshes where the various effectivity ratios are significantly different from each other, EE2 b is seen to be the most effective error estimator.
4.10 Closure In this chapter a number of error estimators have been defined, discussed and applied to the benchmark tests laid down in Chapter 3 of this thesis. In common to all these error estimators is the continuous estimated stress field of Equation 4.1. The differences between error estimators arise in the detail of how the unique nodal stresses are achieved (simple nodal averaging 180
Chapter 4 versus a patch recovery scheme) and/or in how the finite element stress field is defined (FESS) and the error stress field is integrated (NIS). In addition to these differences in detail we have also examined the effect of applying known static boundary conditions to the estimated stress field. It has been shown, through the benchmark tests examined in this chapter, that these details can cause significant differences in the effectivity of an error estimator.
With the exception of those error estimators that use nodal quadrature (NIS1), (EE1 and EE4) all error estimators appeared to be asymptotically exact.
It was proved that nodal quadrature always over-estimated the
integration of the strain energy of the estimated error (see Appendix 3).
It would appear from these results that consideration of the static boundary conditions is important for an effective error estimator. This point has been considered by other researchers in the field.
In particular Mashie et al
[MAS 93] have extended the patch recovery scheme of Zienkiewicz and Zhu [ZIE 92a] such as to include some consideration of equilibrium between the estimated stress field and the static boundary conditions. Their experience seems to be that their method is 'more accurate than the method of error analysis introduced by Zienkiewicz and Zhu'.
The Zienkiewicz and Zhu
method referred to here is the patch recovery scheme of [ZIE 92a].
Wiberg and Abdulwahab [WIB 93a and WIB 93b] also adopt a patch recovery scheme but use a statically admissible stress surface as opposed to the uncoupled polynomial one used by Zienkiewicz et al. Their experience seems to be that the approach 'gives a dramatic increase in the accuracy of the error estimation as compared to methods published earlier such as the ZZ-Method'. The ZZ-Method referred to here is the patch recovery method of Zienkiewicz and Zhu [ZIE 92a]. 181
Chapter 4 The results presented in this chapter tend to confirm the experience of Mashie et al. However, it is also noted from the results presented that, for the element under consideration in this thesis, the advantages of a patch recovery scheme over simply nodal averaging, are not clear cut especially when, in addition to simple nodal averaging the static boundary conditions are applied. It is appreciated, at this point, that for other element types the advantage may be more distinct.
It is seen then that a consideration of boundary equilibrium in the estimated stress field can lead to an improved error estimator. Now, by virtue of the continuous nature of the estimated stress field, interelement equilibrium is satisfied a priori.
Application of the static boundary
conditions leads, in addition, to satisfaction of equilibrium, in some sense, on the static boundary of the problem. However, the estimated stress field still violates internal equilibrium and this can be detected in the form of residual body forces (§1.3.3, Chapter 1). An alternative approach to error estimation is to determine an estimated stress field such that internal equilibrium is satisfied and it is this approach that will be examined in the following chapter. In Chapter 6 we shall investigate an iterative method which attempts to recover complete equilibrium.
182
Chapter 4
156
Chapter 4
σy
σx y
τxy y
x
y
x
x
(a) True stress field {σ }
(b) Finite element stress field {σ h }
) (c) Estimated stress field {σ~1}, ( β 2 = 1.00, U 2 = 22.93)
) (d) Estimated stress field {σ~2 }, ( β 2b = 1.02, U 2b = 0.36)
Figure 4.13 Stress fields for BMT1 and Mesh 1 (simple error estimators)
156
Chapter 4
σx
σy y
τxy y
x
y
x
x
(a) True stress field {σ }
(b) Finite element stress field {σ h }
) (c) Estimated stress field {σ~1}, ( β 2 = 0.71, U 2 = 103.73)
) (d) Estimated stress field {σ~2 }, ( β 2b = 0.82, U 2b = 7.76)
Figure 4.14 Stress fields for BMT2 and Mesh 1 (simple error estimators)
156
CHAPTER 5 ERROR ESTIMATION USING ESTIMATED STRESS FIELDS THAT ARE LOCALLY STATICALLY ADMISSIBLE
Summary This chapter is concerned with error estimators that use an elementwise estimated stress field which is statically admissible with the body forces for the true solution. The estimated stress field is determined by fitting it to the original finite element stress field in an element by element manner. A number of error estimators are defined and examined. It is noted that the effectivity of these error estimators is poor. In attempting to improve the effectivity of these error estimators the estimated stress field is fitted to a processed finite element stress field rather than the original one. The two continuous estimated stress fields discussed in Chapter 4 are used in place of the original finite element stress field. New error estimators are defined and it is found that by using such processed finite element stress fields the effectivity of an error estimator is greatly improved.
5.1 Introduction Estimated stress fields that are continuous were investigated in Chapter 4 of this thesis.
It was argued that since the true solution, in general,
possesses continuity of stress then so an estimated stress field that is continuous is likely to be a good one. However, properties other than the lack of continuity of stress may be used to reveal the approximate nature of the finite element solution.
In this chapter it will be argued that the
estimated stress field should be in equilibrium with the body forces for the true solution.
A set of stress fields that form a basis for the space of stress fields that are statically admissible with the body forces for the true solution are defined. These stress fields are then fitted to the finite element stress field in an ~ elementwise manner such that the strain energy of the estimated error U e is a minimum. 183
Chapter 5 5.2 Elementwise statically admissible estimated stress fields In this thesis we are considering cases where the true solution satisfies the homogeneous equations of equilibrium and, therefore, the estimated stress fields {σ~ } need to be statically admissible with zero body forces. The 3
estimated stress fields are defined as:
{σ~3 } = [h]{ f }
(5.1)
(3xnf)
where the matrix h contains nf independent modes of statically admissible stress fields: constant 1 0 0 x [h] = 0 1 0 0 0 0 1 − y
linear y 0 0
x
quadratic 0
x2
y
2
y
0 0 − x − 2 xy
y2
0
0
x
2
2 xy
0
0
− x2
0
2 xy 0 − y 2
The subscript 3 in {σ~3 } is used to distinguish this estimated stress field from those considered in the previous chapter.
These 12 stress fields form a basis for the space of the complete quadratic statically admissible stress fields. Although the complete quadratic stress fields are defined at this point, it will be shown later on in this chapter that for the element under consideration we may only use the linear set of stress fields.
As in Chapter 2, the first three stress fields ( f 1 , f 2 & f 3 ) are the constant ones. The stress fields corresponding to f 5 and f 6 are the constant moment stress fields and those corresponding to f 4 and f 7 are the linear endload stress fields. The quadratic stress fields f 9 and f 10 have parabolic normal tractions and are thus termed the parabolic endload stress fields. Similarly, 184
Chapter 5
f 11 and f 12 have parabolic tangential tractions and are, therefore, termed the parabolic shear stress fields.
The remaining stress field f 8 has self-
balancing tangential tractions and is termed the self-balancing shear stress field.
It is to be noted that although the constant and linear statically
admissible stress fields are automatically kinematically admissible (see Chapter 2, §2.5) this is not generally the case for the quadratic statically admissible stress fields. Of the quadratic statically admissible stress fields defined above the parabolic shear stress fields are kinematically admissible. In addition, whilst individually the parabolic endload stress fields are not kinematically admissible if combined such that f 9 = a and f 10 = − a the resulting stress field will be kinematically admissible.
Indeed this
combined stress field has been used in BMT3 (§3.4.3) with a = 1 . Of the twelve statically admissible stress fields, there is a sub-space of stress fields that are, in addition, kinematically admissible. The dimension of this subspace of statically and kinematically admissible stress fields is eleven.
5.3 Elementwise fitting of statically admissible stress fields Having defined the set of statically admissible stress field that are to be used in this chapter, we shall now define the fitting procedure. The estimated stress field {σ~3 } is fitted to the finite element stress field {σ h } ~ such that the strain energy of the estimated error U e is a minimum. The ~ strain energy of the estimated error U e is defined as: 1 T ~ 1 T T U e = { f } [ A][ f ] − { f } [L ]{δ } + {δ } [k ]{δ } 2 2
(5.2)
where
[A] = ∫ [h]T [D]−1[h] dV V
[L] = ∫ [h]T [B] dV V
[k ] = ∫ [B ]T [D][B ] dV V
A derivation of Equation 5.2 is given in Appendix 4.
185
Chapter 5 It is noted that the matrix A is the natural flexibility matrix for the element (§2.6, Equation 2.34) and the matrix k is the stiffness matrix for the element. Thus, the third term in Equation 5.2 represents the finite element strain energy U h .
Minimising the strain energy of the estimated error with respect to the amplitudes of the estimated stress field
{f }
means solving the following
equation:
∂ ∫ ({σ~3 } − {σ h })T [D ]−1 ({σ~3 } − {σ h }) dV ~ ∂U e = V = {0} ∂ {f } ∂ {f }
(5.3)
The solution to Equation 5.3 is given as:
{ f } = [A]−1[L]{δ }
(5.4)
where the matrices A and L are as defined in Equation 5.2. Note here that, provided the integration is performed exactly, the natural flexibility matrix
A
is non-singular [ROB 88].
The statement that
A
is non-
singular assumes that the integration is performed exactly.
~ The process of minimising U e can be seen to have certain similarities with the process described by Zienkiewicz and Zhu in [ZIE 87].
In the
minimisation process a local weighted least squares fit is made between {σ~3} and {σ h }. In [ZIE 87] a global (unweighted) least squares fit is performed between {σ~1} and {σ h }.
Now, in practice, the integration of the matrices
A
and
L
will be
performed using a numerical integration scheme (§2.7 of Chapter 2). An nxn Gauss quadrature scheme will be used the order (n) of which will be dependent on the number of stress fields nf used in the matrix h . The order of the quadrature scheme will be chosen such that it is just sufficient 186
Chapter 5 to perform the integrations exactly for a parallelogram element.
The
required integration schemes are detailed in Table 5.1.
nf
Gauss Scheme
3
1x1
7
2x2
12
3x3
Table 5.1 Gauss schemes for integration of the matrices A and L
Different estimated stress fields and therefore different error estimators will result from using different numbers of stress fields in our estimated stress field. Three sensible possibilities exist: we could use each of the sets of complete polynomials i.e. we could use nf = 3, 7 or 12 corresponding to complete constant, complete linear and complete quadratic polynomials.
Let us examine these possibilities in more detail. For the case where nf=3, we have that
h = I
(the identity matrix) and therefore the natural
flexibility matrix A = vol ⋅ D
−1
and L = vol ⋅ B
I
where B
I
is the matrix
B evaluated at the isoparametric centre of the element and vol is the
volume of the element. Thus we have that:
{ f } = [D][B]I {δ }
(5.5)
which means that the three components of the estimated stress field are equal to the corresponding components of the finite element stress field evaluated at the isoparametric centre of the element. In otherwords, with ~ nf=3 minimising U e is equivalent to exact fitting of the estimated stress field to the values of the finite element stress field at the isoparametric centre of the element.
187
Chapter 5 Now, for the parallelogram element the finite element stress field is linear. It has been demonstrated (see Appendix 5) that for such elements the quadratic stress fields in the estimated stress field will not be invoked in the fit and the same estimated stress field is achieved by using nf=7 as would be obtained by using nf=12. Although this is not the case for tapered elements, since the taper in an element tends to zero as the mesh is refined we shall not consider the case where nf=12 further. 5.4 Group 1 error estimators In this section two error estimators are defined as shown in Table 5.2. These error estimators are termed the Group 1 error estimators in order to distinguish them from Group 2 and Group 3 error estimators which will be discussed later on in this chapter. Error estimator
nf
Gauss quadrature scheme
EE5
3
1x1
EE6
7
2x2
Table 5.2 Group 1 error estimators
5.5 Performance of the Group 1 error estimators The performance of the Group 1 error estimators are discussed in this section.
The error measures and effectivity ratios for the various
benchmark tests have been tabulated in Table 5.3. The effectivity ratios for the convergence type benchmark tests are plotted in Figure 5.1 and for the distortion test (BMT8) in Figure 5.10a.
Before discussing the performance of the Group 1 error estimators let us begin by reminding ourselves of the effectivity of the error estimators discussed in Chapter 4 of this thesis. In Chapter 4 we noted that, with the exception of those error estimators which used nodal quadrature, all error estimators were asymptotically exact: the effectivity ratios of these error estimators converged asymptotically to unity as the mesh was refined. This was the case for all the benchmark tests that were examined. In contrast to 188
Chapter 5 this behaviour, it is seen from the results presented in this section that none of the Group 1 error estimators are asymptotically exact. The Group 1 error estimators produce effectivity ratios which, in general, appear to be converging to values other than unity. It is also observed that the values to which the effectivity ratio converges are dependent on the error estimator used and the benchmark test examined.
If the converged values of the
effectivity ratio were consistently close to unity (an acceptable range for the effectivity ratio has been given in [MAU 93a] as 0. 64 ≤ β ≤ 1. 44 ) then these error estimators might still be useful however, as it is, with converged values of β ranging between 0.01 and 5.58, these error estimators are sufficiently inaccurate to be of little practical use.
Having made such a statement, it is necessary to investigate why this has turned out to be the case. After all, the initial premise on which these error estimators were devised appeared, at least intuitively, to be sound. However, before taking this investigation further let us make the following observation.
It is noted that for the Group 1 error estimators the effectivity ratios always conform to the following inequality:
β5 ≥ β6
(5.6)
This behaviour can be explained in the following manner. For both EE5 and EE6 the estimated stress fields are found such that the strain energy of the ~ estimated error U e is a minimum. The difference between these two error estimators is that for EE5 the estimated stress field is constant whilst for EE6 it is linear. The fit between the estimated stress field and the finite element stress field will be closer for EE6 than for EE5 since there are more stress fields involved in the fit. 189
Chapter 5 Returning now to the question of why the Group 1 error estimators have turned out to be ineffective, let us consider BMT1. The various stress fields for BMT1 are shown in Figure 5.2. It was observed in Chapter 4 (§4.6) that the σ x - and τ xy -components of the finite element stress field were sensibly constant.
Error estimator EE5 has estimated stress fields which are
constant having the values of the finite element stress field evaluated at the isoparametric centre of the element. As such, the σ x - and τ xy -components of the estimated stress field will be close to the finite element ones. The σ y component of the finite element stress is sensibly linear and the same component of the estimated stress is therefore small. Thus, because the estimated stress field is closer to the finite element stress field than the true stress field, the error estimation is not effective (β 5 = 0 . 056 ). The fact that the estimated stress field is close to the finite element stress field means that the finite element stress field is close to satisfying the equations of equilibrium i.e. at the element level
{σ h }
is close to being statically
admissible.
A similar trend is observed for EE6. For this error estimator, however, the estimated stress field is linear and the fit between the estimated stress field and the finite element stress field is such that the estimated stress field is even closer to the finite element stress field than was the case for EE5 (note that the major difference is in the σ y -component of stress, see Figure 5.2). For this reason EE6 is even less effective than EE5.
The stress fields for BMT2 are shown in Figure 5.3. It is seen that for EE5 the σ y - and τ xy -components of the estimated stress are identical to the true stress. The σ x -component, on the other hand, takes on a constant value equal to the value of the finite element stress at the isoparametric centre and is quite different from the true distribution. For EE5 an effectivity ratio of β 5 = 1.143 is returned showing that, in this case, the estimated stress 190
Chapter 5 field is a good representative of the true stress field in an integral sense. However, this single result, which at first sight looks fairly good, must not be taken out of context for as the mesh is refined the effectivity ratio becomes further removed from unity. For EE6, the σ x -component of the estimated stress field is very close to the finite element component whilst the σ y - and τ xy -components are quite different from the true components. In this case the effectivity is β 6 = 0 .185 and although improving with mesh refinement appears to be converging to a value much lower than unity (β 6 → 0 . 26 as h → 0 ).
For the other benchmark tests similar trends are observed with generally poor
effectivity
ratios
and
asymptotically
inexact
convergence
characteristics. Thus, in terms of effectivity, the Group 1 error estimators are much less effective than those studied in the previous chapter.
In
Chapter 3 of this thesis the strain energy of the error of the estimated stress ) field U was defined. This quantity measures the proximity of the estimated stress field to the true one in an integral sense. Table 4.6 of Chapter 4 ) tabulates U for selected error estimators and Figure 4.12 shows how this ) quantity varies as a mesh is refined. In Table 4.6, the column headed U 36 ) lists the quantity U for EE6. It was noted in Chapter 4 that, in addition to an improvement in the effectivity of an error estimator, application of the static boundary conditions had the additional benefit of making the ) estimated stress field near to the true one i.e. U 2b (corresponding to EE2 b ) ) ) was generally less than U 2 (corresponding to EE2). By comparing U 2b with ) ) ) U 36 it is seen that, in general, U 36 is greater than U 2b . As such, in addition to having poor effectivity, this error estimator (EE6) also has an estimated stress field that is further away from the true one than the estimated stress field {σ~ }. 2
191
Chapter 5
BMT
BMT1
BMT2
BMT3
BMT4
BMT5
BMT6
BMT7
BMT8
BMT9
Mesh
Error measures α~ α~ α 5
6
Effectivity ratios β5
β6
1
24.314
1.766
0.290
0.056
0.009
2
6.084
0.399
0.065
0.062
0.010
3
1.522
0.100
0.016
0.065
0.011
4
0.381
0.025
0.004
0.066
0.011
1
29.045
31.873
7.040
1.143
0.185
2
9.157
12.734
2.308
1.448
0.234
3
2.474
3.809
0.637
1.561
0.253
4
0.633
1.007
0.164
1.596
0.258
1
2.635
11.909
2.142
4.995
0.809
2
0.707
3.688
0.616
5.381
0.871
3
0.183
1.001
0.163
5.523
0.894
4
0.046
0.258
0.042
5.577
0.903
1
12.449
21.923
6.112
1.975
0.458
2
3.418
6.972
1.708
2.118
0.491
3
0.878
1.887
0.444
2.170
0.503
4
0.221
0.483
0.112
2.188
0.507
1
16.60
2.568
0.425
0.132
0.021
2
4.32
0.688
0.112
0.153
0.025
3
1.10
0.181
0.029
0.164
0.027
4
0.27
0.047
0.008
0.170
0.028
1
2.601
1.079
0.353
0.403
0.131
2
1.021
0.631
0.137
0.611
0.132
3
0.333
0.253
0.048
0.756
0.144
4
0.093
0.078
0.014
0.830
0.148
1
22.935
7.946
1.378
0.290
0.047
2
14.164
5.310
0.900
0.340
0.055
3
8.284
3.393
0.565
0.389
0.063
4
4.602
2.064
0.340
0.437
0.071
1
29.05
31.873
7.040
1.143
0.185
2
30.91
30.193
7.281
0.958
0.174
3
36.49
25.266
7.219
0.572
0.132
4
45.53
17.561
5.698
0.244
0.069
5
57.05
8.541
2.809
0.067
0.021
1
57.047
8.541
2.809
0.067
0.021
2
24.344
13.156
5.808
0.463
0.189
3
7.731
5.561
2.258
0.699
0.274
4
2.122
1.692
0.670
0.793
0.311
Table 5.3 Error measures and effectivity ratios for Group 1 error estimators 192
Chapter 5
193
Chapter 5
194
Chapter 5
195
Chapter 5 5.6 Group 2 error estimators In the previous section it was seen that statically admissible estimated stress fields that are fitted to the original finite element stress field resulted in error estimators which were, in general, ineffective. The reason for this lack of effectivity was demonstrated to be that, whilst the finite element stress field might be greatly in error, the error may manifest itself in the form of a lack of interelement equilibrium rather than a lack of internal equilibrium. As such, error estimators, such as those in Group 1, which fit a statically admissible estimated stress field to the original finite element stress field may not detect the true extent of the error. A possible way to overcome this problem is to fit the estimated stress field to one which already satisfies interelement equilibrium. In Chapter 4 of this thesis estimated stress fields {σ~ } that were continuous across element interfaces 1
were considered.
Such stress fields automatically satisfy interelement
equilibrium. Further, estimated stress fields that, in addition to satisfying interelement equilibrium, were in equilibrium with the static boundary conditions {σ~2 } were also considered. Thus either of these stress fields could be considered as suitable candidates for fitting a statically admissible stress field to. Both these options will be considered in this chapter.
In this section we will consider determining a statically admissible estimated stress field {σ~3 } by fitting it to the continuous estimated stress field {σ~1} of Chapter 4. Two error estimators EE7 and EE8 are investigated and are termed the Group 2 error estimators. These error estimators are identical to EE5 and EE6, respectively, but use the continuous stress field {σ~ } of Chapter 4 in place of the original finite element stress field {σ }. In 1
h
order to determine the estimated stress field for an element we minimise the strain energy of the error between the estimated stress field {σ~ } and 3
the continuous stress field {σ~1}:
196
Chapter 5
∂ ∫ ({σ~3 }− {σ~1 })T [D]−1 ({σ~3 }− {σ~1 }) V
∂ {f }
= {0}
(5.7)
which leads to:
{ f } = [A]−1[M ]{sa }
(5.8)
[ ]
where A is the natural flexibility matrix and [M ] = ∫ [h] [D ] N dV . Note T
−1
V
that the matrix N is the matrix of element shape functions as defined in Equation 4.1 and {sa } is the vector of unique nodal stresses achieved by simple nodal averaging.
~ It should be pointed out that the strain energy of the estimated error U e is not minimised by this procedure and remains as defined by Equation 5.2.
5.7 Performance of Group 2 error estimators The error measures and effectivity ratios for the Group 2 error estimators are tabulated in Table 5.4. The effectivity ratios are plotted in Figures 5.4 and 5.10b.
Comparing these results with those of the Group 1 error
estimators it is immediately obvious that the Group 2 error estimators are superior. In particular it is seen that EE8 seems to be asymptotically exact. Error estimator EE7, on the other hand, is definitely not asymptotically exact and its effectivity is strongly dependent on the benchmark test being considered. Comparing the effectivities of EE8 with those of EE2 (see Table 5.6) it is seen that, with the exception of BMT3, error estimator EE8 appears to be generally more effective. In addition, by comparing the strain ) energy of the error of the estimated stress fields ( U 2 corresponding to EE2 ) and U 38 corresponding to EE8), as tabulated in Table 4.6 and plotted in Figure 4.12 of Chapter 4, it is seen that with the single exception of BMT6, ) Mesh1 (which was already commented on in section 4.6) U 38 is smaller than 197
Chapter 5 ) U 2 . Thus, the additional processing involved in mapping the continuous
estimated stress field {σ~1} into the statically admissible stress field {σ~3 } generally results in an improved effectivity (noting the exception of BMT3) and an estimated stress field which is closer to the true one.
Having demonstrated that EE8 may be considered as an improvement over the simple error estimator EE2, we shall now compare it with EE2 b which is identical to EE2 in all respects except that the static boundary conditions have been applied. The effectivity ratios β 2 , β 2b and β 8 are shown in Table 5.6.
By comparing the effectivity ratios β 8 and β 2b for these two error
estimators, it is seen that the error estimator EE2 b is far superior to EE8. This observation is confirmed by looking at the strain energy of the error of the estimated stress fields which are tabulated in Table 4.6. Here it is seen ) ) that U 2b is smaller than U 38 (with the noted exception of BMT6, Mesh1). In ) some cases c.f. BMT's 1 and 2, U 2b is several orders of magnitude smaller ) than U 38 . Thus, the error estimators considered in this section do not improve on EE2 b of Chapter 4. The stress fields for BMT's 1 and 2 are shown in Figures 5.5 and 5.6 respectively.
In the quest to improve on EE2 b we shall now investigate error estimators using statically admissible stress fields {σ~ } that are fitted to the 3
continuous, boundary admissible stress field {σ~2 } of Chapter 4.
198
Chapter 5
BMT
BMT1
BMT2
BMT3
BMT4
BMT5
BMT6
BMT7
BMT8
BMT9
Mesh
Error measures α~ α~ α 7
8
Effectivity ratios β7
β8
1
24.314
20.542
24.409
0.805
1.005
2
6.084
2.750
5.941
0.437
0.975
3
1.522
0.388
1.492
0.252
0.980
4
0.381
0.061
0.376
0.160
0.988
1
29.045
40.677
25.775
1.675
0.848
2
9.157
15.249
9.140
1.785
0.998
3
2.474
4.227
2.529
1.740
1.023
4
0.633
1.064
0.645
1.687
1.019
1
2.635
12.977
3.624
5.510
1.389
2
0.707
3.897
0.909
5.698
1.289
3
0.183
1.034
0.215
5.707
1.178
4
0.046
0.263
0.051
5.679
1.103
1
12.449
24.699
11.815
2.307
0.942
2
3.418
7.902
3.611
2.425
1.059
3
0.878
2.046
0.923
2.357
1.051
4
0.221
0.506
0.228
2.290
1.032
1
16.60
12.841
14.128
0.740
0.826
2
4.32
2.492
4.008
0.566
0.925
3
1.10
0.451
1.059
0.408
0.965
4
0.27
0.085
0.273
0.310
0.992
1
2.601
1.666
0.9578
0.626
0.3574
2
1.021
0.928
0.5138
0.901
0.4968
3
0.333
0.348
0.2105
1.044
0.6302
4
0.093
0.102
0.0699
1.089
0.7440
1
22.935
11.264
6.622
0.427
0.238
2
14.164
8.895
6.986
0.592
0.455
3
8.284
5.669
4.455
0.665
0.516
4
4.602
3.449
2.714
0.741
0.578
1
29.05
40.677
25.775
1.675
0.848
2
30.91
39.454
25.539
1.444
0.760
3
36.49
36.100
24.891
0.956
0.561
4
45.53
31.666
24.596
0.531
0.374
5
57.05
29.264
28.889
0.298
0.293
1
57.047
29.264
28.889
0.298
0.293
2
24.344
24.808
22.108
1.009
0.868
3
7.731
7.998
7.875
1.032
1.015
4
2.122
2.032
2.189
0.955
1.030
Table 5.4 Error measures and effectivity ratios for Group 2 error estimators 199
Chapter 5
200
Chapter 5
201
Chapter 5
202
Chapter 5 5.8 Group 3 error estimators In this section the statically admissible stress field {σ~3 } is fitted to the continuous, boundary admissible stress field {σ~2 } of Chapter 4. Two error estimators are investigated and are designated EE9 and EE10. These error estimators are identical to EE7 and EE8 respectively but use the continuous, boundary admissible stress field {σ~2 } in place of the continuous stress field {σ~1}. Minimising the strain energy of the error between {σ~3 } and
{σ~2 } means that: ∂ ∫ ({σ~3 } − {σ~2 })T [D]−1 ({σ~3 } − {σ~2 }) V
∂ {f }
= {0}
(5.9)
which leads to:
{ f } = [A]−1[M ]{sa* }
(5.10)
where A and M are the same as in Equation 5.8.
~ Note as in the Group 2 error estimators, U e is not minimised and remains as defined in Equation 5.2.
5.9 Performance of Group 3 error estimators The error measures and effectivity ratios for the Group 3 error estimators are tabulated Table 5.5. The effectivity ratios are plotted in Figures 5.7 and 5.10c. From these results it is seen that EE10 (c.f. EE8 of the Group 2 error estimators) appears to be asymptotically exact. Similarly to EE7, it is seen that EE9, which uses constant stress fields, is not asymptotically exact. Figure 5.11 compares the effectivity of EE10 with those of a number of error estimators discussed in Chapter 4. In this figure the effectivity ratios are plotted using a linear-linear scaling.
The reason for this is that the
differences between the effectivity of the error estimators considered would be fairly indistinguishable on the standard log-log graph.
From these
results it is seen that as the mesh is refined the error estimators EE10 and 203
Chapter 5 EE2 b have very similar effectivity ratios.
This is the case for all the
problems considered. By comparing the two stress fields {σ~2 } and {σ~3 } (Figures 4.13d with 5.8d for BMT1 and Figures 4.14d with 5.9d for BMT2) it is seen that the stress fields are not the same. Thus we have two stress fields that, whilst not being the same in a pointwise sense, provide effectivity ratios that are very close to each other. If we examine the strain energy of the error of the ) estimated stress field U as tabulated in Table 4.6 and plotted in Figure 4.12 ) ) of Chapter 4, it is seen that for BMT's 1,2,3,8 and 9 U 310 is less than U 2b indicating that the estimated stress field for EE10 is closer to the true one ) than {σ~2 }. This is not always the case but even where U 310 is greater than ) ) U 2b it still remains close to U 2b .
204
Chapter 5
BMT
BMT1
BMT2
BMT3
BMT4
BMT5
BMT6
BMT7
BMT8
BMT9
Mesh
Error measures α~ α~ α 9
10
Effectivity ratios β9
β 10
1
24.314
2.283
24.702
0.073
1.021
2
6.084
0.504
6.206
0.078
1.021
3
1.522
0.116
1.542
0.075
1.014
4
0.381
0.028
0.383
0.072
1.008
1
29.045
33.148
24.888
1.211
0.810
2
9.157
12.882
8.519
1.467
0.924
3
2.474
3.822
2.416
1.566
0.976
4
0.633
1.008
0.629
1.598
0.993
1
2.635
12.504
3.015
5.280
1.149
2
0.707
3.749
0.733
5.474
1.037
3
0.183
1.007
0.185
5.554
1.010
4
0.046
0.259
0.047
5.588
1.005
1
12.449
24.494
13.176
2.282
1.067
2
3.418
7.407
3.586
2.261
1.051
3
0.878
1.927
0.895
2.218
1.019
4
0.221
0.486
0.223
2.202
1.006
1
16.60
5.825
17.601
0.311
1.073
2
4.32
1.103
4.535
0.247
1.052
3
1.10
0.231
1.132
0.209
1.032
4
0.27
0.053
0.281
0.191
1.024
1
2.601
1.519
1.572
0.570
0.590
2
1.021
1.139
1.130
1.109
1.100
3
0.333
0.363
0.351
1.087
1.053
4
0.093
0.092
0.088
0.980
0.940
1
22.935
13.246
13.916
0.513
0.543
2
14.164
10.171
9.677
0.686
0.649
3
8.284
6.816
6.297
0.810
0.744
4
4.602
4.164
3.796
0.901
0.818
1
29.05
33.148
24.888
1.211
0.810
2
30.91
32.707
26.982
1.077
0.819
3
36.49
31.847
32.585
0.791
0.818
4
45.53
31.788
40.568
0.534
0.783
5
57.05
33.755
50.077
0.367
0.723
1
57.047
33.755
50.077
0.367
0.723
2
24.344
20.037
21.533
0.766
0.839
3
7.731
6.923
7.545
0.883
0.969
4
2.122
1.868
2.131
0.877
1.003
Table 5.5 Error measures and effectivity ratios for Group 3 error estimators 205
Chapter 5
206
Chapter 5
207
Chapter 5
208
Chapter 5
(a) Group 1 error estimators
(b) Group 2 error estimators
(c) Group 3 error estimators
Figure 5.10 Error measures and effectivity ratios for BMT8 209
Chapter 5
Effectivity ratios BMT
BMT1
BMT2
BMT3
BMT4
BMT5
BMT6
BMT7
BMT8
BMT9
Mesh
β2
β b2
β8
β 10
1
1.00
1.02
1.005
1.021
2
1.00
1.02
0.975
1.021
3
1.00
1.01
0.980
1.014
4
1.00
1.01
0.988
1.008
1
0.71
0.82
0.848
0.810
2
0.91
0.92
0.998
0.924
3
0.97
0.98
1.023
0.976
4
0.99
0.99
1.019
0.993
1
0.78
1.16
1.389
1.149
2
0.92
1.03
1.289
1.037
3
0.97
1.01
1.178
1.010
4
0.99
1.00
1.103
1.005
1
0.71
1.09
0.942
1.067
2
0.93
1.05
1.059
1.051
3
0.98
1.02
1.051
1.019
4
1.00
1.01
1.032
1.006
1
0.82
1.09
0.826
1.073
2
0.94
1.05
0.925
1.052
3
0.97
1.03
0.965
1.032
4
1.0
1.02
0.992
1.024
1
0.28
0.88
0.3574
0.590
2
0.45
1.13
0.4968
1.100
3
0.59
1.04
0.6302
1.053
4
0.71
0.93
0.7440
0.940
1
0.23
0.53
0.238
0.543
2
0.45
0.64
0.455
0.649
3
0.51
0.73
0.516
0.744
4
0.57
0.81
0.578
0.818
1
0.71
0.82
0.848
0.810
2
0.60
0.81
0.760
0.819
3
0.37
0.81
0.561
0.818
4
0.20
0.82
0.374
0.783
5
0.13
0.81
0.293
0.723
1
0.13
0.81
0.293
0.723
2
0.66
0.81
0.868
0.839
3
0.90
0.93
1.015
0.969
4
0.97
0.98
1.030
1.003
Table 5.6 Comparison of selected effectivity ratios 210
Chapter 5
211
Chapter 5 5.10 Closure The aim of the investigations carried out in this chapter was to see if a statically admissible stress field {σ~3 } which is fitted to the finite element stress field in an element by element manner provides an effective error measure. The answer to this question is clearly no, at least for the type of element under consideration, and this simply goes to reinforce the findings of other researchers [ZIE 89] who have studied in this area.
Having
understood that the reason for this poor effectivity was due to the fact that the error in the finite element solution tended to manifest itself in the form of stress discontinuities between elements rather than a lack of internal equilibrium, the same fitting procedures were used, firstly on the continuous stress field {σ~1}, and secondly, on the continuous, boundary admissible stress field {σ~2 } of Chapter 4. Provided that linear stress fields were used in the estimated stress field {σ~3 } it was seen that the resulting error estimators were asymptotically exact.
The results for the error estimators considered in this chapter were compared with those of Chapter 4 for which the estimated stress field was continuous. This comparison was made in terms of the effectivity ratio β ) and the strain energy of the error of the estimated stress field U . The Group 2 and Group 3 error estimators studied in this chapter can be looked upon as extensions to the error estimators EE2 and EE2 b in that they use as their initial stress field the continuous stress fields {σ~ } and {σ~ } 1
2
respectively. Additional computational effort is expended in mapping these initial stress fields into ones which are statically admissible and this additional effort should be justified. A comparison of the results has shown that the effectivities of the corresponding error estimators are nearly identical i.e. β 2 ≈ β 8 and β b2 ≈ β 10 and, as such, on the basis of effectivity alone one can probably not justify this additional effort.
However, a
comparison of the strain energy of the error of the estimated stress fields 212
Chapter 5 ) ) ) has shown that, whilst U 38 is always close to U 2 , and U 310 is always close to ) ) ) ) ) U 2b , for many cases we can state that U 38 < U 2 and U 310 < U 2b i.e. the additional
effort expended in mapping {σ~1} and {σ~2 } into locally statically admissible stress fields is worthwhile on the basis that the resulting stress field can often be pushed nearer to the true one in an integral sense.
By considering the way in which the estimated stress field is achieved for the Group 3 error estimators, one sees that the process of mapping the basic finite element stress field {σ } into the statically admissible stress field {σ~ } 3
h
goes through a number of stages each of which involves enforcing a particular aspect of equilibrium.
Thus, we start with the original finite
element stress field {σ h }, this is then mapped into the continuous stress field {σ~1} which satisfies interelement equilibrium.
The static boundary
conditions are then applied to obtain {σ~2 } which then satisfies boundary equilibrium in addition to interelement equilibrium.
Finally,
{σ~2 }
is
mapped into the statically admissible stress field {σ~3 } and, in general, boundary and interelement equilibrium are lost.
It has not been the explicit aim of the work conducted in this chapter to achieve full equilibrium both within the element and at the boundaries of the element. However, as discussed in Chapter 1 of this thesis, this is a desirable and worthy aim since, if a fully equilibrating estimated stress field could be achieved, then an upper bound on the strain energy of the true error can be determined. In the following chapter an iterative process is considered which aims to recover the equilibrium interelement and boundary equilibrium that is lost when the estimated stress field {σ~ } is 2
transformed into the statically admissible stress field {σ~3 }
213
CHAPTER 6 Error estimation using estimated stress fields that are globally statically admissible
Summary This chapter investigates an iterative method which attempts to map the original finite element stress field into one which satisfies equilibrium globally. The method builds on the work contained in the previous two chapters. The iterative method is applied to the benchmark tests and the results are discussed.
6.1 Introduction In the previous chapter of this thesis, error estimators using estimated stress fields {σ~3 } that were elementwise statically admissible with the body forces for the true solution {σ } were examined.
Initially, the estimated
stress field was determined by fitting it to the original finite element stress field {σ h }, however, investigations showed this approach to be disappointing in terms of the effectivity of the error estimator. The continuous estimated stress fields {σ~1} and {σ~2 } of Chapter 4 were then used in place of the original finite element stress field {σ h } and it was seen that by fitting the estimated stress field {σ~3 } to these, so-called, processed finite element stress fields, rather than to the original finite element stress field, the effectivity of an error estimator was improved. The most effective error estimation was achieved by using the estimated stress field {σ~ } which, in addition to being 2
continuous, also satisfied the static boundary conditions for the problem.
Now, although the effectivities were approximately equal, the stress fields {σ~ } and {σ~ } were not the same. The difference between the two stress 3
2
) fields was detected in the quantity U .
The stress field {σ~3 } satisfied 214
Chapter 6 internal element equilibrium but violated interelement equilibrium and did not satisfy the static boundary conditions for the problem, whereas the stress field {σ~ } satisfied the static boundary conditions, satisfied 2
interelement equilibrium but violated internal equilibrium. Thus both the estimated stress fields satisfy some, but not all, of the conditions of equilibrium.
One might, therefore, pose the question, 'can we somehow
combine the methods discussed in the previous two chapters to give us an approach which results in an estimated stress field which satisfies all the conditions of equilibrium simultaneously?'
In this chapter an iterative
method aimed at doing this will be examined.
6.2 The iterative method The iterative method proposed in this chapter combines the methods for enforcing the various aspects of equilibrium discussed in the previous two chapters. Each aspect of equilibrium is forced in sequence with the aim of achieving a solution in stress which satisfies equilibrium in a strong sense. The proposed method is shown schematically in Figure 6.1.
The starting point for the iterative method is a vector of initial nodal stresses {sˆ} for the model. If the method produces a final solution that is independent of the initial nodal stresses, then this may be chosen arbitrarily. We could, for example, set the initial stresses to zero. However, since this method is being discussed in the context of error estimation for the finite element solution, the initial nodal stresses could also be set to the values resulting from the finite element analysis:
{sˆ} = {sˆa } or {sˆ} = {0}
(6.1)
215
Chapter 6 Initialise nodal stresses
Force interface equilibrium
σ
Force boundary equilibrium
σ
Force internal equilbrium
σ
No
1
2
3
Convergence?
Yes
Figure 6.1 Schematic diagram of the iterative method
Strong interface equilibrium is achieved when the shear stress parallel to, and the direct stress normal to an interface are continuous. Continuity of the remaining component of stress (the direct stress tangential to the interface) is not required. However, since, for a large class of problems, the true solution possesses full continuity of stress then continuity of all three components of stress will be enforced.
Continuous stress fields can be
achieved by interpolating from unique nodal stresses {sa } over an element with its shape functions N as discussed in Chapter 4.
{σ~1} = [N ]{sa }
(6.2)
The unique nodal stresses {sa } are obtained from the finite element stresses by a process of simple nodal averaging (§4.3).
The continuous stress field
{σ~1}
satisfies interelement equilibrium but
violates boundary equilibrium and internal equilibrium. The next stage in 216
Chapter 6 the iterative method is to enforce equilibrium on the static boundary. This is done by modification of the appropriate components of the nodal stresses
{sa }
for those nodes that lie on the static boundary. This process results in
the continuous, boundary admissible stress field {σ~2 } as defined in Chapter 4 (§4.5):
{σ~2 } = [N ]{sa* }
(6.3)
Internal equilibrium within each element is satisfied if the stress field is statically admissible with the true body forces. The elementwise statically admissible stress field {σ~ } of Chapter 5 will be used: 3
{σ~3 } = [h]{ f }
(6.4)
The statically admissible stress field of Equation 6.4 is fitted to the continuous boundary admissible stress field of Equation 6.3 by minimising the strain energy of the error between the stress fields {σ~ } and {σ~ } as 2
3
discussed in Chapter 5. Thus, after the first iteration the estimated stress field {σ~ } will be identical to that used by the Group 3 error estimator EE10 3
in the previous chapter.
It is seen, therefore, that the iterative method successively maps a stress field from one that satisfies interelement equilibrium {σ~1}, to one which satisfies interelement equilibrium and boundary equilibrium {σ~2 }, to one which satisfies internal equilibrium {σ~3 } .
At each stage of the process
different aspects of equilibrium are satisfied and the remaining aspects of equilibrium are generally violated.
For the second and subsequent iterations the initial nodal stresses are replaced with ones from {σ~ } evaluated at the element nodes. The iterations 3
are continued until convergence has been achieved. This last statement 217
Chapter 6 assumes that convergence will actually occur i.e. that divergence will not occur.
Assuming for the moment that convergence to an equilibrium
solution does occur the question of precisely what is meant by convergence must be answered. For a particular model with a given set of admissible modes of stress within each element the model could be hypo-static, isostatic or hyper-static. If the model is hypo-static it means that there will be certain modes of applied loading which the model cannot support i.e. spurious kinematic modes will be present within the model. If the model is iso-static then the model is statically determinate and there is a unique solution for all modes of applied load. If the model is hyper-static then the model is statically indeterminate and there will be an infinity of solutions to any given mode of applied load resulting from the presence of self-stressing1 modes of stress within the model.
Thus, although ideally the iterative method should converge to a solution in stress that satisfies equilibrium in a strong, point-by-point, sense it may be the case, if the model is hypo-static, that no equilibrium solution is recovered. If the model is iso-static and if the true solution is contained in the modes of statically admissible stress h
then the iterative method
should recover it. If the model is hyper-static then the iterative method will recover one of the infinity of possible solutions.
The questions of
convergence of the iterative method and of the statical determinacy of a particular model can be investigated mathematically and this is done in the following section. 6.3 Mathematics of the iterative method The mathematics for the iterative method is defined in this section and makes use of many of the concepts and definitions made in previous chapters. The vector of initial nodal stress {sˆ} for the model is given as: 1a
self-stressing mode is a mode of stress that satisfies the equations of equilibrium with zero loads.
218
Chapter 6
{sˆ} = s 1, s 2 L s ne T
(6.5)
(12 nex1)
where (§3.3, Equation 3.19)
{s}i = [H1 ]i {δ }i
is the vector of finite element
stresses for element i recovered at the nodes using SRS1.
[]
Through the matrix Eˆ (§4.3, Equation 4.3), the nodal stresses are averaged to give a set of unique nodal stresses {sˆa } for the model:
{sˆa } = [Eˆ ]{sˆ} (12 nex1)
where
{sˆa } = sa 1 , sa 2 L sa ne T
(6.6)
(12 nex1)
and
{sa }i
is the vector of unique nodal
stresses for element i.
[ ]
At this point the continuous stress field {σ~1 } = N {s a } can be determined.
The static boundary conditions are now applied as described in Chapter 4 (§4.5, Equation 4.6):
{s }= [Q]{s }+ {g} * a
(6.7)
a
[ ]{ } can be
and the continuous, boundary admissible stress field {σ~2 } = N s a* formed.
The statically admissible estimated stress field {σ~3 } = [h]{ f } can now be formed by determining the vector
{ f } in such a way that the energy of the
error stress field {σ~3 }− {σ~2 } is minimised element by element. Thus, (§5.8):
{ f } = [A]−1[M ]{sa* }
(6.8) 219
Chapter 6 where, as defined in Chapter 5:
[A] = ∫ [h]T [D]−1[h] dV V (7 x7)
and [M ] = ∫ [h]T [D]−1 N dV
(6.9)
[ ]
V ( 7 x12 )
Finally, a new vector of nodal stresses, for each element, is determined by evaluating the statically admissible estimated stress field {σ~ } at the nodes 3
of the element:
{s} = [h ]{ f } (12 x1)
T
T
T
where h = h 1 , h 2 , h 3 , h
T 4
T
(6.10)
( 7 x1)
and h i is the matrix h evaluated at node
i.
This, in essence, is the mathematics of the iterative method. The individual steps discussed above may be combined to form a single recursive equation for the model by considering each equation at the model level.
In the following exposition some of the equations used above have been 'augmented' from the element level to the model level. Where this is the case the relevant matrices and/or vectors that have been augmented are indicated by the hat (^) symbol. Note that in the following equations the subscript i represents the ith iteration.
220
Chapter 6
{sˆ} = [Hˆ ]{δˆ}or {sˆ} = {0} 1
1
1
{sˆ } = [Eˆ ]{sˆ} i
a i
(12nex1)
(12nex1)
{sˆ } = [Qˆ ]{sˆ } + {gˆ } * a i
(6.11)
a i
(12nex1)
(12nex1) (12nex1)
{fˆ} = [Aˆ ] [Mˆ ]{sˆ } −1
* a i
i
(7nex1)
(12nex1)
{}
ˆ = h fˆ i
{sˆ}
i +1
(12nex1)
(7nex1)
Thus we may combine Equations 6.11 as:
{sˆ}i +1 = hˆ [Aˆ ]
−1
[Mˆ ]{[Qˆ ][Eˆ ]{sˆ} + {gˆ }}
(6.12)
i
[][ ]
[ ][ ]
−1 By making the substitutions [L1 ] = hˆ Aˆ Mˆ and [L2 ] = Qˆ Eˆ , Equation 6.12
may be rewritten as:
{sˆ}i +1 = [L1 ]{[L2 ]{sˆ}i + {gˆ }}
(6.13)
and letting L1 L2 = L3 and {γˆ} = [L1 ]{gˆ } gives:
{sˆ}i +1 = [L3 ]{sˆ}i + {γˆ}
(6.14)
(12nex12ne )
which is the standard form for an iterative solution of a set of linear equations.
For convergence of the solution i.e. for
{sˆ} = {sˆ}i = {sˆ}i +1
a
necessary and sufficient condition is that the eigenvalues λ of the matrix L3 conform to λ < 1 [BAR 90b].
If convergence is achieved then {sˆ} = {sˆ}i = {sˆ}i +1 and Equation 6.14 may be written as:
221
Chapter 6
{[I ] − [L3 ]}{sˆ} = {γˆ}
(6.15)
which can be written in the standard form of a set of simultaneous linear equations by letting Ω = I − L3 :
[Ω]{sˆ} = {γˆ}
(6.16)
(12 nex12 ne )
Examination of the matrix Ω will indicate the existence and nature of the solution {sˆ} for a given set of boundary terms {γˆ} . The shape and pattern of a number of the matrices discussed above are shown for Mesh 1 of BMT1 (and BMT's 2, 3 and 5) in Figure 6.2. In this figure a zero entry is left blank whilst a non-zero entry is drawn in black. Many of the matrices involved in
[]
the iterative method are symmetric and banded - see the matrix Aˆ for example. It may thus be possible to utilise computational routines that take advantage of these properties in order to maximise the efficiency of the iterative method.
The eigenvalues of the matrix L3
have been evaluated for the first two
meshes of BMT1 and it was found that they conformed to the inequality
λ < 1. As such, the iterative method will converge for these meshes. The matrix Ω has been formed for these meshes and was found to be nonsingular and there is, therefore, a unique solution
{sˆ}
for any set of
boundary loadings {γˆ} .
Now, clearly, if one has gone to the trouble of forming the matrix Ω then one might as well simply solve Equation 6.16 directly. However, even if the matrix Ω is well-conditioned (i.e. easily solvable) it is larger than the structural stiffness matrix for the original problem (note there are 3 stress degree's of freedom per node as opposed to the original 2 displacement
222
Chapter 6 degree's of freedom).
Further, the proposed method is iterative and in
practise one does not need to form the matrix Ω explicitly in order to proceed. For these reasons this direct approach to solving Equation 6.16 will not be pursued further.
Now, although it can be proved that the iterative method will converge to a unique solution for the meshes considered, because of the nature of the equations involved this unique solution may or may not be an equilibrium one. Although internal equilibrium will always be satisfied on an element by element basis, interelement equilibrium and equilibrium on the static boundary are not guaranteed and the existence of fully statically admissible solutions will depend on the nature of the boundary conditions i.e. on the vector {γˆ} .
The fact that there is a unique solution to Equation 6.16 (at least for the meshes considered) means that self-stressing modes of stress do not exist in the model. This may be surprising and can be demonstrated by considering the nature of the element stress field required to permit the existence of self-stressing modes of stress. Figure 6.3a shows four of the possible seven self-stressing modes that could exist in a four element mesh. The modes are categorised as basic and higher order.
A higher order mode is self-
equilibrating on an element interface and does not require other modes of traction to keep the element in equilibrium. There are in reality four higher order self-stressing modes for the mesh considered - one for each interelement boundary - however, only one of these modes has been shown in the figure.
223
Chapter 6
hˆ (12ne x7ne)
[Eˆ ]
[Qˆ ]
(12ne x12ne)
(12ne x12ne)
[Aˆ ]
[Mˆ ]
(7ne x7ne)
(7ne x12ne)
L3 ( 12 ne x 12 ne )
Figure 6.2 Shape and pattern of matrices for the Iterative method Mesh 1 of BMT1
224
Chapter 6
BASIC MODE 1 *
BASIC MODE 2 *
BASIC MODE 3 *
HIGHER ORDER MODE (1 OF 4) *
(a) SELF STRESSING MODES
*
*
*
*
(b) CORRESPONDING BOUNDARY TRACTIONS
Figure 6.3 Demonstration of non-existence of self-stressing modes
Figure 6.3b shows the linear boundary traction distributions that are statically equivalent to the stress resultants shown in Figure 6.3a for the first of the elements in the mesh (denoted with an asterix *). For the selfstressing mode to exist in the model the traction distributions shown in Figure 6.3b must be admissible with the internal stress field for the element i.e. with {σ~ } . It can be seen by examining Figure 6.30, which shows the 3
seven independent modes of traction corresponding to the seven linear statically admissible stress fields {σ~3 } , that none of these self-stressing modes of stress can exist. An algebraic argument for the non-existence of self-stressing modes is given in Appendix 6.
The concept of self-stressing modes is one drawn from the field of equilibrium models for which equilibrium is satisfied in a point by point sense. The iterative method, on the other hand, does not guarantee the recovery of an equilibrium solution and as such modes of stress
{sˆ} 225
Chapter 6 satisfying the homogeneous form of Equation 6.16 might not actually be true self-stressing modes. The reason for this is that interface equilibrium is not guaranteed with the iterative method and, therefore, the mode of stress {sˆ} satisfying the homogeneous form of Equations 6.16 may not be in equilibrium with zero interface loads. Such modes of stress could be termed quasi self-stressing modes. It is clear however since the matrix Ω is nonsingular that self-stressing modes, be they true or quasi, do not exist.
Summarising then, it is seen that the iterative method may be cast in the standard form of a set of simultaneous linear equations.
For the two
meshes examined these equations have a unique solution. Whether this unique solution is an equilibrium one depends on the nature of the applied loading. For the meshes investigated it has been proved that when cast in iterative form, convergence to the unique solution of the linear equations is guaranteed. Now although this analytical examination of Equation 6.16 has not been carried out for all meshes considered in this thesis the fact that for the meshes that have been examined a unique solution is obtained and that this unique solution is recoverable through iterative solution of these equations, although providing no guarantees, at least furnishes us with a confidence that this will also be the case for other meshes. It is the author's experience that for the meshes examined in this chapter the iterative method always converges to a unique solution.
The performance of the iterative method will now be examined in the context of the benchmark tests laid down in Chapter 3.
6.4 The iterative method applied to problems with linear analytical stress fields In this section we shall consider the performance of the iterative method on problems for which the analytical solution in stress is linear and is 226
Chapter 6 contained in the statically admissible stress fields {σ~3 } . Benchmark tests 1, 2, 8 and 9 fall into this category.
Let us consider how the iterative method converges for BMT1 and BMT2. For this purpose the variation of effectivity ratio β with number of iterations will be examined. In addition to the effectivity ratio, the way in ) which the strain energy of the error in the estimated stress field U 3 converges will also be investigated. For the benchmark tests considered in this section the iterative method converges such that the estimated stress field {σ~ } converges to the true stress field {σ }. Thus, the effectivity ratio β 3
) should converge to unity and U 3 to zero. A third integral quantity called
the energy ratio ∆ will also be examined and is defined as the ratio of the strain energy of the estimated stress field to the true strain energy for the problem. Thus, for the estimated stress field {σ~3 } the corresponding energy ratio ∆ 3 is given as: 1 ~ T ~ {σ 3} {ε 3}dV 2 V∫ ∆3 = U
(6.17)
and, in an analogous manner, the energy ratios corresponding to the estimated stress field {σ~1 } and {σ~2 } would be ∆ 1 and ∆ 2 respectively.
For the benchmark tests considered in this section all energy ratios should converge to unity as the number of iterations increases.
Tables 6.1 and 6.2 show how the effectivity ratio, the strain energy of the error of the estimated stress field and the error ratio ∆ 3 vary with number of iterations for Mesh 1 and for BMT1 and BMT2 respectively. Two initial stress vectors are considered. Note that the results for the first iteration with the initial stress vector set to the finite element stresses ( {sˆ}1 = {sˆa } ) are 227
Chapter 6 identical to those achieved with error estimator EE10 presented in Chapter 5.
The effectivity and energy ratios for the two benchmark tests (BMT1 and BMT2) are plotted against number of iterations in Figure 6.4a and 6.4b respectively. For BMT1 it is seen, for the case {sˆ}1 = {sˆa } , that the various quantities converge as already discussed. For the case of {sˆ}1 = {0}, however, the true solution is recovered in a single iteration. The reason for this is that after applying the static boundary conditions to the initialised stresses
{sˆ}1 = {0} all components of stress at all nodes are equal to the true values.
It
should be realised that convergence in a single iteration does not generally occur as seen for BMT2. Even for BMT1 this will not happen with Meshes 2, 3 or 4.
{sˆ}1 = {sˆa }
{sˆ}1 = {0}
Iterations
β
) U3
∆3
β
) U3
∆3
1
1.0212
0.2819
1.028
1.0
0.0
1.0
2
1.0079
0.0763
1.014
1.0
0.0
1.0
3
1.0033
0.0206
1.007
1.0
0.0
1.0
4
1.0015
0.0056
1.004
1.0
0.0
1.0
5
1.0007
0.0015
1.002
1.0
0.0
1.0
6
1.0004
0.0004
1.001
1.0
0.0
1.0
7
1.0002
0.0001
1.000
1.0
0.0
1.0
8
1.0001
0.0000
1.000
1.0
0.0
1.0
9
1.0000
0.0000
1.000
1.0
0.0
1.0
10
1.0000
0.0000
1.000
1.0
0.0
1.0
Table 6.1 Convergence of integral measures for BMT1 (Mesh1)
For BMT2 similar observations are made.
In this case, however, for
{sˆ}1 = {sˆa } the initial solution for the first iteration is further away from the true solution than was the case for BMT1. Turning to the case of {sˆ}1 = {0} an interesting behaviour is noticed. For the first iteration the effectivity 228
Chapter 6 ratio β is very close to unity (β = 0. 9943 ) however, for the next two iterations the effectivity ratio decreases after which it builds up again converging ) monotonically to unity. In contrast to this behaviour, it is seen that U 3 decreases monotonically indicating that the estimated stress field {σ~3 } is becoming closer to the true stress field {σ } with each and every iteration. This trend is reflected in the energy ratio ∆ 3 which converges monotonically to unity. This means, therefore, that the estimated stress field {σ~3 } after one iteration provides an effective measure of the error (β is close to unity) ) whilst being significantly different from the true stress field ( U 3 being large). This fact can be confirmed by comparing the two stress fields {σ~3 } and {σ } as shown in Figure 6.5. Note that the stress field shown in Figure 6.5b is for the case {sˆ}1 = {0} and is, therefore, not the same as that shown in Figure 5.9d of Chapter 5 which uses {sˆ}1 = {sˆa } . It is seen from this figure that the estimated stress field is quite different from the true one. For example, the maximum magnitude of the σ x -component of the estimated stress field is 96 . 875 N m 2 . Compare this with the true value of 150 N m 2 .
{sˆ}1 = {sˆa }
{sˆ}1 = {0}
Iterations
β
) U3
∆3
β
) U3
∆3
1
0.8095
6.7259
0.764
0.9943
103.1436
0.289
2
0.8621
2.8054
0.843
0.7689
43.0213
0.475
3
0.9048
1.1701
0.897
0.7559
17.9442
0.633
4
0.9359
0.4881
0.933
0.8028
7.4845
0.752
5
0.9575
0.2036
0.956
0.8561
3.1218
0. 835
6
0.9721
0.0849
0.972
0.9002
1.3021
0.891
7
0.9818
0.0354
0.982
0.9327
0.5431
0.929
8
0.9882
0.0148
0.988
0.9553
0.2265
0.954
9
0.9923
0.0062
0.992
0.9706
0.0945
0.970
10
0.9950
0.0026
0.995
0.9808
0.0394
0.980
Table 6.2 Convergence of integral measures for BMT2 (Mesh 1)
229
Chapter 6 Thus far we have only considered a single mesh (Mesh 1).
Let us now
consider how the iterative method performs with more refined meshes. For this purpose Meshes 1, 2 and 3 will be taken for BMT2. The results are shown in Table 6.3 and the effectivity ratios have been plotted against number of iterations in Figure 6.6.
(a) BMT1
(b) BMT2
O corresponds to {sˆ}1 = {sˆa } , ∇ corresponds to {sˆ}1 = {0}
Figure 6.4 Convergence of effectivity and energy ratios for BMT's 1&2 (Mesh1)
230
Chapter 6 σx
σy
τxy
y
y
y
x
x
x
(a) True stress field {σ }
(b) Estimated stress field {σ~3 } after first iteration (β = 0 . 9943, ∆ 3 = 0 . 289 ) Figure 6.5 Stress fields after first iteration (BMT2) for {sˆ}1 = {0}
Mesh 1
Mesh 2
Mesh 3
Iterations
β
) U3
∆3
β
) U3
∆3
β
) U3
∆3
1
0.8095
6.7259
0.764
0.9238
1.4771
0.884
0.9758
0.1435
0.9630
2
0.8621
2.8054
0.843
0.9285
1.2607
0.894
0.9767
0.1329
0.9643
3
0.9048
1.1701
0.897
0.9322
1.0936
0.902
0.9774
0.1253
0.9653
4
0.9359
0.4881
0.933
0.9355
0.9559
0.909
0.9781
0.1193
0.9663
5
0.9575
0.2036
0.956
0.9384
0.8399
0.915
0.9786
0.1144
0.9671
6
0.9721
0.0849
0.972
0.9411
0.7410
0.921
0.9791
0.1102
0.9679
7
0.9818
0.0354
0.982
0.9438
0.6559
0.926
0.9795
0.1065
0.9685
8
0.9882
0.0148
0.988
0.9462
0.5822
0.931
0.9799
0.1032
0.9692
9
0.9923
0.0062
0.992
0.9486
0.5180
0.935
0.9803
0.1003
0.9698
10
0.9950
0.0026
0.995
0.9509
0.4619
0.939
0.9806
0.0975
0.9700
Table 6.3 Convergence of integral measures for Meshes 1, 2 and 3 (BMT2)
231
Chapter 6
Figure 6.6 Convergence of effectivity ratio for Meshes 1,2 and 3 (BMT2)
Although only the first 10 iterations have been considered, it is recorded that for each mesh full convergence can be achieved if sufficient iterations are allowed. If we define convergence as occurring when ∆ 3 > 0 . 99 then the number of iterations for convergence are as given in Table 6.4.
Mesh
Iterations to convergence
1
9
2
45
3
134
Table 6.4 Iterations for convergence to ∆ 3 > 0 . 99 (BMT2)
It is seen from these results that the rate of convergence (represented by the gradient of the slope in Figure 6.6) of the effectivity ratio decreases with mesh refinement. Thus, even though for refined meshes the effectivity is already close to unity before performing any iterations, it is seen that to obtain a prescribed level of accuracy for a refined mesh may require more iterations than would be required for a coarse mesh. Since, also, it is noted that the computational cost of each iteration increases approximately in proportion to the number of elements in the model, it seems sense in
232
Chapter 6 practical terms to use the iterative method only on coarse meshes where benefits are achieved quickly and cheaply.
The final question to be considered in this section is how the iterative method copes with distorted meshes.
In order to answer this question
BMT8 will be examined. The effectivity ratios for the first 10 iterations and for the different levels of distortion considered have been tabulated in Table 6.5 and plotted in Figure 6.7. Iterations
d=1
d=2
d=3
d=4
d=5
1
0.8095
0.8186
0.8178
0.7828
0.7233
2
0.8621
0.8375
0.7808
0.7218
0.6755
3
0.9048
0.8674
0.7920
0.7292
0.6950
4
0.9359
0.8963
0.8182
0.7582
0.7339
5
0.9575
0.9206
0.8472
0.7928
0.7762
6
0.9721
0.9398
0.8744
0.8266
0.8159
7
0.9818
0.9546
0.8980
0.8571
0.8508
8
0.9882
0.9658
0.9179
0.8835
0.8804
9
0.9923
0.9741
0.9343
0.9057
0.9048
10
0.9950
0.9804
0.9476
0.9241
0.9247
Table 6.5 Convergence of effectivity ratios for BMT8 It is seen from these results that the convergence characteristics are strongly dependent on the level of distortion for this problem.
Figure 6.7 Convergence of effectivity ratio for BMT8 233
Chapter 6 Table 6.6 shows the number of iterations required for convergence to ∆ 3 > 0 . 99 and it is seen that the number of iterations required for
convergence increases with increasing distortion. In addition it is also seen that for certain levels of distortion ( d ≥ 2 m ) the convergence is not monotonic with the effectivity ratio decreasing initially for the first few iterations.
Mesh
Iterations to convergence
1
9
2
11
3
15
4
17
5
17
Table 6.6 Iterations for convergence to ∆ 3 > 0 . 99 (BMT8)
Thus, summarising events so far it is seen that in problems for which the true stress field is contained in the statically admissible stress field {σ~ } , 3
the iterative method is able to converge to the true solution given sufficient iterations.
The rate of convergence is dependent on the level of mesh
refinement and decreases with increasing mesh refinement. It should be noted with respect to this last point that for the more refined meshes the finite element solution is already close to the true solution and the effectivity of the error estimators discussed in previous chapters is already good. Thus, although the iterative method improves the effectivity, this is done at a higher computational cost than that required for coarse meshes. The rate of convergence is also affected by the level of distortion present in the mesh.
234
Chapter 6 6.5 The iterative method applied to problems with quadratic analytical stress fields In this section we will consider the performance of the iterative method on problems for which the analytical solution in stress is quadratic. BMT's 3 and 4 fall into this category.
Since the quadratic stress fields are not contained in the statically admissible stress fields {σ~3 } the iterative method cannot converge to the true solution. Experience with the iterative method has shown that in cases where the method cannot converge to the true solution it still converges to a stable solution which does not change with increasing iterations. For these cases, however, the stress fields {σ~1}, {σ~2 } and {σ~3 } may be different and the converged solution is one in which all these stress fields become invariant to increased iterations.
The
question investigated in this section, therefore, will be, 'are there any characteristics of the converged solutions that are of any use to us in our goal of error estimation?'.
Let us first consider BMT3. For this benchmark test the stress fields and the boundary tractions are quadratic as shown in Figure 3.5 of Chapter 3. It was noted in Chapter 4 (§4.5) that the equivalence between the static boundary schemes only existed for the case of linear boundary tractions. For this problem, where the boundary tractions are quadratic, this equivalence does not exist and the two static boundary schemes will result in different nodal stresses on the static boundary. In this section we shall compare the results from both static boundary schemes. Figures 6.8a and 6.8b show the boundary tractions for BMT3 and for the two static boundary schemes (SBS). These figures show, in addition to the boundary tractions, the interelement tractions for the statically admissible stress field {σ~ } for 3
the converged iterative solution.
In each case it is seen that the
interelement tractions are such that interelement equilibrium is satisfied in a strong, pointwise, sense.
Since the element stress fields also satisfy 235
Chapter 6 internal equilibrium, the converged iterative solution is seen to be an equilibrium solution for the applied boundary tractions. However, since the applied boundary tractions are different from the true boundary tractions, the solution is not an equilibrium solution for the true boundary tractions. 100N/m2 2
2
400N/m
25N/m
(a) SBS1 2
16.6'N/m
2
83.3'N/m 2
383.3'N/m
2
4.16'N/m
2
20.83'N/m
(b) SBS2 (note: the tangential tractions are all zero) Figure 6.8 Boundary tractions for BMT3 (Mesh 1) 236
Chapter 6 Now, although the converged iterative solutions are equilibrium solutions for the applied loading they are not compatible solutions.
This can be
demonstrated by examining the displacement fields for the models. Figure 6.9 shows the displaced shape for Mesh 1 of BMT3. This displaced shape is for the converged iterative solution using SBS2. The displacements for each element are unique to within a rigid body motion.
In Figure 6.9
(and all subsequent figures showing displaced shapes) the displacements have been drawn such that the displacements and rotations about the isoparametric centre of the element are zero. This choice is arbitrary and is made only for the purpose of these diagrams.
y
x
Figure 6.9 Displaced shape for BMT3, Mesh1 and SBS2.
Although the displacement fields are internally compatible (§5.2 and the note on kinematic admissibility of stress fields) for each element, interelement compatibility is not considered in the iterative method. The lack of interelement compatibility can be seen in Figure 6.9. If interelement compatibility was satisfied then the displaced elements shown in this figure could be fitted together without gaps. However, as can be seen from the figure, this is not possible since the relative curvature and deformation of element edges are not mutually compatible.
Consider, for example, the
interelement boundary on the line y = 0 . Because of the symmetrical nature
237
Chapter 6 of this problem this interelement boundary should remain a straight line. This is clearly not the case with the elements shown in the figure.
Let us now compare the results for the two static boundary schemes. The various integral quantities have been tabulated in Table 6.7. In this table two effectivity ratios are considered. β 1 is the effectivity ratio after one iteration and β c the effectivity ratio after the iterative method has ) converged. The tabulated values of U 3 and ∆ 3 are converged results. By converged results it is meant that further iterations would not alter the figures quoted.
SBS
β
1
β
c
1
2
1.1487
0.9615
) U3
1.3214
0.9317
18.8492
2.8109
∆3
1.1588
0.9982
Table 6.7 Integral measures for BMT3 (Mesh 1)
From these results it is seen that the effectivity ratios for SBS2 are closer to unity than those for SBS1, the strain energy of the error of the estimated stress field is smaller for SBS2 and the error ratio is closer to unity. Thus, in all the ways considered, for this benchmark test the use of SBS2 produces superior results than SBS1.
Let us now consider BMT4.
For this benchmark test the tangential
component of the applied tractions are quadratic and, as such, SBS1 is not equivalent to SBS2. The normal component of the applied tractions, on the other hand, are linear and SBS1 is equivalent to SBS2 for this component of the tractions.
Figure 6.10 compares the true tangential traction
distribution on the edge x = 8 m with that used by the iterative method. The traction distribution used by the iterative method is a piecewise linear 238
Chapter 6 distribution characterised by the amplitudes A and B. The different static boundary schemes will result in different values for these amplitudes. A
y
4m
y x
x
8m B
93.75N/m
(a) True distribution
2
(b) Distribution for iterative method
Figure 6.10 Tangential traction distributions on boundary at x = 8 m for BMT4 (Mesh 1)
The amplitudes of the traction distribution that is applied in the iterative method are given under the appropriate column heading in Table 6.8. For SBS1 the amplitudes are simply equal to the value of the traction at the appropriate node. For SBS2, on the other hand, there are two possibilities. Considering the edge x = 8 m we see that the amplitudes (as given in the column designated SBS2 1 ) are such that the shear stress at the points x = 8 m , y = ±2 m are non-zero. In contrast to this, the shear stress at these points due to the (zero) tangential traction distribution on the edges
y = ±2 m is zero. Thus, we could either set the shear stress at these points to 15. 625 N m 2 ( SBS2 1 ) or we could set it to zero. The latter possibility has been designated SBS2 2 .
Applied
Recovered
Amplitude
SBS1
SBS2 1
SBS2 2
SBS1
SBS2 1
SBS2 2
A
0
15.625
0
0
13.11
2.93
B
93.75
109.375
109.375
93.75
108.27
105.24
Table 6.8 Applied and recovered amplitudes for the tangential traction distribution (Mesh 1) 239
Chapter 6 All three cases have been investigated and the shear stresses recovered on convergence of the iterative method are tabulated in the column headed recovered.
It is seen that only in the case of SBS1 does the converged
solution satisfy the applied static boundary conditions. In the case of SBS2, the two schemes ( SBS2 1 and SBS2 2 ) yield results which are close to, but are not in equilibrium with the applied tractions. Table 6.9 shows the integral measures for BMT4.
SBS1
SBS2 1
SBS2 2
β1
1.0673
1.0084
1.0488
βc
) U3
1.0284
0.9883
1.0240
0.000536
0.000383
0.000397
∆3
0.9355
0.9533
0.9509
Table 6.9 Integral measures for BMT4 (Mesh 1)
Comparing the results for the various static boundary schemes considered, we see that in practical terms the results are all very similar. However, again, it is seen that the use of SBS2 produces superior results to those of SBS1.
The examination of this benchmark test has identified a potential deficiency with the iterative method. Because of the nature of the stress fields used in the method only single-valued shear stresses are permissible at nodes. This point will be taken up in discussion in the closure to this chapter.
6.6 The iterative method applied to BMT5 The results for BMT5 will be presented and discussed in this section. BMT5 is an interesting problem in that whilst the boundary tractions are linear, the internal stress field is highly non-linear. As a result of the linear nature of the boundary tractions, both static boundary schemes are equivalent.
240
Chapter 6 The boundary and interelement tractions of the converged iterative solution {σ~ } are shown in Figure 6.11. 3
In this figure it is seen that although the normal tractions satisfy equilibrium in a strong sense, the tangential tractions do not. As such the solution is not an equilibrium one.
Now, although equilibrium is not
satisfied in a strong sense, it is satisfied in a weak sense for, if the boundary tractions of Figure 6.11 are integrated to form resultant forces (the resultant moments are all zero), then it is seen that equilibrium of these resultants exists both between the elements and on the static boundary. These resultants are shown in Figure 6.12. 2
100N/m 2
2
400N/m
25N/m
y x
(a) Normal
2
2
75N/m
25N/m
2
2
25N/m
25N/m
2
125N/m
2
25N/m
2
175N/m
2
25N/m
y x
(b) Tangential
Figure 6.11 Boundary tractions for the elements of Mesh 1 (BMT5) 241
Chapter 6 In terms of the effectivity ratios for this benchmark test it is seen that for Mesh 1 the iterative method improves the effectivity ratio marginally from
β 1 = 1.0728 after the first iteration, to β c = 1. 0216 on convergence.
250N
250N 1500N
500N 250N 500N
2000N 500N
250N
500N
y x
Figure 6.12 Resultant forces for Mesh 1 (BMT5)
Having now examined in detail the performance of the iterative method for Mesh 1 of BMT's 3, 4 and 5 we can now look at the overall performance of the iterative method as the mesh is refined. Table 6.10 details the way in which the effectivity ratio and the strain energy of the error in the estimated stress field converges with mesh refinement both before, and after iteration.
Note that all results presented for the iterative method are
converged results such that further iterations would not change the numbers presented. These quantities are plotted in Figures 6.13 and 6.14.
242
Chapter 6
243
Chapter 6 Before iteration
After iteration
b
b
(a) BMT3
b
b
(b) BMT4
b
b
(c) BMT5 Figure 6.13 Effect of iteration on effectivity ratios 244
Chapter 6 Before iteration
After iteration
b b
(a) BMT3
b
b
(b) BMT4
Results for BMT5 are not
Results for BMT5 are not
given because there is no
given because there is no
analytical expression for
analytical expression for
the true stress field
the true stress field
(c) BMT5 ) Figure 6.14 Effect of iteration on U 245
Chapter 6
246
Chapter 6
247
Chapter 6
248
Chapter 6 An examination of these results shows that for BMT's 3 and 4, the effect of the iterative method is to pull the effectivity ratio closer to unity and to ) reduce U by, on average, an order of magnitude. These results are thus showing highly desirable trends. For BMT5 however, it is observed that although for Mesh 1 the effectivity ratio is pulled nearer to unity by the iterative method, for the more refined meshes it is pushed further away from unity i.e. iteration is making the effectivity worse.
Unfortunately,
because of the lack of an analytical solution for BMT5, the strain energy of the error in the estimated stress cannot be evaluated.
However, a
qualitative idea of what is happening to the stress fields may be gained by comparing distributions of stress. Figure 6.15 shows how the statically admissible stress field {σ~3 } converges with mesh refinement. This figure may be compared with the stress fields for the displacement models and equilibrium models which are shown in Figures 6.16 and 6.17 respectively. An estimate of the true solution is shown in Figure 3.8 of Chapter 3. Figure 6.17 also shows the displaced shape of the finite element models and illustrates the incompatible nature of the approximation.
A comparison of these stress distributions shows that the iterative method results in a stress field which looks to be nearer to the true one than the original (displacement) finite element stress field.
This is particularly
evident for the coarser meshes. Take Mesh 0 for example, it is seen that whereas the
displacement element solution shows distributions of
σ x and τ xy that are constant, the iterative method results in distributions which are surprisingly close to the true ones. It is seen that whilst the displacement solution retains significant stress discontinuities even for Mesh 3, the iterative method results in a much smoother solution in stress (note the only visible discontinuity for the iterative method is in the shear stress for Mesh 1). Now, as the mesh is refined it is seen that the σ x - and
τ xy -components of the stress appear to be converging to the 'true' solution 249
Chapter 6 (see Figure 3.8). The σ y -component, on the other hand, whilst exhibiting similar overall characteristics to the true solution is not picking up the high stress
gradient
behaviour
occurring
near
to
the
two
ends
( x = 0 m and x = 20 m ) of the membrane and predicted by both the displacement and the equilibrium finite element models.
This is an
interesting observation and leads to the reasoning why the iterative method appears to result in diverging effectivity ratios.
For BMT5 the stress field given in Equation 3.34 of Chapter 3 whilst satisfying equilibrium, violates compatibility. Since the iterative method takes no account of interelement compatibility, then the iterative method, rather than converging to the true solution, is seen to be converging to the solution given by Equation 3.34 (c.f. the second column of Figure 3.8). Further evidence for this is given by comparing the strain energies for the stress fields resulting from the iterative method. In Table 6.11 the strain energies for the finite element models and for the iterative method are tabulated for BMT's 3, 4 and 5.
The finite element strain energies are
denoted U hC and U hE indicating the compatible displacement model and the equilibrium model strain energies respectively. For the iterative method the strain energy due to the statically admissible stress field {σ~ } is denoted 3
~ ~ U S and for the continuous stress field {σ~1 } as U C . These values are plotted in Figure 6.18. For all three BMT's it is seen that as the mesh is refined the ~ ~ strain energies U S and U C appear to be mutually convergent. For BMT's 3 and 4 it is seen that these strain energies, as well as being mutually convergent, are also converging to the true value as given by the line ~ ~ without symbols in the figures. For BMT5, on the other hand U S and U C are seen to be converging to a value different than the true strain energy for the problem. The strain energy resulting from the incompatible stress field given by Equation 3.34 is:
250
Chapter 6
U =
387125 ≈ 2048 . 28 Nm 189
(6.18)
This value is very close to the strain energy for the true solution (c.f. U ≈ 2041 . 603 Nm ) and, for this reason, this behaviour is not shown all that
clearly in the figure. However, the numbers given in Table 6.11 do show this behaviour. Thus it is seen that because the iterative method takes no account of interelement compatibility, there are situations for which it may converge to the wrong solution.
BMT
3
4
5
Mesh
U hC
U hE
~ US
~ UC
0
1412.904
1516.534
1516.534
1516.534
1
1520.358
1558.697
1558.697
1558.697
2
1550.474
1561.332
1561.332
1561.332
3
1560.784
1560.784
1561.503
1561.503
0
0.01490
0.04053
0.02820
0.03664
1
0.03488
0.03985
0.03778
0.03791
2
0.03847
0.03983
0.03917
0.03918
3
0.03948
0.03983
0.03980
0.03980
0
851.327
2168.651
2839.286
2976.852
1
1702.598
2050.423
2244.048
2252.646
2
1953.359
2042.310
2097.099
2097.636
3
2019.156
2041.655
2060.325
2060.358
U
1561.507
0.03983'
2041.603
Table 6.11 Convergence of strain energies for BMT's 3, 4 and 5
A final observation can be made regarding the results presented in this section. It was observed in Section 6.5 that for BMT3 the iterative method converged to a solution which satisfied equilibrium in strong sense - noting that with the boundary distributions allowable only a weak equilibrium could be enforced on the static boundaries. The results shown in Table 6.11 show that the iterative method is actually converging to the solution that would be obtained using the equilibrium element model.
It should be 251
Chapter 6 observed with respect to the convergence of the strain energies that since boundary equilibrium is not satisfied in a strong sense, the upper bounded nature generally associated with an equilibrium solution is not exhibited, indeed, the results show that convergence occurs from below the true value.
(a) BMT3
(b) BMT4
(c) BMT5 Figure 6.18 Convergence of strain energies for BMT's 3, 4 and 5
6.7 The iterative method applied to BMT's 6 and 7 It should be pointed out straight away that BMT6 causes problems to the iterative method. These problems are best highlighted by investigating the full model as opposed to the quarter model investigated in previous chapters. As such full models using the same discretisation as the quarter 252
Chapter 6 models will be investigated.
As occurred with BMT4, the use of SBS2
results in multi-valued nodal stresses on the static boundary and we will therefore consider only SBS1.
For this problem the iterative method converges to a solution that is a long way from the true one. This is evident by comparing the various stress fields. Figures 6.19 and 6.20 detail the stress fields {σ~ } and {σ~ } respectively 3
1
for the converged iterative solution and may be compared with the true stress field shown in Chapter 3 (§3.4.6, second column of Figure 3.12). From these figures it is seen that the stress fields {σ~3 } and {σ~1 } , whilst being similar to each other, are both very different from the true one. The similarity between the stress fields {σ~3 } and {σ~1 } can be measured in the corresponding energy ratios. For the converged solution these energy ratios are
∆ 3 = 0 . 6132 and ∆ 1 = 0 . 6167
for
Mesh
1
and
∆ 3 = 0 . 8442
and
∆ 1 = 0 . 8447 for Mesh 2 i.e. they are close to each other. The fact that the iterative solution is a long way from the true one is reinforced by the fact that if one starts iterating from the averaged nodal stresses of the finite element solution, the iterative method moves the estimated stress field away from the true solution.
It is seen from these figures that whereas the true stress field exhibits a stress concentration in the
σ x -component of stress at the points
x = 0 , y = ±2 m , the stress field {σ~3 } actually exhibits a decrease in this component of stress. This is shown in more detail in Figure 6.21 which shows the distribution of normal traction along the line x = 0 from
y = 2 m to y = 10 m .
Thus, instead of stress concentrations, the iterative
method predicts stress anti-concentrations at these points.
253
Chapter 6
(a) Stress component σ x
(b) Stress component σ y
(c) Stress component τ xy
Figures 6.22 Converged statically admissible stress field {σ~3 } for BMT6
254
Chapter 6
(a) Stress component σ x
(b) Stress component σ y
(c) Stress component τ xy
Figures 6.23 Converged continuous stress field {σ~1} for BMT6
255
Chapter 6
Mesh 1
y
Mesh 2
Mesh 1
y
y
Mesh 2 y
y
10m
2m
30,000N/m
x
True
2
3000N/m
2
2
2565N/m
x
x
Iterative
2
23004N/m
26973N/m
x
x
Finite Element
Figure 6.21 Distribution of normal traction along the line x = 0 from
y = 2 m to y = 10 m
The converged iterative solution is not an equilibrium one. This is evident from the discontinuities in stress shown qualitatively in Figure 6.19 and from the way in which the static boundary conditions are violated as demonstrated in Figure 6.22 for Meshes 1 and 2.
In Figure 6.22 the
difference between the boundary tractions for the finite membrane and the infinite membrane boundary {t}d as defined in Equation 3.37 of Chapter 3 are plotted. In this figure the tractions resulting from the finite element solution are denoted FE and those from the iterative method are denoted IM. These tractions are drawn to the same scale as the true values which are shown in Figure 3.11 of Chapter 3.
It is seen that as the mesh is refined, the statically admissible stress field {σ~3 } appears to be becoming continuous i.e. as the mesh is refined {σ~3 } tends to {σ~1 } . It has already been noted that the iterative method makes no attempt whatsoever to satisfy the conditions of interelement compatibility and the resulting lack of interelement compatibility can be seen from the displaced shape of the elements as shown in Figure 6.23. Consider, for example, fitting the inner ring of elements together such that compatibility is satisfied at the inner ring of nodes (i.e. at r = 2 m ). If one does this it becomes evident that the elements overlap to quite some considerable degree and thus interelement compatibility is seen to have been violated. 256
2
Chapter 6
703N/m
FE
IM
FE
IM
2
FE - Finite element IM - Iterative Method
Figure 6.22 Boundary tractions {t d } for Mesh 1 & 2
257
Chapter 6
(a) Mesh 1
(b) Mesh 2 Figure 6.23 Displaced shape for BMT6 (full model) and SBS1 {σ~3 }
258
Chapter 6 The way in which the static boundary conditions are violated on the circular boundary is shown in Table 6.12 which tabulates the normal and tangential tractions resulting from the finite element solution and the iterative method.
Mesh 1 Finite element
Mesh 2
Iterative Method
Finite element
Iterative Method
Angle
tn
tt
tn
tt
tn
tt
tn
tt
0
4624
0
1313
0
1456
0
299
0
22.5
/
/
/
/
1918
-4475
281
-150
45
4164
-7016
787
-504.2
3032
-6329
105
-167
67.5
/
/
/
/
4147
-4475
95
-99
90
3703
0
498
0
4609
0
77
0
Table 6.12 Boundary tractions on the 1st quadrant of the circular boundary
It is seen from these results that as the mesh is refined the static boundary conditions returned from the iterative method appear to be converging to the true values. Thus, it would appear, since the stress fields {σ~ } and {σ~ } 3
1
seem to be converging to each other as the mesh is refined, and the SBC's appear to be converging to those that have been applied, that as the mesh is refined the iterative method is converging to an equilibrium solution.
The performance of the iterative method for BMT's 6 & 7 is detailed in Table 6.13 which shows the effectivity ratios and the strain energy of the error of the estimated stress fields before, and after iteration. It has already been demonstrated that for BMT6 the iterative method performs badly and the results shown in Table 6.13 confirm this with the effectivity ratios after iteration being far removed from the ideal value of unity. For BMT7 observations similar to those made for BMT6 hold. Note, however, with respect to BMT7 that although iteration is seen to improve the effectivity in that it is moved closer to unity, as the mesh is refined the value of the
259
Chapter 6
260
Chapter 6
(a) Stress component σ x
(b) Stress component σ y
(c) Stress component τ xy Figures 6.24 Converged statically admissible stress field {σ~3 } for BMT7 261
Chapter 6
(a) Stress component σ x
(b) Stress component σ y
(c) Stress component τ xy Figures 6.25 Converged continuous stress field {σ~1} for BMT7 262
Chapter 6 effectivity ratios after iteration are seen to be converging to some value greater than unity.
The values of the strain energy of the error in the
estimated stress fields reinforce this point with values increasing with iteration. The statically admissible stress field {σ~ } , and the continuous 3
stress field {σ~1 } are shown for Meshes 1 & 2 of BMT7 in Figures 6.24 and 6.25 respectively.
In order to understand why the iterative method cannot cope with BMT6 another problem exhibiting the same characteristics, but with a simpler geometry (by simpler it is meant that the model geometry has straight sides and the elements are square), will be investigated. In this problem a square membrane with a square hole positioned in the centre of the membrane is investigated. The membrane is loaded with uniform tensile tractions as shown in Figure 6.26. Plane stress is assumed with a Young's Modulus of 210 N m 2 , Poisson's Ratio of 0.3 and a material thickness of 1m .
This
problem is designated BMT10. 10N/m 2
1m
6
7
8
y x
1m
4
1
1m
1m
1m
5
2
3
1m
(a) The problem
(b) The mesh
Figure 6.26 Benchmark test 10 For this problem the converged iterative solution {σ~3 } is not continuous and does not satisfy equilibrium even in a weak sense. This is demonstrated in Figure 6.27 where the tractions for Elements 5,7 and 8 (see Figure 6.26b for element numbering) are shown (the remaining tractions can be deduced from the symmetric nature of this problem). 263
Chapter 6 It is seen from this figure that strong equilibrium does not exist between elements or on the static boundary.
Figure 6.28a shows the stress
resultants due to these tractions. It is seen, by comparing this figure with Figure 6.28b, which shows the true stress resultants for this problem, that equilibrium is violated on the boundaries also. 2
2
1.72N/m
0.82N/m 2
2
9.20N/m
9.20N/m
2
2
9.73N/m
9.20N/m
8
7
2 5.72N/m
2
5.72N/m
2 7.73N/m
2
8.26N/m 2
2
1.85N/m
0.68N/m
y
2
2.0N/m
2
4.0N/m
2
2
3.7N/m
6.3N/m
x
5
2 3.7N/m
2 6.3N/m 2 4.0N/m
2
2.0N/m
(a) Normal tractions 2 0.28N/m
2
0.42N/m
8
7
2
0.25N/m
2
0.11N/m
y 2
2 1.3N/m
x
1.3N/m
5
2
1.3N/m
2
1.3N/m
(b) Tangential tractions Figure 6.27 Boundary tractions from iterative method (BMT10) {σ~3 }
264
Chapter 6 0.45N 0.35N 0.02N 0.29Nm
0.29Nm 7.46N
0.21Nm 7.46N
9.00N
8.47N 0.12Nm
7
8
0.12Nm
0.21NM
15N
15N
10N
15N
8
7 0.16N M1
M1
M1 M2
0.18N 0.59N
5N
1.05N y
1.3N
y
5N M2
0.51Nm x
6.3N
3.7N
5
10N
x
5
0.51Nm
M1 + M 2 =2.5Nm
M2
1.3N
5N
1.05N
(a) Iterative method
(b) True values
Figure 6.28 Stress resultants due to boundary tractions
It is evident from Figure 6.28 that there is a large difference between the two sets of resultants, both in terms of magnitude and in the modes of traction that are present. Let us consider Element 8, and ask whether we can obtain, from the stress fields available in {σ~ } , a set of stress resultants 3
identical to the true ones. Using only linear tractions (since {σ~3 } is linear) the traction distribution that is statically equivalent to the true stress resultants for Element 8 is as shown in the left hand side of Figure 6.29. Can this traction distribution be obtained with the available stress fields? In order to answer this question we must examine the available tractions for {σ~3 } . There are seven independent stress fields in {σ~3 } and, therefore, there are seven independent modes of traction distribution as shown in Figure 6.30. 6M 1
10
15
10
=
8
6M 1
10
8
5
+
8
5
5
6M 2
6M 2
Figure 6.29 Boundary tractions for a regular element 265
Chapter 6 Now although the constant portion of the true tractions on Element 8 are contained in the seven independent tractions of {σ~3 } , it is clear that the remaining part of the tractions is not. Consider for example the moments applied to adjacent edges of the Element 8 in Figure 6.29. With the stress fields {σ~3 } , equal and opposite moments are required to exist on opposite edges of an element. Thus it is not surprising that the iterative method is unable to converge to a solution that is even close to the true one.
An
algebraic proof of this is given in Appendix 6.
1
2
3
4
5
6
7
Figure 6.30 Seven independent modes of traction for {σ~3 }
6.9 Closure The iterative method attempts to achieve a solution which satisfies global equilibrium.
Whether global equilibrium is actually achieved or not
depends on the true stress field for the problem and on the nature of the stress fields contained in the estimated stress field {σ~3 } . The case where
{σ~3} contains the complete linear statically admissible stress fields has been considered.
Thus for problems where the true stress field is linear the
iterative method is able to recover it. For problems where the true stress field is non-linear the iterative method whilst not recovering the true solution converges to a stable solution. This converged solution is piecewise
266
Chapter 6 statically admissible but generally violates pointwise equilibrium between elements and on the static boundary.
Now, although the iterative method attempts to recover complete equilibrium, no explicit attempt is made at enforcing compatibility between elements. In certain cases this deficiency does not matter c.f. the BMT's for which the true stress field is linear and BMT's 3 & 4. These BMT's may be considered as being driven by equilibrium considerations. For BMT5, on the other hand, it was seen that by not considering interelement compatibility, the iterative method, whilst converging (with mesh refinement) to an equilibrium solution, did not converge to the true solution. Such problems may be considered as being driven by compatibility considerations.
For problems involving high stress gradients c.f. BMT's 6 & 7, the iterative method converges to a solution which is a long way from the true one. An examination of BMT10 (a simpler analogue of BMT6) showed the reason for this to lie in the inability of the stress field {σ~ } to model certain types of 3
traction distribution. Related to this problem is that observed in Section 6.5 where, for BMT4, it was seen that although we wished to apply tangential traction distributions that were discontinuous we could not do this because of the continuous nature of the stress fields {σ~3 } within an element. It was seen that even though for BMT's 6 & 7 the iterative method appeared to be converging with mesh refinement, the solution to which it was converging, although an equilibrium one was not the true one. This reinforces the point already made that for certain problems consideration of equilibrium alone is insufficient and compatibility must also be considered if one is to achieve useful results.
In terms of our goal of effective error estimation it was seen that for certain problems the iterative method was able to yield a dramatic improvement 267
Chapter 6 both in terms of the effectivity of an error estimator and in terms of the closeness of the estimated stress field to the true one as measured in the strain energy of the error of the estimated stress field. Figures 6.13 and 6.14 for BMT's 3 and 4 show this effect very clearly. However, for other problems, in particular those which can be considered as being driven by compatibility considerations, the method performed less well and did not yield anything useful in terms of improved effectivity. Thus although for certain problems one can achieve an improvement in error estimation, in general this is not the case.
As a method for recovering an equilibrium solution the iterative method is deficient in that the statically admissible stress fields permitted in an element are insufficient for all linear forms of applied loading to be modelled. Further, even in the cases where one can achieve an equilibrium solution with the iterative method, by virtue of the fact that interelement compatibility is not satisfied one cannot ensure that this solution is a useful one i.e. that it is sufficiently near the true one.
The potential of these
deficiencies to cause problems were known before the iterative method was pursued. The effect of these potential deficiencies, however, were unknown and this has been the subject of the investigations carried out in this chapter.
In order to improve the iterative method one should look towards increasing the number of statically admissible stress fields within an element such that it has the ability to model all linear modes of applied boundary traction. By replacing the linear statically admissible stress fields with, for example, the piecewise linear statically admissible stress fields used within the equilibrium element of Maunder [MAU 90] (for example), one would obtain a model for which all linear modes of applied boundary traction were admissible. By doing this one would obtain the additional advantage that 268
Chapter 6 discontinuities in the shear stress at the corners of the elements would then be permissible. This would remove the problem encountered with BMT4 (§6.5). The additional stress fields would be likely to lead to models which were hyper-static i.e. with more than one equilibrium solution.
The
particular equilibrium solution could then be chosen as the one which best satisfies interelement compatibility.
By carrying out these proposed improvements one is moving nearer to the idea of achieving full equilibrium through the use of an equilibrium model. One could opt to perform a dual analysis. However, dual analysis requires a total re-analysis together with it's associated computational costs.
Such
additional cost is to be avoided in the context of error estimation where the cost of predicting the error in one's original analysis should not be more than a fraction of the cost of the original analysis. A type of error estimator which, although mentioned in the introduction of this thesis, has not been discussed in any detail is that which achieves an estimated stress field that satisfies global equilibrium through calculations performed in a local, rather than a global, manner [LAD 83].
For such error estimators the
computational cost should not be prohibitive since the calculations are performed in a local piecewise manner. Indeed, such methods are now even being discussed in undergraduate finite element texts [AKI 94] and are the subject of continuing research at a number of institutions, for example at Exeter in England and Liège in Belgium [MAU 93a].
269
CHAPTER 7 CONCLUSIONS
The research work detailed in this thesis has concentrated on two fundamental questions occurring in finite element analysis. Firstly, on how the shape of an element affects its ability to represent a given test field shape sensitivity, and secondly on how one can estimate, a posteriori, the errors in the results of a finite element analysis - error estimation. In this thesis these questions have been investigated in the context of problems in plane stress linear elasticity using the standard four-noded Lagrangian displacement element.
The investigations into element shape sensitivity revealed a number of important points. It was seen that the shape of an element did indeed affect its ability to perform in a given test field. This effect was measured in an integral sense through a ratio of the finite element strain energy and the true strain energy. Shape sensitivity occurs as a result of the incomplete nature of the polynomial finite element displacement field. As a result of this shape sensitivity vendors of commercial finite element software tend to set limits on the level of element distortion allowed in their codes. The existence of shape sensitivity is well known. However, it was also observed that the performance of an element was also affected by the way in which it is loaded and the value of the material property Poisson's Ratio. These effects are less well known.
270
Chapter 7 In these studies into shape sensitivity it was found that the way in which the element was loaded had a large effect on the way in which it performed. The two limiting cases of applied nodal displacements and applied consistent nodal forces were investigated. It was seen that only in the case of applied consistent nodal forces could one place a bound on the error ratio. For the case of applied nodal displacements no such bound could be given for the error ratio. For the case of applied consistent nodal forces the finite element solution is such as to minimise the strain energy of the error. This provides an important reminder of the reasons for always using consistent nodal forces.
It was noted that the performance of an element was also affected by the value of Poisson's Ratio that was chosen. In particular, it was seen that even in cases where the true solution is independent of it, the finite element solution may still be dependent on the value of Poisson's Ratio.
This
phenomenon may not be all that well known and, although in general the value of Poisson's Ratio is dictated by one's choice of material, it is as well to be aware of the fact that it may affect the way in which the element performs.
The investigations into the shape sensitivity of a single finite element lead to an understanding of the way in which the element approximates the true solution and this, in itself, is useful.
However it was seen that in the
absence of any knowledge of the true stress field one cannot predict a priori how the element is going to perform and this means that in practical finite element analysis any error estimation needs to be done a posteriori when, at least, an approximation to the true solution is known.
The a posteriori error analysis in the finite element method investigated in this thesis uses as its basis the construct of an estimated (true) stress field. 271
Chapter 7 The desirable property of this estimated stress field is that it provide a good representation of the true solution such that the error in the finite element solution may be predicted accurately and reliably. A number of philosophies for obtaining an estimated stress field have been investigated in the literature. Perhaps the most widely used is that where the estimated stress field is constructed such as to be continuous across interelement boundaries. A heuristic argument for adopting such a continuous estimated stress field is that the true solution will also exhibit such continuity.
The general
procedure for obtaining continuous estimated stress fields is to take a set of unique nodal stresses and to interpolate from them, over the element, with the element shape functions. Differences in this general procedure arise when one considers precisely how the unique nodal stresses are recovered from the finite element solution. In this thesis we considered two basic methods for obtaining these unique nodal stresses.
Simple nodal averaging is perhaps the easiest and cheapest way one can achieve a set of unique nodal stresses, and this approach has been adopted by at least one commercial finite element software manufacturer.
Even
with simple nodal averaging it was seen that different methods for recovering the element nodal stresses i.e. direct evaluation at nodes or, for example, bi-linear extrapolation from Gauss points, had a significant effect on the effectivity of an error estimator. In the studies conducted in this thesis, error estimators which used simple nodal averaging as a means to achieve a set of unique nodal stresses were found to be asymptotically exact provided that a proper integration scheme was used. By proper one means an integration scheme that is capable of performing the integration exactly for, at least, the parallelogram element. The nodal quadrature integration scheme was found to be inexact even for the parallelogram element and error
estimators
using
this
integration
scheme
were
seen
to
be
asymptotically inexact. The performance of these simple error estimators 272
Chapter 7 was seen to deteriorate rapidly in the presence of element shape distortion. This was demonstrated for a coarse mesh of four elements where it was shown that as the elements were distorted, the effectivity of the error estimator decreased. This behaviour represents, perhaps, one of the most serious shortcomings of the simple error estimators since it is with such crude and, possibly, severely distorted meshes that the accurate prediction of errors is usually required.
Through investigating these simple error estimators it was realised that with very little additional effort one could modify the values of the components of the unique nodal stresses affected by the static boundary conditions to the true values. This process was described as applying the static boundary conditions and this relatively simple expedient was demonstrated to significantly enhance the effectivity of the simple error estimators. This improvement was particularly notable for the distortion problem where, through the application of the static boundary conditions, it was observed that the effectivity became sensibly independent of distortion.
Patch recovery schemes, for which the unique nodal stresses are recovered from the superconvergent stress points surrounding the node of interest, are currently receiving much attention in the literature and have been investigated in this thesis. Through investigations of the Zienkiewicz and Zhu patch recovery scheme [ZIE 92a] a potentially serious deficiency relating to the orientation dependency of the error estimator has been uncovered.
A method described as the parent patch concept which
overcomes this deficiency has been proposed and evaluated in this thesis. From these investigations it has been shown that, although yielding more effective error estimation than the simple error estimators considered previously, the effectivity of error estimators based on patch recovery
273
Chapter 7 schemes are generally not as good as the simple error estimators with applied static boundary conditions.
Arguments other than the necessity for continuity in the estimated stress field may be used. For example, one could argue that the estimated stress field should be statically admissible with the true body forces. Such error estimators were investigated in Chapter 5 of this thesis where elementwise statically admissible stress fields were fitted initially to the original finite element stress field and, latterly, to the processed finite element stress fields discussed in previous chapters.
Fitting the statically admissible
stress field to the original finite element stress field leads to a poor and unreliable prediction of the error in the finite element solution.
The
reasoning for this being that, at least for the element under consideration, the error manifests itself in interelement stress discontinuities more than it does in a lack of internal element equilibrium.
It should be noted at this point that the error in the finite element solution is distributed differently for different element types.
For example
Zienkiewicz [ZIE 89] states that for low order elements (which includes the element under consideration in this thesis) the major contribution to the error is from the stress discontinuities between elements. For higher order elements (which includes the eight-noded serendipity element) the distribution changes with the more significant portion of the error coming from
residual body forces as opposed to the interelement stress
discontinuities. This can be demonstrated by considering how the two different philosophies for error estimation (continuity of stress and elementwise static admissibility of stress) perform on another element type. For this purpose the eight-noded serendipity displacement element will be used.
Table 7.1 compares the finite element strain energies, and the
effectivity ratios for both error estimation philosophies and for the four274
Chapter 7 noded and the eight-noded elements. BMT's 3, 4 and 5 are considered and a new test BMT11 is also tabulated.
BMT11 has a statically and
kinematically admissible cubic stress field as follows:
σ x = x 3 100 σ y = 3 xy 2 100 − 2 x 3 100
(7. 1)
τ xy = −3 x 2 y 100 and for a Young's Modulus of E = 210 N m 2 , a Poisson's Ratio of ν = 0 . 3 and a material thickness of t = 0 .1m , the strain energy for the problem is U=
13859 ≈ 282 . 836 Nm 49
(7.2)
The same meshes as described in Chapter 3 are used for these problems with Mesh 0 being, in all cases, the single element. For BMT11 the same meshes and co-ordinate system used for BMT1 are adopted.
four-noded displacement element BMT
3
4
5
11
eight-noded displacement element
Mesh
dof
Uh
β6
β2
dof
Uh
β min
β con
0
8
1412.904
0.579
0
16
1557.460
0.748
0
1
18
1520.358
0.809
0.783
42
1561.241
0.750
0.012
2
50
1550.474
0.871
0.916
130
1561.491
0.789
0.011
3
162
1558.654
0.894
0.967
450
1561.507
0.804
0.006
0
8
0.01490
0.062
0
16
0.03699
0.0001
0
1
30
0.03488
0.458
0.712
74
0.03977
0.552
0.005
2
90
0.03847
0.491
0.927
242
0.03983
0.571
0.004
3
306
0.03948
0.503
0.980
866
0.03983
0.581
0.003
0
8
851.327
0.005
0
16
1987.003
0.557
0
1
18
1702.598
0.021
0.817
42
2036.766
0.624
0.037
2
50
1953.359
0.025
0.937
130
2041.174
0.559
0.159
3
162
2019.156
0.026
0.973
450
2041.570
0.538
0.100
0
8
191.388
0.149
0
16
271.135
0.597
0
1
18
253.220
0.233
0.537
42
281.966
0.655
0.098
2
50
274.543
0.284
0.828
130
282.779
0.706
0.052
3
162
280.670
0.306
0.943
450
282.833
0.730
0.020
Table 7.1 Comparison of effectivities for four- and eight-noded elements 275
Chapter 7 For the eight-noded element the error estimator EE min uses an estimated stress field {σ~ } that contains the complete (twelve) quadratic statically 3
admissible stress fields (c.f. Equation 5.1). The amplitudes of this stress field
{ f } are
determined by minimising the strain energy of the estimated
~ error U e in an elementwise manner. For EE con the estimated stress field is continuous as defined by Equation 4.1, but uses the shape functions appropriate to the eight-noded element.
The unique nodal stresses are
determined by a process of simple nodal averaging of the finite element stresses evaluated directly at the element nodes.
For the eight-noded
element all integrations are performed using a 3x3 Gauss quadrature scheme.
For the four-noded element we see, as already observed in previous chapters, that error estimators based on continuous estimated stress fields are superior to those for which a statically admissible estimated stress field is fitted to the original finite element stress field. element, however, we observe the exact opposite.
For the eight-noded Here we see that the
continuous estimated stress field achieved by interpolating from averaged nodal stresses over the element results in a very poor estimation of the error whereas with the use of the statically admissible stress field fitted to the original finite element stress field through minimising the strain energy of the estimated error in an elementwise manner, the error estimation appears to be reasonable.
This example serves to illustrate the point that effective error estimation schemes are element dependent.
Although not an essential property, it
might be thought of as desirable that an error estimator be equally effective for all element types.
276
Chapter 7 The relative performance of the error estimator EE min can be established by comparing the effectivity β min with that of other error estimators. Results produced by the Belgian group of researchers [BEC 93] are again used and are shown in Table 7.2. Mesh
dof
EE min
EE con
~ G
r
Jr
σ~( L2 )
σ~ ( Lm )
σ~ (α e Le )
0
16
0.0001
0.0
\
\
\
\
\
\
1
74
0.552
0.005
\
\
\
\
\
\
2
242
0.571
0.004
0.86
0.66
0.25
0.0036
139.24
1.80
3
866
0.581
0.003
0.85
0.69
0.24
0.0036
282.24
1.77
Table 7.2 Comparison of β 's with published results for BMT4 (eight-noded element)
The various error estimators used in Table 7.2 were discussed in Section 4.9 of Chapter 4.
The r-estimator is quantifies the error through direct
consideration of the residual body forces [ZHO 91b]. The results confirm, up to a point, the observation made above that the use of continuous estimated stress fields do not lead to effective error estimators for the eight-noded element (c.f. σ~( L2 ) and σ~ ( Lm ) ). However, the error estimator σ~ (α e Le ) , which also uses a continuous estimated stress field results in what appears to be a not unreasonable prediction of the error. This error estimator, as discussed in Chapter 4, bears similarities with the superconvergent patch recovery scheme now recommended by Zienkiewicz [ZIE 92a] and it may be that through the use of such a patch recovery scheme an error estimator which provides effective error estimation for a wide range of elements has been achieved. This is the impression one gets from reading such papers as [ZIE 92a] but confirmation of this fact would require further investigation.
Returning now to the element under consideration in this thesis i.e. the four-noded element, it is well known that error estimation for this element 277
Chapter 7 requires at least some consideration of the lack of continuity of stress between elements.
After the initially disappointing results for the error
estimators using statically admissible stress fields fitted to the original finite element stress field (EE6) the same fitting procedure was tried on a processed finite element stress field. By using the continuous and boundary admissible stress field in place of the original finite element stress field much more successful error estimation was achieved. The effectivity of such error estimators (EE10), however turned out to be no more than that achieved by just using the processed finite element stress field i.e. EE2 b . However, it was seen that, in general, the error estimator EE10 performed better than EE2 b when measured in terms of the strain energy of the error ) ) in the estimated stress field i.e. U 2b > U 310 .
The sequence of procedures for achieving the statically admissible estimated stress field for EE10 was seen to be a simple sequential enforcement of various aspects of equilibrium i.e. interelement equilibrium, followed by boundary equilibrium, followed by internal equilibrium. At each stage of the process different aspects of equilibrium are enforced and the remaining aspects are generally destroyed. The achievement of an estimated stress field that is globally statically admissible is a desirable aim since, through such an estimated stress field, an upper bound on the true error in the model may be established. In the final chapter of this thesis an iterative method with this aim in mind was proposed and investigated.
The iterative method attempts to build an estimated stress field that is both statically admissible and fully continuous.
Interelement compatibility is
neither considered nor is it generally satisfied in the process. It was shown, through numerical examples, that the iterative method performed well for a certain problems which were classed as being driven by equilibrium considerations. For these problems the effect of the iterative method on the 278
Chapter 7 estimated stress field was dramatic with the estimated stress field being pushed nearer to the true solution both when measured in terms of the effectivity ratio and the strain energy of the error in the estimated stress field. For problems which were classed as being driven by compatibility considerations, the iterative method, although attempting to recover an equilibrium solution, could not be guaranteed to converge to the true solution. In order to guide the iterative method towards the true solution for
compatibility
driven
problems
at
least
some
consideration
of
interelement compatibility is needed.
The iterative method was shown to be determinate in that there was a unique solution to Equation 6.16. As such, interelement compatibility can not be accounted for within the iterative method as it was defined in Chapter 6.
Thus, in order to be able to include some consideration of
interelement compatibility one should consider including more element stress fields in the iterative method. In this way one would obtain a system of equations which were indeterminate i.e. with many solutions to Equation 6.16. In such cases one could select the particular solution to be that one which best satisfies interelement compatibility.
279
APPENDICES APPENDIX 1
ANALYTICAL EXPRESSIONS FOR THE FINITE ELEMENT STRESS FIELD
This appendix states the analytical expressions for the finite element stress field for a rectangular element of sides 2a x 2b as shown in Figure A1.1. These expressions have been derived using the symbolic algebraic manipulation software DERIVE1. y 4
3
x
2a
1
2
2b
Figure A1.1 Rectangular element under consideration
For the rectangular element shown in Figure A1.1 the components of the finite element stress field are:
1DERIVE
σx =
E {νD1x + D2 y + D3} 4ab(1 − ν 2 )
σy =
E {D1x + νD2 y + D4 } 4ab(1 − ν 2 )
τ xy =
E {D2 x + D1 y + D5 } 8ab(ν + 1)
(A1.1)
is marketed by Soft Warehouse, Inc. Honolulu, Hawaii, USA. (Version 1.62).
280
Appendices where the five independent D parameters are linear combinations of the components of the nodal displacements and correspond to the five independent stress fields that this element is able to model.
The D
parameters are: D1 = δ 2 − δ 4 + δ 6 − δ 8 D2 = δ 1 − δ 3 + δ 5 − δ 7 D3 = − a ν ( δ 2 + δ 4 − δ 6 − δ 8 ) − b ( δ 1 − δ 3 − δ 5 + δ 7 )
(A1. 2)
D4 = − a ( δ 2 + δ 4 − δ 6 − δ 8 ) − b ν ( δ 1 − δ 3 − δ 5 + δ 7 ) D5 = − a ( δ 1 + δ 3 − δ 5 − δ 7 ) − b ( δ 2 − δ 4 − δ 6 + δ 8 )
where δ 1 , δ 3 , δ 5 and δ 7 are the u-components of the displacements at nodes 1, 2, 3 and 4 respectively. The v-components of the displacements at the same nodes are δ 2 , δ 4 , δ 6 and δ 8 respectively.
The body forces for the element:
bx =
ED 1 ED 2 , by = 8 ab ( 1 − ν) 8 ab ( 1 − ν)
(A1.3)
The three constant stress states correspond to the three parameters D3 , D4 and D5 .
The remaining stress states D1 and D2 correspond to two
linear stress states neither of which are statically admissible with zero body forces as seen from Equation A1.3.
281
Appendices APPENDIX 2
PROOF OF EQUALITY OF ERROR RATIOS FOR RECTANGULAR ELEMENTS IN CONSTANT MOMENT STRESS FIELDS
For the case of a rectangular element in a constant moment stress field it is observed, by comparing the curves T1 and T2 of Figure 2.13a with those of Figure 2.16, that the error ratios e ∆ and eQ are equal i.e. e ∆ = eQ = a . By comparing the nodal forces for the two types of applied loading it is also seen that they are proportional and that the constant of proportionality is the error ratio:
{QT } = a{Q∆ }
(A2.1)
In other words, both types of loading cause the element to displace in the same manner but with different magnitude (the mode of displacement is the same for each loading case but the amplitude of the mode is different). Mathematically this means that:
{∆ }= a{∆ }+ rigid body motion Q
T
(A2.2)
Now, from the principle of virtual work, we can write the true strain energy U for the element as:
U=
1 {σ }T {ε }dV = 1 ∫ {t}T {u}dS ∫ 2V 2S
(A2.3)
The true displacement field {u} is given from Equation 2.30 as {u} = [ p ]{ f } , and the true boundary tractions {t } are obtained by substituting Equation 2.28 into Equation 2.4 resulting in:
282
Appendices
{t} = [T ][h]{ f }
(A2.4)
Now for a test field corresponding to a constant moment stress field we can write:
{ f } = b{ fcm } where
{ f cm }
(A2.5)
is a vector of test field amplitudes corresponding to a constant
moment stress field.
Substituting these relations into the expression for the true strain energy gives us:
U=
b2 2
∫ { f } [h] [T ] [ p]{ f }dS T
T
T
cm
cm
(A2.6)
S
The finite element strain energy for the case of applied nodal displacements, U ∆ , may be written as:
U∆ =
1 {Q∆ }T {∆T } 2
(A2.7)
From Equation 2.32 the vector of true nodal displacements may be written as:
{∆T } = b[ p ]{ fcm }
(A2.8)
The consistent nodal forces are obtained from Equations A2.4, A2.5 and Equation 2.25 as:
283
Appendices
{QT } = b ∫ [N ]T [T ][h]{ f cm }dS
(A2.9)
S
and since {Q∆ } =
1 {QT }, U ∆ may be written as: a
U∆ =
For e ∆ =
b2 { fcm }T [h]T [T ]T [N ][ p ]{ fcm }dS ∫ 2a S
(A2.10)
U = a we must have: U∆
∫ { f } [h] [T ] [ p]{ f }dS = ∫ { f } [h] [T ] [N ][ p ]{ f }dS T
T
T
T
cm
cm
T
T
cm
S
cm
(A2.11)
S
Turning now to the case of applied consistent nodal forces we have the finite element strain energy U Q as:
UQ =
1 {QT }T {∆Q } 2
(A2.12)
The vector of consistent nodal forces {QT } is defined in Equation A2.9 and the corresponding nodal displacements {∆ Q } are given in Equation A2.2. Thus, we may write: UQ =
ab 2 2
∫ { f } [h] [T ] [N ][ p ]{ f }dS T
T
T
cm
(A2.13)
cm
S
note that the rigid body motion of Equation A2.2 does no work and is thus not included in Equation A2.13. UQ = a we must have: For eQ = U
∫ { f } [h] [T ] [ p]{ f }dS = ∫ { f } [h] [T ] [N ][ p ]{ f }dS T
cm
S
T
T
T
cm
cm
T
T
cm
(A2.14)
S
284
Appendices It is seen that Equation A2.14 is identical to Equation A2.11. Thus starting from Equation A2.1 in order to prove that e ∆ = eQ = a we must prove the equality of Equations A2.14 and A2.11.
Now, let us define the tractions due to the constant moment as:
{t cm } = [T ][h]{ f cm }
(A2.15)
and we can rewrite Equation A2.14 as:
∫ {t } [ p]{ f }dS = ∫ {t } [N ][ p ]{ f }dS T
cm
T
cm
cm
S
cm
(A2.16)
S
Now, for the constant moment stress field
{ f cm } = 0,0,0M1,0,0,0T
the
tangential components of the tractions are zero around the entire boundary and the normal components are zero on edges 1 and 3 as shown in Figure A2.1. Thus the only contribution to the integrals in Equation A2.16 comes from the non-zero normal components of traction on the edges 2 and 4. 3 2
4 1
Figure A2.1 Tractions due to a constant moment stress field In order to prove the equality of Equation A2.16 we must therefore show that the normal component of the boundary displacements in this equation are equal to each other along edges 2 and 4 of the element:
[ p]{ fcm } = [N ][ p ]{ fcm }
(A2.17)
285
Appendices Since we know that the displacement
[N ][ p ]{ f cm }
is linear (the shape
functions N are linear along an element edge) this equality will only hold if the normal component of the true boundary displacement is linear along these edges. Checking the u-component of displacement for this test field (see Equation 2.31) shows that this is the case.
Thus, in this manner it can be shown that for the rectangular element in a test field consistent with a constant moment stress field the error ratios e ∆ and eQ are equal.
286
Appendices APPENDIX 3
PROOF THAT NODAL QUADRATURE GIVES AN UPPER BOUND ON THE INTEGRATION
In this appendix a proof that nodal quadrature produces an upper bound for the integration of the error energies for rectangular elements is given. This proof was also presented in [ROB 93c]
From Equation 3.2 (§3.3)
{σ~e } = {σ~}− {σ h } .
In terms of local Cartesian
coordinates for an element, the estimated stress field {σ~} has bi-linear components of stress, whilst {σ h } has linear components. The estimated stress error can thus be written in the form:
{σ~e } = {σ~e }0 + {σ~e }1 x + {σ~e }2 y + {σ~e }3 xy where vectors
{σ~e }n
(A3.1)
contain stress components which represent the
coefficients of the polynomial terms for {σ~e } .
The estimated error energy density has the bi-quadratic form: 1 ~ T ~ {σ e } {ε e } = a0 + a1x + a2 y + a3 x 2 + a4 y 2 + a5 xy + a6 x 2 y + a7 xy 2 + a8 x 2 y 2 (A3.2) 2
The results of integrating each of the terms of the polynomial in Equation A3.2 separately are shown in Table A3.1. It is seen from this table that only the even-powered terms in both x and y make any contribution to the result, and nodal quadrature fails to distinguish between these terms. By only sampling
at
the
nodes,
integration of the
non-constant
functions
x 2 , y 2 and x 2 y 2 produces the same result as if these functions did not vary from their nodal values. Thus, the constant term is integrated correctly, but 287
Appendices the quadratic and bi-quadratic terms are over-integrated by factors of 3 and 9 respectively.
Integrand
Surface plot
Explicit Integration
Nodal Quadrature
4abt
4abt
x and y
0
0
xy
0
0
4 3 a bt 3
4 a 3 bt
0
0
4 3 3 a b t 9
4 a 3 b 3t
y
1 2a
2
x and y
2b x
2
xy 2 and x 2 y
2
x y
2
(i) For cases where two functions are listed the integration is the same but only the first of the terms has been plotted. (ii) The integrations are performed over a rectangular element of side 2 a by 2 b
Table A3.1 Bi-quadratic terms and their integration It is clear, therefore, that if the coefficients a 3 , a 4 and a8 are all positive, then nodal integration will over-estimate the error expressed by Equation A3.2. These coefficients are given by:
288
Appendices
1 ~ T −1 ~ {σ e }1 [D] {σ e }1 2 1 T −1 a4 = {σ~e }2 [D ] {σ~e }2 2 1 T −1 a8 = {σ~e }3 [D ] {σ~e }3 2 a3 =
(A3.3)
The coefficients are all non-negative due to the positive definite property of
D
−1
. Hence, nodal integration produces an over-estimate for an error
measure. From the three tests for which β has been reported (BMT1,4 and 7) it would appear that as h → 0 , the effectivity ratios β1 and β 4 tend to a value of approximately 2.8. Further investigations may reveal what the true figure is and, indeed, what it actually means.
This question is,
however, not considered further in this thesis.
This proof, which is for rectangular elements, is also applicable to parallelograms, but not to tapered elements where {σ h } is not necessarily linear and the Jacobian in not constant.
289
Appendices APPENDIX 4
DERIVATION OF AN EXPRESSION FOR THE STRAIN ENERGY OF THE ESTIMATED ERROR
In this appendix an expression for the strain energy of the estimated error ~ U e is derived.
The estimated error stress field is given in Equation 3.2 as:
{σ~e } = {σ~} − {σ h }
(A4.1)
From the definitions of {σ~} and {σ h } given in Equations 5.1 and 2.17 respectively we may rewrite Equation A4.1 as:
{σ~e } = [h]{ f }− [D ][B ]{δ }
(A4.2)
The strain energy density SED is then written as: T −1 T T T T T −1 SED = {σ~e } [D ] {σ~e } = ({ f } [h] − {δ } [B ] [D ] )[D ] ([h]{ f } − [D ][B ]{δ })
(A4.3)
which, on expansion gives: T T −1 SED = { f } [h] [D] [h]{ f }
− { f } [h] [D ] [D ][B ]{δ }− {δ } [B ] [D ] [D ] [h]{ f } T
−1
T
T
T
T
−1
(A4.4)
+ {δ } [B ] [D ] [D ] [D ][B ]{δ } T
Noting that D
−1
D = D D
T
−1
T
−1
= I this may be rewritten as: T T −1 SED = { f } [h] [D] [h]{ f }
− { f } [h] [B]{δ } − {δ } [B ] [h]{ f } T
T
T
T
(A4.5)
+ {δ } [B ] [D][B ]{δ } T
T
290
Appendices Observing that { f } [h] [B ]{δ } = {δ } [B ] [h ]{ f } means that: T
T
T
T
SED = { f } [h] [D ] [h]{ f } − 2{ f } [h] [B ]{δ } + {δ } [B ] [D ][B ]{δ } T
T
−1
T
T
T
T
(A4.6)
Integrating the strain energy density over the volume of the element yields ~ the strain energy of the estimated error U e as: 1 T ~ 1 T T U e = { f } [ A][ f ] − { f } [L ]{δ } + {δ } [k ]{δ } 2 2
(A4.7)
where
[A] = ∫ [h]T [D]−1[h] dV V
[L] = ∫ [h]T [B ] dV V
[k ] = ∫ [B ]T [D][B ] dV V
291
Appendices APPENDIX 5
PROOF THAT THE QUADRATIC STRESS FIELDS ARE NOT USED IN A LEAST SQUARES FIT TO BI-LINEAR STRESS FIELDS
In Section 5.3 of Chapter 5 it was stated that for parallelogram elements where the finite element stress field is linear a weighted least squares fit between the complete quadratic statically admissible stress field and this finite element stress field will not invoke the quadratic terms in the statically admissible stress field. This statement was based on observation of numerical experiments but can be proved algebraically in the following manner.
The weighted least squares fit discussed in Section 5.3 of Chapter 5 leads to the following equation (see Equation 5.4):
[A]{ f } = [L]{δ }
(A5.1)
Let us consider first the case where only linear statically admissible stress fields are used in the fit. For this case Equation A5.1 can be written as: ~ ∫ [h ] {ε }dV = ∫ [h ] {ε }dV T
1
V
where the columns of h 1
T
1
1
(A5.2)
h
V
form a basis for the complete linear statically
−1 −1 admissible stress fields, {ε~1 } = [D ] [h1 ]{ f1 } and {ε h } = [D ] [B ]{δ }.
Equation A5.2 implies an orthogonality property between the linear statically admissible stress fields and the strains ({ε~ }− {ε }) : 1
h
292
Appendices ~ ∫ [h ] ({ε }− {ε })dV = {0} T
1
1
h
(A5.3)
V
Writing out Equation A5.3 in full and performing the integration over a rectangular element of side 2a x 2b gives: 1 0 0 a b ∫− a −∫b x y 0 0
0 1 0 0 0 x y
0 0 1 a0 + a1 x + a2 y − y b0 + b1 x + b2 y dxdy ={0} 0 c0 + c1x + c2 y 0 − x
(A5.4)
a0 + a1 x + a2 y where b0 + b1 x + b2 y = ({ε~1} − {ε h }) - note that {ε~1 } and {ε h } are both linear c + c x + c y 2 0 1 functions.
Taking the first three equations of A5.4 gives: a b
∫ ∫ (a
0
+ a1x + a2 y )dxdy = 0 ⇒ a0 = 0
0
+ b1 x + b2 y )dxdy = 0 ⇒ b0 = 0
− a −b
a b
∫ ∫ (b
(A5.5)
− a −b
a b
∫ ∫ (c
0
+ c1 x + c2 y )dxdy = 0 ⇒ c0 = 0
− a −b
where the symbol ⇒ should be read as 'implies'.
The fact that the coefficients a 0 , b0 and c0 are zero means that the estimated stress field and the finite element stress field are equal at the isoparametric centre of the element. 293
Appendices
Let us now consider the case where the quadratic stress fields are included in the fit. Equation A5.1 becomes: T
T
T
~ ~ ∫ [h ] {ε }dV + ∫ [h ] {ε }dV = ∫ [h ] {ε }dV 1
1
1
V
2
1
V
h
V
(A5.6) T
T
T
~ ~ ∫ [h ] {ε }dV + ∫ [h ] {ε }dV = ∫ [h ] {ε }dV 2
1
2
V
where the columns of
2
2
V
h
V
form a basis for the quadratic statically
h2
−1 admissible stress fields and {ε~2 } = [D ] [h2 ]{ f 2 }.
Now, through observation we have seen that
{ f 2 } = {0}.
For this to be true
Equation A5.6 reduces to: T
T
~
∫ [h ] {ε }dV = ∫ [h ] {ε }dV 1
1
1
V
h
V
(A5.7) T
T
~
∫ [h ] {ε }dV = ∫ [h ] {ε }dV 2
1
2
V
h
V
and this implies an extension of the orthogonality property of Equation A5.3 to the complete quadratic statically admissible stress fields: ~ ∫ [h ] ({ε }− {ε })dV = {0} T
1
1
h
V
(A5.8) ~
∫ [h ] ({ε }− {ε })dV = {0} T
2
1
h
V
The second of these equations requires orthogonality between the quadratic statically admissible stress fields and the strains ({ε~1 }− {ε h }) and this requirement may be written as:
294
Appendices
x2 y 2 − 2 xy 2 0 0 a0 + a1 x + a2 y a b y ∫− a −∫b 0 x 2 0 b0 + b1 x + b2 y dxdy ={0} 2 0 2 xy − x c0 + c1 x + c2 y 2 xy 0 − y 2
(A5.9)
Noting that all odd terms integrate to zero over a rectangular region and that the coefficients a 0 , b0 and c0 are zero proves that for rectangular elements the quadratic statically admissible stress fields are not invoked in the weighted least squares fit.
295
Appendices APPENDIX 6
ALGEBRAIC ARGUMENT FOR THE EXISTENCE OF INADMISSIBLE MODES OF TRACTION
In Chapter 6 it was discovered that certain modes of applied traction were inadmissible with the linear statically admissible stress field {σ~ } permitted 3
in the element. This was demonstrated for an element in BMT10 where the true traction distribution corresponding to a particular mode of applied traction could be easily deduced c.f. Figures 6.21 and 6.22 which show, respectively, the required traction distribution and those permissible with the element under consideration. The argument put forward in Chapter 6 was based on observation.
In this appendix a more formal, algebraic
argument is presented. The work in this appendix draws on that described in [MAU 93b].
Using linear boundary tractions there are four modes of traction allowable on an element edge. Thus, for a quadrilateral element there will be 16 possible modes of boundary tractions and these are shown for a square element in Figure A6.1.
n1
t1
m1
s1
n2
t2
m2
s2
n3
t3
m3
s3
n4
t4
m4
s4
Figure A6.1 Modes of linear boundary tractions for a square element 296
Appendices For element equilibrium these 16 modes of boundary traction are coupled by the three planar equations of equilibrium.
Thus, after enforcement of
element equilibrium, there remain 13 independent modes of boundary traction. The three planar equilibrium conditions can be expressed in terms of the modes of boundary traction shown in Figure A6.1 and for a rectangular element of side length 2ax2b (see, for example, Figure A1.1) are: n1 − t 2 − n3 + t 4 = 0 t1 + n 2 − t 3 − n 4 = 0 m1 + m2 + m3 + m 4 − a ( t1 + t 3 ) − b ( t 2 + t 4 ) = 0
(A6.1)
A matrix equation relating the 13 independent modes of boundary traction
{g } to the full set of 16 tractions {t} can be written
[A]{g} = {t}
(A6.2)
(16x13)
Choosing n1 , t1 and m1 as the dependent components of {t } Equation A6.2 may be written explicitly as:
0 0 1 0 0 − 1 0 0 0 a − b − 1 1 0 0 0 0 1 0 0 0 0 1 0 0 0 0 1 0 0 0 0 0 0 0 0 0 0 0 0 0 0 0 0 0 0 0 0 0 0 0 0 0 0 0 0 0 0 0 0 0 0 0 0
0 1
0
0
0
0 0
1
0
0
0 0 − 2a − 1 0 0 0
0
0
0
0 0
0
0
0
0 0
0
0
0
0 0
0
0
0
1 0
0
0
0
0 1
0
0
0
0 0
1
0
0
0 0
0
1
0
0 0 0 0
0 0
0 0
1 0
0 0
0
0
0
0 0
0
0
0
0 0
0
0
0
n1 t 1 0 0 0 s 1 1 − a − b − 1 0 n m1 2 0 0 0 0 s1 t2 0 0 0 0 n2 m2 0 0 0 0 t2 s 0 0 0 0 2 m2 n 0 0 0 0 3 s2 t = n 0 0 0 0 3 m 3 0 0 0 0 3 t3 s 0 0 0 0 3 m3 n 0 0 0 0 4 s3 t 1 0 0 0 4 n m 4 0 1 0 0 4 t 4 s 0 0 1 0 4 m 4 0 0 0 1 s4 0
−1
0
0
(A6.3)
297
Appendices The columns of the matrix in Equation A6.3 represent the 13 independent modes of boundary traction and are shown, for a square element of side length 1m, in Figure A6.2. These modes of traction form a basis for the {g } vector.
g1
g5
g9
g2
g6
g10
g 13
Normal force of 2N Tangential force of 2N g3
g7
g11
g4
g8
g12
Moment of 1Nm
Figure A6.2 Independent modes of boundary traction for a square element
If the internal element stress field permits all the independent modes of boundary traction then it is called a regular element. Thus, for a regular quadrilateral element there must be 13 independent modes of stress within the element. Such elements exist and have been discussed in, for example, [MAU 90]. For the element being used in the iterative method the linear statically admissible stress fields {σ~ } contain seven independent modes of 3
stress and, as such, the element is not regular.
The element is thus
deficient in stress fields and, therefore, will not be able to model an arbitrary (but linear) applied mode of traction.
The seven modes of
boundary traction corresponding to the seven linear statically admissible stress fields in {σ~ } are shown in Figure A6.3 3
298
Appendices
Mode 1
Mode 2
Mode 3
Mode 4
Mode 5
Mode 6
Mode 7
Figure A6.3 Boundary tractions corresponding to linear stress fields {σ~3 }
The relationship between the modes of boundary traction corresponding to the linear statically admissible stress fields {σ~ } represented by the vector 3
{f }
and the 13 independent modes of boundary traction required by the
regular element and represented by the vector {g } can be written in matrix form:
[e]{ f } = {g}
(A6.4)
(13 x 7 )
For the linear statically admissible stress fields {σ~3 } the matrix e is given by: 0 0 0 0 0 1 [ e] = 0 0 0 0 0 0 0
0
0
1
0
0
1
0
0
0
0
0 −1
1
0
0
0
0
0
0 −1
0
0
0
0
0
0
0
−1 0
0
0
1
0
0
0
0
0
0
1
0
0
0
−1 0
0
1
0
0
0
0
0 −1 −1 0
0
0
0
0
0
1
0
0
0
0
0
0
1
0 1 0 1 0 0 −1 0 0 −1 0
(A6.5)
Since the columns of the matrix e correspond to independent stress fields then the rank of e is ρ e = 7 and all vectors
{ f } have non-zero boundary
tractions {g } . However, because e is rectangular (i.e. because there is a deficiency of available stress fields) the existence of solutions to Equation 299
Appendices A6.4 will depend on whether or not the vector
{g }
is consistent (i.e. on
whether or not the applied boundary tractions are admissible). Standard tests for consistency of a set of linear equations (see for example [BAR 90b]) could be used for a particular vector
{g } .
Such tests require the
determination of the rank of the matrix e and of the augmented matrix
[eM g ] .
If ρ [e] = ρ [e M g ] then the vector {g } is consistent (admissible). An
alternative approach for checking the consistency (admissibility) of a vector
{g } following that presented in [MAU 93b] is now given. Corresponding to the vector { f } (representing the independent stress fields in the element) and the vector {g } (representing the independent modes of traction for a linear regular element) are the vectors of conjugate deformations {δ } and displacements {q} respectively. These quantities are related through the contragredient transformation:
[e]T {q} = {δ }
(A6.6)
( 7 x13 )
Solutions
to
the
homogeneous
form
of
Equation
A6.6
represent
displacements for which there are no corresponding stresses or tractions. These solutions are termed spurious kinematic modes and belong to the T
nullspace of e .
A basis for the nullspace of e
T
forms an orthogonal
complement c to the matrix e such that:
e
T
c = c
T
e = 0
(A6.7)
( 13 x 6 )
Now, if we pre-multiply Equation A6.4 with the matrix c
T
we obtain:
[c]T [e]{ f } = [c]T {g}
(A6.8)
and by substituting Equation A6.7 into Equation A6.8 it is seen that: 300
Appendices
[c]T {g} = {0}
(A6.9)
For a vector of boundary tractions to be admissible it must satisfy Equation A6.9.
The orthogonal complement c to the matrix e of Equation A6.5 has been constructed for the square element of side length 1m using singular value decomposition [BAR 90b] and is given as: − 0.866 0 0.288 0 0 0 [c] = 0 0 − 0.288 0 − 0.288 0 0
0
0
0
0.154 0.094 0.650 − 0.062 − 0.118 0.364 0 0 0.293 0.166 0 0 0.015 0.021 0.048 − 0.169 0.139 0.072 0.650 − 0.062 0.077 0.871 0
− 0.104 − 0.448 − 0.205 − 0.048 0.493
− 0.019
0.181
− 0.098
0.042
− 0.248
− 0.054
0.756
− 0.252
0
0
0
0.221
0.005
0.639
0
0
0
0.766
− 0.045 − 0.277
0.104
0.448
0.205
− 0.272
0.025
0.458
− 0.098
0.042
− 0.248
− 0.042 − 0.135 − 0.023
0
0.169
(A6.10)
The six columns of the matrix c represent the six spurious kinematic modes that may occur for this element.
In Chapter 6 the particular mode of boundary traction which was found by inspection to be inadmissible was shown in Figure 6.20 and is reproduced here in Figure A6.4. 15N
10N
8 M1
2.5-M1
5N
Figure A6.4 Mode of inadmissible traction discovered in Chapter 6
301
Appendices The mode of traction shown in Figure A6.4 has the following {g } vector (see Figure A6.2):
{g } = 0,0,0,0,0,7.5,0,− M 1,0,0,2.5, (M1 − 2.5),0T
(A6.11)
Performing the test for admissibility of a traction vector, as defined in Equation A6.9, it is seen that we obtain:
− 0.721 − 0.098M − 0.436 1 0 . 042 M − 0 . 041 1 [c]T {g} = ≠ {0} − 0 . 249 M + 1 . 767 1 0.650 M 1 − 1.278 − 0.063M 1 + 0.337
(A6.12)
and it is seen that this traction vector fails the test for all values of M 1 and is therefore shown to be inadmissible.
In Section 6.3 it was observed that the seven self-stressing modes that could exist in a 2x2 mesh of regular elements simply did not exist as admissible sets of boundary tractions with the available seven linear statically admissible stress fields. This observation has been backed up algebraically by testing these self-stressing modes for admissibility i.e. through Equation A6.9.
All self-stressing modes yielded non-zero right hand sides to this
equation.
302
REFERENCES [AIN 89] M. Ainsworth, J.Z. Zhu, A.W. Craig & O.C. Zienkiewicz, 'Analysis of the Zienkiewicz-Zhu A Posteriori Error Estimator in the Finite Element Method', Int. J. Num. Methods in Eng. Vol. 28, 2161-2174 (1989). [AKI 94] J.E. Akin, 'Finite Elements for Analysis and Design', Academic Press (1994). [BAR 76] J. Barlow, 'Optimal Stress Location in FEM', Int. J. Num. Methods in Eng. Vol. 10, 243-251 (1976). [BAR 87] J. Barlow, 'Distortion Effects in Isoparametric Elements, An Analytic Approach', Paper presented at the NAFEMS AGM Technical Session, September (1987). [BAR 90a] J. Barlow, 'Critical Tests for Element Shape Sensitivity', RollsRoyce plc, (1990). [BAR 90b] S. Barnett, 'Matrices: Methods and Applications', Clarendon Press, Oxford, (1990). [BUR 87] D.S. Burnett, 'Finite Element Analysis', Addison Wesley, (1987). [BEC 93] P. Beckers, H.G. Zhong & E.A.W. Maunder, 'Numerical Comparison of Several A Posteriori Error Estimators for 2D Stress Analysis', Revue europeenne des elements finis. Vol. 2, pp 155-178, (1993). [GAG 82] J.P. Gago, 'A Posteriori Error Analysis and Adaptivity for the Finite Element Method', Ph.D thesis, University of Wales, Swansea, U.K. (1982) [HIN 74] E. Hinton & J.S. Campbell, 'Local and Global Smoothing of Discontinuous Finite Element Functions using a Least Squares Method', Int. J. Num. Methods in Eng. Vol. 8, 461-480 (1974).
303
References [IRO 72] B.M. Irons & A. Razzaque, 'Experience with the Patch Test for Convergence of Finite Element Method, in Mathematical Foundations of the Finite Element Method', (ed. A.K. Aziz) pp. 557-587, Academic Press, (1972). [KEL 83] D.W. Kelly, J.P. Gago, O.C. Zienkiewicz & I. Babuska, 'A Posteriori Error Analysis and Adaptive Processes in the Finite Element Method: Part I-Error Analysis', Int. J. Num. Methods in Eng. Vol. 19, 15931619 (1983). [LAD 83] P. Ladevèze & D. Leguillon, 'Error Estimate Procedure in the Finite Element Method and Applications', SIAM J. Numer. Anal. 20 (No. 3), 483-509 (1983) [MAS 93] A. Mashaie, E. Hughes & J. Goldak, 'Error Estimates for Finite Element Solutions of Elliptic Boundary Value Problems', Computers & Structures, Vol. 39, No. 1, 187-198, (1993). [MAU 89]
E.A.W. Maunder, 'Interpreting Stress Outputs from the
''Standard'' Four-Node Quadrilateral', FEN, Issue No.2, (1989). [MAU 90] E.A.W. Maunder & W.G. Hill, 'Complementary use of Displacement and Equilibrium Models in Analysis and Design', Proceedings of the sixth World Congress on Finite Element Methods, Banff, (1990). [MAU 93a] E.A.W. Maunder, P. Beckers & H.G. Zhong, 'Reliability of some A Posteriori Error Estimators Related to the Equilibrium Defaults of Finite Element Solutions', Int. Rep. SA-167, LTAS, University of Lèige, Belgium (1993) [MAU 93b] E.A.W. Maunder & A.C.A. Ramsay, 'Quadratic Equilibrium Elements' Proceedings of the seventh World Congress on Finite Element Methods, Monte-Carlo, (1994). [OHT 90] H. Ohtsubo & M. Kitamura, 'Element by Element A Posteriori Error Estimation and Improvement of Stress Solutions for Two-Dimensional Elastic Problems', Int. J. Num. Methods in Eng. Vol. 29, 223-244 (1990). [OHT 92a] H. Ohtsubo & M. Kitamura, 'Element by Element A Posteriori Error Estimation of the Finite Element Analysis for Three-Dimensional Elastic Problems', Int. J. Num. Methods in Eng. Vol. 33, 1755-1769, (1992). 304
References
[OHT 92b] H. Ohtsubo & M. Kitamura, 'Numerical Investigation of Element-Wise A Posteriori Error Estimation in Two and Three Dimensional Elastic Problems', Int. J. Num. Methods in Eng. Vol. 34, 969-977, (1992). [PRE 89] W.H. Press, B.P. Flannery, S.A. Teukolsky & W.T. Vetterling, 'Numerical Recipes (FORTRAN)', Cambridge University Press, (1989). [RAM 94] A.C.A. Ramsay & H. Sbresny, 'Some studies of an Error Estimator Based on a Patch Recovery Scheme', FEN Issue No. 2, (1994). [RIC 10] L.F. Richardson, 'The Approximate Arithmetical Solution by Finite Differences of Physical Problems involving Differential Equations, with an Application to the Stresses in a Masonry Dam', Trans. Roy. Soc. (London), A210, 307-57 (1910). [ROB 79] J. Robinson & S. Blackham, 'An Evaluation of Lower Order Membranes as contained in the MSC/NASTRAN, ASAS and PAFEC FEM Systems', Report to the Royal Aircraft Establishment, Ministry of Defence, Farnborough, England (1979). [ROB 87] J. Robinson, 'Some New Distortion Measures for Quadrilaterals', Finite Elements in Analysis and Design 3, 183-197, (1987). [ROB 88] J. Robinson, 'Understanding Finite Element Stress Analysis', Robinson & Associates, (1988). [ROB 89a] J. Robinson, 'Element Shape Sensitivity Testing using the CREMethod and without a FEM System', Robinson & Associates, Great Bidlake Manor, Bridestowe, Okehampton, Devon EX20 4NT, England (1989). [ROB 89b] J. Robinson, 'How Accurate are my Finite Element Results - A Single Work-Done Error Measure', Robinson & Associates, Great Bidlake Manor, Bridestowe, Okehampton, Devon EX20 4NT, England (1989). [ROB 90] J. Robinson, 'An Evaluation of Two Four-Node Membranes for a Linear Endload Stress State', FEN Issue No. 3, (1990). [ROB 92a] J. Robinson, E.A.W. Maunder & A.C.A. Ramsay, 'Some Studies of Simple Error Estimators Part I - The Philosophy', FEN Issue No. 4 (1992). 305
References
[ROB 92b] J. Robinson, E.A.W. Maunder & A.C.A. Ramsay, 'Some Studies of Simple Error Estimators Part II - Problem 1 - Convergence Characteristics of the Error Estimators', FEN Issue No. 5 (1992). [ROB 92c] J. Robinson, E.A.W. Maunder & A.C.A. Ramsay, 'Some Studies of Simple Error Estimators Part III - Problem 2 - Effect of Element Distortion on Error Estimators', FEN Issue No. 6 (1992). [ROB 93a] J. Robinson, E.A.W. Maunder & A.C.A. Ramsay, 'Some Studies of Simple Error Estimators Part IV - Problem 3 - A Stress Concentration Problem', FEN Issue No. 1 (1993). [ROB 93b] J. Robinson, E.A.W. Maunder & A.C.A. Ramsay, 'Some Studies of Simple Error Estimators Part V - Problem 4 - Effect of Using Symmetry on the Error Estimators', FEN Issue No. 2 (1993). [ROB 93c] J. Robinson, E.A.W. Maunder & A.C.A. Ramsay, 'Some Studies of Simple Error Estimators Part VI - The Concluding Part' , FEN Issue No. 3 (1993). [SBR 93] H. Sbresny, 'Evaluation of the Recently Proposed Error Estimator of Zienkiewicz & Zhu for several Benchmark Tests (Studies on their new Patch Recovery Scheme and Examination of a new Stress Recovery)', Study project submitted under the ERASMUS scheme to the University of Exeter October (1993). [STR 92a]* T. Strouboulis & K.A. Haque, 'Recent Experiences with Error Estimation and Adaptivity. Part I: Review of Error Estimators for Scalar Elliptic Problems', Comp. Meth. Appl. Mech. Engng., Vol. 97, 399-436 (1992) [STR 92b]* T. Strouboulis & K.A. Haque, 'Recent Experiences with Error Estimation and Adaptivity. Part II: Error Estimation for h-adaptivity approximations on grids of triangles and quadrilaterals', Comp. Meth. Appl. Mech. Engng., Vol. 100, 359-430 (1992)
*
These important review references were brought to the authors attention by the external examiner of this thesis and are included here for completeness.
306
References [SZA 91] B. Szabo & I. Babuska, 'Finite Element Analysis', John Wiley & Sons, (1991) [TEN 91] R.T. Tenchev, 'Accuracy of Stress Recovering and a Criterion for Mesh Refinement in Areas of Stress Concentration', FEN, Issue No.5 (1991). [WIB 93a] N.-E. Wiberg & F. Abdulwahab 'Patch Recovery Based on Superconvergent Derivatives and Equilibrium', Int. J. Num. Methods in Eng. Vol. 36, 2703-2724 (1993). [WIB 93b] N.-E. Wiberg, 'Education and Understanding of the Finite Element Method', Proceedings of the seventh World Congress on Finite Element Methods, Monte-Carlo, (1993). [YAN 93] J.D. Yang, D.W. Kelly & J.D. Isles, 'A Posteriori Pointwise Upper Bound Error Estimates in the Finite Element Method', Int. J. Num. Methods in Eng. Vol. 36, 1279-1298 (1993). [ZHO 90] H.G. Zhong & P. Beckers, 'Solution Approximation Error Estimators for the Finite Element Solution', Int. Rep. SA-140, LTAS, University of Liège, Belgium, (1990). [ZHO 91a] H.G. Zhong & P. Beckers, 'Comparison of Different A Posteriori Error Estimators', Int. Rep. SA-156, LTAS, University of Liège, Belgium, (1991). [ZHO 91b] H.G. Zhong, 'Estimateurs d'Erreur A Posteriori et Adaptation de Maillages dans la Méthode des Éléments Finis ', Ph.D. thesis, University of Liège, Belgium, (1991). [ZIE 87]
O.C. Zienkiewicz & J.Z. Zhu, 'A Simple Error Estimator and
Adaptive Procedure for Practical Engineering Analysis', Int. J. Num. Methods in Eng. Vol. 24, 337-357 (1987). [ZIE 89] O.C. Zienkiewicz & R.L. Taylor, 'The Finite Element Method', fourth edition, Vol. 1, McGraw Hill, (1989). [ZIE 92a] O.C. Zienkiewicz & J.Z. Zhu 'Superconvergent Derivative Recovery Techniques and A Posteriori Error Estimation in the Finite Element Method Part I: A General Superconvergent Recovery Technique', Int. J. Num. Methods in Eng. Vol. 33, 1331-1364 (1992). 307
References [ZIE 92b] O.C. Zienkiewicz & J.Z. Zhu 'Superconvergent Derivative Recovery Techniques and A Posteriori Error Estimation in the Finite Element Method Part II: The Zienkiewicz-Zhu A Posteriori Error Estimator', Int. J. Num. Methods in Eng. Vol. 33, 1365-1382 (1992). [ZIE 93] O.C. Zienkiewicz, J.Z. Zhu & J. Wu, 'Superconvergent Patch Recovery Techniques - Some Further Tests', Communications in Num. Methods in Eng. Vol. 9, 251-258 (1993).
308