Hindawi Publishing Corporation Journal of Crystallography Volume 2016, Article ID 4351347, 11 pages http://dx.doi.org/10.1155/2016/4351347
Research Article Finite Element Simulation and X-Ray Microdiffraction Study of Strain Partitioning in a Layered Nanocomposite R. I. Barabash,1 V. Agarwal,2 S. Koric,2,3 I. Jasiuk,2 and J. Z. Tischler4 1
Materials Science and Technology Division, Oak Ridge National Laboratory, Oak Ridge, TN 37831, USA Mechanical Science and Engineering Department, University of Illinois at Urbana-Champaign, Urbana, IL 61801, USA 3 National Center for Supercomputing Applications, University of Illinois at Urbana-Champaign, Urbana, IL 61801, USA 4 Advanced Photon Source, Argonne National Laboratory, Argonne, IL 60439, USA 2
Correspondence should be addressed to R. I. Barabash;
[email protected] and I. Jasiuk;
[email protected] Received 28 February 2016; Accepted 4 May 2016 Academic Editor: Laszlo Toth Copyright © 2016 R. I. Barabash et al. This is an open access article distributed under the Creative Commons Attribution License, which permits unrestricted use, distribution, and reproduction in any medium, provided the original work is properly cited. The depth-dependent strain partitioning across the interfaces in the growth direction of the NiAl/Cr(Mo) nanocomposite between the Cr and NiAl lamellae was directly measured experimentally and simulated using a finite element method (FEM). Depth-resolved X-ray microdiffraction demonstrated that in the as-grown state both Cr and NiAl lamellae grow along the ⟨111⟩ direction with the formation of as-grown distinct residual ∼0.16% compressive strains for Cr lamellae and ∼0.05% tensile strains for NiAl lamellae. Three-dimensional simulations were carried out using an implicit FEM. First simulation was designed to study residual strains in the composite due to cooling resulting in formation of crystals. Strains in the growth direction were computed and compared to those obtained from the microdiffraction experiments. Second simulation was conducted to understand the combined strains resulting from cooling and mechanical indentation of the composite. Numerical results in the growth direction of crystal were compared to experimental results confirming the experimentally observed trends.
1. Introduction Strain partitioning is the most important phenomenon responsible for unique properties of composites [1–7]. The role of interfaces in strain partitioning in composites was emphasized by a number of authors [8, 9]. In particular, Nibased [3] and especially NiAl-based composites are the focus of current research because they can operate at high temperatures (up to 1300∘ C) in corrosive environments [10–17]. They can be used for high temperature applications including structural components in energy conversion facilities, for example. It was shown that small additions of Mo (up to 6 at%) change the morphology of the Cr phase from rodlike to lamellar [11, 18]. Therefore, NiAl/Cr(Mo) system has recently attracted attention because both phases grow into lamellae during crystallization [10, 11, 18–22]. However, the mechanism of strain partitioning in these alloys and the role of interfaces in load transfer from one phase to another are still poorly understood. These open issues provided motivation for this study.
Spherical indentation is one of the possible techniques to study the strain partitioning under loading in these alloys. The advantage of using spherical indentation as compared to uniaxial tension/compression measurements is that during indentation the deformation is changing from the maximum under an indent to zero in the area not affected by the indentation. Therefore, all information about the indentationinduced strain partitioning is confined in a relatively small volume which can be both assessed experimentally and simulated with FE. The spherical shape of the indent was chosen in order to prevent the interplay between the specific shape of the indent with the crystal lattice anisotropy.
2. Materials and Experimental Procedures 2.1. Growth of NiAl/Cr(Mo) Eutectic Alloys. The NiAl-Cr phase diagram has a eutectic composition at 34 at% Cr at the temperature 𝑇eut = 1450∘ C. The eutectic temperature is lower than the melting temperature of Cr (𝑇 = 1880∘ C) and
2
Journal of Crystallography Load on sample (mN) 1000
Load (mN)
800
1
2
600 400
m b ea cro i M
200 10 𝜇m
0 0
(a)
3 –1 0
2 –1 1
2 –2 2
Cr #229 1 m–3 m (4.868, 5.017, 7.151) 90∘ 0 –1 1
1 –1 2
200
301
1000
0 –1 3
101
−1 –1 2
002
211
2 1 –1
112
222 110
013
121
011
2 2 –2 130
031 −1 2 1
020 0 3 –1
Cr
A Ni
103 310
1 2 –1
400 600 800 Displacement (nm) (b)
1 –2 1
3 0 –1
200
l
A Ni
l
A Ni
l
−1 0 3
−1 1 2
−1 0 1
Cr
Cr
−2 2 2 −2 1 1
−1 3 0
X-ray microbeam −1 1 0 (c)
(d)
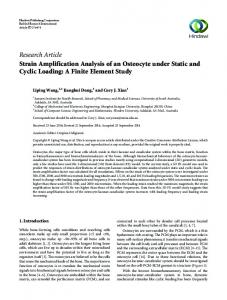
Figure 1: (a) SEM image of the indented area with Cr lamellae in NiAl matrix chosen for DAXM measurements. The growth direction of both lamellae kinds is along ⟨111⟩ direction. The direction of the beam trajectory intercepting the sample surface at 45∘ is shown by an arrow. Depth-resolved DAXM measurements of the indented sample were performed for locations 1 and 2. (b) Load-displacement curve during the indentation. The main parameters of the load-displacement curve, maximum force and displacement during indentation, were further used in simulations. (c) Stereographic projection showing that growth is along ⟨111⟩ crystallographic direction. The different fonts of the crystallographic indices on the figure refer to different symmetry of crystallographic directions. Larger indices correspond to higher symmetry directions. For example, the ⟨222⟩ direction corresponds to growth direction that is almost in the center of the projection, and other directions from the same family, that is, [2, 2, −2], [2, −2, 2], and [−2, 2, 2] are of the same size. (d) Geometry of the X-ray microbeam intercepting different NiAl and Cr lamellae with depth.
of NiAl (𝑇 = 1674∘ C) [13]. The elastic moduli of pure NiAl and Cr single crystals along the ⟨111⟩ directions are 277 and 248 GPa, respectively [11]. The lattice parameters mismatch is ∼0.1%. In this study, the NiAl/Cr alloys were additionally alloyed by 3 at% Mo to obtain a lamellar microstructure of the composite. Therefore, the lattice parameters of the NiAl and Cr(Mo) lamellae were measured in this study before indentation. The NiAl/Cr(Mo) samples were directionally crystallized leading to the formation of the well-aligned NiAl and Cr lamellae (Figure 1(a)). The details of the alloy
preparation and eutectic growth can be found elsewhere [10, 11]. The spacing and relative size of lamellae depend on the growth rate and composition, and under the conditions of this experiment, they resulted in approximately parallel lamellae with nearly equal thickness with periodicity of ∼1.2 𝜇m. Cr (3% Mo) lamellae have a BCC structure while intermetallic NiAl lamellae have an ordered CsCl-type B2 structure [5]. Both NiAl and Cr (3% Mo) lamellae grow along the ⟨111⟩ direction, forming heterointerfaces parallel to (1 12) type planes in both phases [11]. Mo is mainly found in
Journal of Crystallography the Cr lamellae, although small traces of Mo are also present in NiAl lamellae. Thus, lattice parameters of the two lamellae types differ from those of pure NiAl and Cr. Sample preparation was as follows. Samples were cut from a directionally solidified Cr(Mo)-NiAl eutectic rod perpendicular to the growth direction (cross section), mounted in epoxy, and then polished. Two kinds of samples were prepared: (1) in the first sample, the matrix was etched away at the depth of ∼5 𝜇m; this sample was used to determine residual as-grown stresses in the lamellae; (2) the second sample was only slightly etched (several nm) to reveal the microstructure (Figure 1(a)). This sample was further indented and studied for strain partitioning between lamellae. The orientations of the lamellae along the growth direction were determined from the Laue pattern. The alternating Cr/NiAl lamellae are visible on the scanning electron microscopy (SEM) image of the sample cross section (Figure 1(a)). The orientation of the surface normal was along the [111] direction for both Cr and NiAl lamellae. 2.2. Indentation. Spherical indentation on the polished surface perpendicular to the growth direction was conducted with an MTS Nano Indenter XP equipped with a sapphire tip with radius of 100 𝜇m to a prescribed load of 𝑃 = 1,000 mN. Load-displacement curves were recorded for each indentation (Figure 1(b)). The maximum force during indentation reached 1,000 mN and the displacement during indentation did not exceed 1100 nm. These parameters were further used in simulations of the indentation-induced deformations. 2.3. Depth-Resolved X-Ray Strain Microscopy. Synchrotron polychromatic X-ray microdiffraction (PXM) was performed at the 34ID-E beamline of the Advanced Photon Source at the Argonne National Laboratory with a focused ∼0.3 × 0.4 𝜇m beam with an energy-dependent penetration depth ∼30– 50 𝜇m. The energy range of the polychromatic microbeam was within 5–27 keV. PXM allowed studying orientation spread within the irradiated volume using a modified Laue technique. The experimental setup of the beamline permits moving the monochromator into the beam and working with monochromatic radiation as well. Measurements with monochromatic radiation provide information about dilatational strain gradients. Measurements with both polychromatic (Laue) and monochromatic radiation were performed. In this setup, the X-ray microbeam intercepts the sample surface at ∼45∘ and penetrates into the depth of the NiA/Cr(Mo) sample reaching ∼50 𝜇m. Therefore, the diffracted radiation integrates inputs from all depths and lamellae intercepted by the beam. To disentangle this depth-integrated intensity and to obtain depth-resolved information about individual submicron-size lamellae, a special differential-aperture X-ray microscopy (DAXM) technique was applied [11, 23–27]. With the DAXM technique, a platinum wire with a diameter of ∼50 𝜇m serves as a differential aperture. During the depthresolved measurements, the wire is moving parallel to the sample surface in the diffracted radiation field and shadows portion by portion the Laue patterns, depending on the relative position of the wire and the sample surface. Typically,
3 for each measured location, about ∼400 partially shadowed images are taken. Together with initial depth-integrated Laue pattern, these 400 patterns are analyzed using a ray-tracing algorithm. As a result, complete depth-resolved information on the intensity from each micrometer of depth is recovered. The DAXM technique can be performed using a polychromatic (PDAXM) or monochromatic (MDAXM) radiation [28]. Both techniques allow obtaining information with a 1 𝜇m depth resolution. PDAXM reveals lattice orientation gradients with depth, while MDAXM gives information about dilatational strain gradients with depth. In order to perform MDAXM measurements, first the complete Laue pattern should be obtained and indexed using a depthintegrated PXM. After indexation, the energy corresponding to a maximal intensity of the specific ℎ, 𝑘, 𝑙 reflection, 𝐸ℎ𝑘𝑙 , is determined and is used as a mean energy for the energyscans. The energy-scan can be performed in steps within the above energy range around the mean 𝐸ℎ𝑘𝑙 value. Furthermore, for each energy value, the depth-resolved measurements with platinum wire were performed. Such depthresolved energy-scans, MDAXM, provided unique detailed information about the phase-specific dilatational strain gradient with depth. Both PDAXM and MDAXM were used in this study. For spherical indentation, it is important that the depthresolved X-ray strain microscopy allows for resolving strains with 1 𝜇m steps in the depth along the beam path. The 0.3 × 0.4 𝜇m size of the beam is smaller than the thickness of individual lamellae allowing for resolving strain information separately from NiAl and Cr lamellae. The characteristic length of strain changes, so-called “slip zone,” typically extends over 10–20 𝜇m in depth. Therefore, the 1 𝜇m step size gives a unique possibility of measuring the depth-resolved strain gradients and further compare them with strains obtained using FE simulations.
3. Results and Discussion 3.1. Residual as-Grown Stresses. An SEM image of the cross section of the sample shows alternating NiAl and Cr lamellae with the total thickness of 1200 nm (Figure 1(a)). The area of the indent is marked by a dashed circle (Figure 1(a)). Stereographic projection obtained from an undeformed region with PDAXM method (Figure 1(c)) unambiguously indicates that both kinds of lamellae grow along the [111] crystallographic direction. Both NiAl and Cr lamellae contain small amounts (up to 3%) of Mo which affects the value of the lattice spacing. The reference samples for these compositions of lamellae cannot be prepared and measured independently because the melting point of Mo is much higher than, for example, the boiling point of Al. Therefore, it is practically impossible to prepare these compositions without crystallizing a composite. In order to determine strains in the composite constituents, it was necessary first to measure the strain-free lattice spacing of both phases as they differ from theoretical values for pure NiAl and Cr. With the synchrotron PXM and DAXM measurements, the differences of the reciprocal lattice spacings for ℎ, 𝑘, 𝑙 reflection, 𝑄ℎ𝑘𝑙 , are determined more precisely than their absolute values. The reciprocal lattice
4
Journal of Crystallography 151.0
6
150.0
Cr/NiAl lamellae (444)
149.5
Cr top
149.0
Cr
Qc = 149.2129 (nm−1 ) FWHM = 0.058
4 Intensity
150.5 Q (nm−1 )
NiAl/Cr lamella (444)
NiAl
Cr top
NiAl bulk
Cr bulk
2 NiAl top
148.5 −40
−30
−20 −10 Depth (𝜇m)
0
10
(a)
0 148.5
149.0
149.5 150.0 Q (nm−1 )
150.5
151.0
(b)
Figure 2: (a) Depth-resolved reciprocal lattice spacing 𝑄444 -distribution measured in the energy interval for 4, 4, 4 reflection. (b) Line profiles corresponding to the stress-free NiAl and Cr lamellae at the surface (green open circles) and in the bulk of the composite (red filled squares). Thin vertical line in (b) is the theoretical value of the reciprocal lattice spacing taken from the literature for pure NiAl. The measured relaxed NiAl (Mo) lattice parameter differs from the one for pure NiAl due to the presence of Mo.
spacings of the NiAl and Cr(Mo) are relatively close and it was possible to measure them simultaneously in one scan, which essentially improved the accuracy of the result. To get information about the possible as-grown residual strains, the depth-resolved reciprocal lattice spacings were measured with MDAXM in the first sample, where matrix was etched away at the depth of ∼5 micrometers. As both lamellae kinds grow along the ⟨111⟩ crystallographic direction, the 4, 4, 4 reflection for both lamellae kinds was chosen to study the strain gradients. The 4, 4, 4 reflections for both NiAl and Cr(Mo) lamellae are close in both the orientation space and their absolute values. The relatively small difference between the NiAl and Cr inverse lattice spacing, corresponding to 4, 4, 4 reflection, allowed for measuring both of them in one scan. Therefore, the mean energy value for this energyscan was chosen in the middle between the energies corresponding to the NiAl and Cr 4, 4, 4 reflections. The energy of the beam was scanned in the range corresponding to the 4, 4, 4 reflection with a step of 3 eV for both samples within the range of keV including the reflections for both phases (Figure 2(a)). The small X-ray beam size (