FinQL: A Query Language for Big Data in Finance November 1, 2015 Julian Mulla Illinois Institute of Technology 565 W. Adams, Chicago, IL 60661
Ben Van Vliet, Corresponding Center for Strategic Finance Stuart School of Business 565 W. Adams, Chicago, IL 60661 e.
[email protected] p. 312 906-6513 Abstract: This paper presents the design rationale and specifications for FinQL, a new, domain specific, query language that addresses the complexities of time series data, research idea articulation, and backtesting in finance. The language empowers end users by enabling them to write queries in a syntax similar to the natural language used in the domain. We present the underlying domain model, define the structure and syntax of FinQL, and show how it enables both longitudinal and cross-sectional analysis as well as some automation of the research process. We demonstrate the expressive power of FinQL through examples and extend it to activity-based and range-based series. Key Words:
query language, trading strategy, backtesting
1
1.
INTRODUCTION A query language is a special-purpose language for constructing queries to retrieve information from a database of information stored in the computer. It is usually intended to be used by people who are not professional programmers. —Reisner, 1981 Tools that aid the analysis of big financial data are of interest to both academics and
practitioners. Academics use past prices, volumes, and economic data to test their research hypotheses, and industry professionals use these data to drive their trading decisions. One obstacle to analysis is the time series nature of the data. Traditional relational, columnar, and graph data models all have difficulty with order dependent, time series data. Extracting information requires linking rows or nodes using complex and computationally-expensive SQL joins (Lerner et al. 2004, Shasha 1999). Previous paradigms in the literature and the available vendor technologies that aim to address the time series problem in finance are not particularly fit-for-purpose. They come with proprietary or SQL-extension syntaxes that are difficult to learn and use and often with significant costs. Further, these languages are not sufficiently expressive to articulate research hypotheses or trading strategies (or more generally just research ideas) in an intuitive way. This means only professional programmers at financial or research institutions can retrieve information. Some vendor technologies use a visual query system, but the difficulties associated with the visual programming paradigm are fairly well-known. As functionality is added, all the boxes and lines can become more complex than text-based code and more difficult to debug (see for example Brooks 1995, Whitley 1997, Johnston et al. 2004). In many cases, vendor technologies do not facilitate replication or cross-platform integration, a necessary attribute for
2
implementation of research results. For all these reasons, researchers often develop ad hoc technologies to analyze their proprietary data (see Yang and Wu 2006). But, in these cases, time and effort is wasted on tasks unrelated to the search for information. End users of financial data (i.e. traders, portfolio managers, analysts, academics, etc.) need expressive, standardized and open source, query tools and databases that target the time series problem in finance (see Hochheiser and Shneiderman 2004). This paper presents the design rationale and specifications for FinQL, a new, domain specific query language for executing research questions and backtesting trading strategies against time series data in finance.1 The goal is to empower the end user by enabling them to write compact queries based upon the business aspects of information extraction and then delivering standardized result sets about past market behavior relative to the stated selection rules. Even in the case where a software developer writes the FinQL queries, the end user should still be able to determine if their research question has been implemented correctly. (This kind of debugging is completely out of question when using general purpose programming languages.) The FinQL project aims to balance four desired language features: 1) It should facilitate articulation through a straightforward, unambiguous syntax; 2) It should have expressive power that enables articulation of the greatest number of research questions and/or trading strategies; 3) It should incorporate the disparate perspectives and dialects of academics and practitioners; and, 4) It should be sufficiently aware of the underlying structure of the data so as to minimize the complexities of query processing and static analysis.
1
FinQL is being developed with support provided by the CME Group, Inc.
3
To avoid confusion over the remainder of the paper, we present FinQL, by and large, from the practitioner’s point of view. Because queries are questions to the database, we find it more intuitive to express examples as questions that traders might ask. These sometimes come in the form of trading strategies, which are sets of decision rules for opening and closing positions in the market in an attempt to shape the distribution of profits. Backtests2 of these rules produce descriptive statistics, such as means and standard deviations of hypothetical, past profits which enable calculation of the various performance ratios used to inform allocation decisions— Sharpe ratio (Sharpe 1994), information ratio (Grinold 1994), or more recently, the capability ratio of Kumiega, et al. (2014) or Cooper et al. (2015). In this paper, the trader’s questions are shown in italics. To connect these questions to the vocabulary of FinQL, FinQL keywords used in the text are shown in a different font and in bold, as in close. To summarize the contributions of this paper: 1) We develop a domain model by formalizing the structure of research questions in finance in Section 3. 2) We define the language, FinQL, including a dictionary of keywords in Section 4 and Appendix A. We also present detailed descriptions of the structures of simple and complex queries in Sections 5 and 6. 3) Because researchers often engage in cycling—iteratively testing many ideas quickly in order to find the best idea—we show how FinQL enables automation of the research process through ranges in Section 7. 4) We show how FinQL enables cross-sectional analysis in Section 8.
2
While backtesting is not without its shortcomings, it is thought to be a time and cost-effective way to evaluate trading strategies relative to testing them in live markets with real capital at risk.
4
5) We provide additional demonstration of the expressive power of FinQL through a series of examples in Section 9. 6) We describe how FinQL can be extended to evaluate queries over activity based and range-based intervals (not just time based ones) in Section 10. 2.
RELATED RESEARCH Research and development of domain specific query languages is common in the
computer science literature, and we will refer to a few such endeavors. For example, PQL (Mork, et al. 2002) was developed for genetic data. Arasu et al. (2006) presents CQL for continuous queries over streams of data. Buneman and Frankel (1979) develops FQL, the functional query language. Han et al. (1996) introduced the data mining query language DMQL. Kersten et al. (2011) developed SciQL, an SQL extension language for science applications. Ramakrishnan et al. (1998) invented SRQL, sorted relational query language. There are many others. Various authors have also developed query languages for time series data. Haigh et al. (2004) present VQL, the Visual Query Language. Several authors have contributed to TQuel (as one example, see Snodgrass et al. 1993). Some of these languages specifically target the finance domain. Lerner and Shasha (2003) present the SQL-extension language AQuery for orderdependent queries in finance. Whitney and Shasha (2001) present the SQL-extension KQL, which is aimed at querying billions of trades and quotes. These languages are significant contributions and some are widely used in the financial industry. However, their SQL-extension syntaxes are by and large we believe beyond the technical ability of many end users. Financial firms often employ professional programmers to design and implement queries. The
5
contribution of this paper is propose a simpler syntax, one built on the natural language of end users. We also note other important contributions related to the time series problem in finance. Huang et al. (1999) discusses processing queries on time-series data, including examples from the financial domain. Chandra and Segev (1993) discusses problems associated with data for trading applications and the design issues faced when modeling trading systems in extensible database management systems. The FinTime project at NYU (see Jacob and Shasha 1999) defines benchmark that characterizes these financial time series data systems. This paper focusses on the articulation of research questions from the end user’s perspective. It does not present a canonical form of the proposed language, nor does it provide query processing algorithms or an underlying database model. Ease-of-use from the end users point of view is the overarching goal of the FinQL project, which is itself an area of research in the literature. For example, Reisner (1981), Schneiderman (1978), Thomas (1983), and Thomas and Gould (1975), Chan et al. (2005), Topi et al. (2005), Barisic et al. (2012), and Ahadi et al. (2015) have all contributed to the understanding of human factors in query language design and use. This research has informed the development of FinQL. In particular, we identify three underlying factors that enable domain specificity and facilitate ease-of-use: 1) With some small dialectal variation, end users understand the jargon used in the finance domain. 2) End users naturally use a linear, non-procedural structure (i.e. while there are “if” statements, there are no variables, arrays, loops, etc.) to articulate research questions and trading strategies. Furthermore, this natural structure maintains compositionality
6
(i.e. complex queries are made up of smaller, simpler ones (Broekstra and Kampman 2003)). 3) End users have accurate conceptual views, or mental data models. This is to say that end user’s natural problem statement formulations implicitly assume the correct structure of the data. This has the advantage that FinQL queries can be more data model aware, which facilitates query parsing and evaluation. FinQL takes advantage of these factors in its design, which should enhance ease-of-use. Adding in keywords that are appropriate to the end user’s functional or geographic area should also help minimize inconsistency among end users’ translation strategies, from problem statement formulation to planning to FinQL query coding (see Reisner 1981; Gould and Ascher 1975). 3.
FinQL DESIGN In taking a fresh look at query articulation in finance, the FinQL project embraces Evans
(2004)-style domain driven design (DDD). In this section, we distill a domain model which formalizes the natural language of finance. This domain model forms the backbone of FinQL queries. As an example of the linear, non-procedural language structure of research questions, consider, for example, that a trader might want to know: What happens if I buy IBM when its daily close price crosses above its 20 day ema and hold it until I make 100 dollars or a 10 percent trailing stop is hit? We abstract this natural language into four components, or phrases: 1) a starting or opening action (buy) for data selection; 2) a specification of the data (IBM daily close prices); 3) a qualification that, when satisfied, triggers the starting action (crosses its 20 day ema); and 4) conditions under which the data selection is stopped or closed (until I make 7
100 dollars or a 10 percent trailing stop is hit). To mimic this natural structure, all FinQL queries are made up of these four phrases—either explicitly or implicitly. Table 1 shows the abstracted structure or domain model. In Table 1, each phrase consists of at least one clause. The start/open phrase consists of the trade clause. The data specification phrase consists of clauses for the interval, symbol (or spread) definition, time box, and price. The qualification phrase causes selection of a subset of the input data that meets some constraint, such as a state direction or event clause. The stop/close phrase consists of one or more money management clauses, which define the conditions under which data selection is ended or the position is closed. Part of the challenge in attempting to develop a syntax for the individual clauses is that end users in different functional or geographic areas sometimes use different words to mean the same thing. Traders may look at the performance of pyramid strategies, while academics look at statistical regularities in rolling samples. Quantitative analysts might refer to expected earnings, whereas fundamental analysts might refer to consensus earnings. Rather than arbitrate between the various dialects, FinQL uses synonyms where possible to articulate the clauses (i.e. different keywords that have the same meaning to the parsing algorithm). Within the queries, we also note that FinQL is not case sensitive. EMA is the same as ema. Nor is FinQL space sensitive, though words must be separated by at least one space. 3.1
Input Data Sources FinQL queries require an explicit data specification phrase, which selects from at least
one or more price input data sources. These input data sources each consist of a series of price bars over consistent intervals. As shown in the data dictionary in Table 2, the bar data are rows in a flat file with fields for date/time, open, high, low, and closing prices, open interest (for
8
derivatives), expiration (for derivatives), and volume. The bars are generated from tick, or message, level data of the activity in the exchange limit order book. Creating bars is not trivial, because adjustments have to be made to the data. For example, because futures contracts expire periodically, in order to create a continuous time series of bars across expiries, past prices have to be adjusted for the periodic rolling of contracts. Because stocks pay dividends and are sometimes split, past prices must be adjusted for these events. This can lead to some odd scenarios. Subtracting dividends from historical prices, for example, can translate to negative adjusted prices in the past. Notwithstanding these issues, in theory, bars for any interval can be queried in FinQL—daily bars, 7 minute bars, 13 second bars, or whatever. However, for performance and other reasons, implementations of FinQL may precalculate bars for selected discrete intervals—say, just 1 minute, 5 minute, 30 minute bars. But, these issues are handled by the query processing algorithms, not the query language itself. FinQL queries can also use other input data sources, including for example economic releases input data sources (for economic events), commitment of traders input data sources (for futures and options), and fundamental releases input data sources (for stocks). The structures of these input data sources are dependent on the type and source of the data, but in general consist of dates and values for the various metrics. In later sections, we divide FinQL queries into simple queries and complex queries. Simple queries are those that use a single input data source. Complex queries are those that depend on multiple input data sources. 3.2
The Result Set All FinQL queries return a result set consisting of rows with fields for the position (or
selection) opening date or time, the opening price, a closing date or time, the closing price, the change in price, and the value of any indicators used in the query. An example data dictionary
9
for result sets is shown in Table 3. Pointers to the original data may also be included to enable extraction of additional information—intra-trade drawdown, high-water mark, or other metrics— if needed. Additional columns may be included in the result set that, for example, relate to the indicator or event used to open and close the positions, the values at horizons, objectives, trailing stops, and other data specific to the query. Specific implementations of FinQL may use this result set to calculate any number of descriptive statistics (e.g. average return, standard deviation of returns, range of changes, maximum drawdown, etc.) or Sharpe, information, or capability performance ratios, graph trades and equity curves, fit reference distributions, and/or develop qualitative descriptions, or stories, about the efficacy of the hypothesis or strategy embedded in the query. But, these bells and whistles are not part of the FinQL language itself. 3.3
Indicators End users sometimes rely on technical indicators to summarize historical market data.
These indicators are usually combined with traders’ own opinions in attempts to forecast prices. The assumption is that price patterns tend to appear again and again, because people tend to react similarly to similar situations (Caginalp and Balevonich, 2003). Technical indicators can be chart patterns, such as trendlines or head-and-shoulders tops, or statistical calculations that are functions of past prices and trading volumes. Chart patterns are usually interpreted visually and difficult to backtest without significant subjectivity. Different people can derive different forecasts using the same chart. Technical indicators in FinQL are restricted to the second type, sometimes called evidence-based technical analysis (see Aronson 2011), because their historical values can be calculated (either globally g or over windows w) and put to statistical tests. 3.4
States and Events
10
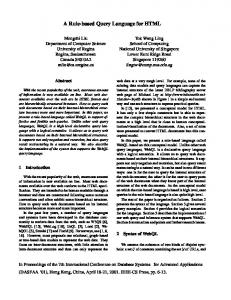
Traders often use states and events in prices relative to the values of indicators as triggers to open and close positions. FinQL queries build on these states and events in the qualification phrase. For example, a trader may be interested in understanding what happens when the close price is above its 200 day ema? Likewise, a trader may in interested in understanding what happens when the close price crosses its 200 day ema? Or, what happens after cpi (consumer price index) economic news is released? The correct answers to these question should be descriptions of the statistical tendencies over the historical data when the state existed or the after the event occurred. FinQL queries return result sets that make such description possible. Fig. 1 charts these types of states and events, where the solid line is the price of the S&P 500 E-mini futures contract (es) for part of 2011, and the dotted line is the 200 day ema of the price. The times where the price is in an above state or a below state relative to the ema are also shown. The heavy black dot where the price changes states is a crosses event. The hollow diamonds show where the monthly cpi (consumer price index) news, or a release, occurred. Just like a price, the value of an indicator can also be in an above or below state relative to some threshold value, the value of another indicator, or even the value of an indicator on its own value. For example, what happens when the 20 day ema is above the 50 day ema? Crosses events can also occur when the value of an indicator changes states. In later sections, we will use states and events of prices and indicator values to develop simple and complex queries. 4.
FinQL DICTIONARY The FinQL dictionary in Appendix A consists of the keywords that comprise the
language, along with their brief definitions. (For brevity, not all possible synonyms are included in the dictionary.) Compared to SQL, the number of keywords is fairly large because, again, there is common understanding of terms in the domain. Having more keywords results in shorter 11
queries (often a single line of code) relative to general purpose query languages. In addition to the FinQL dictionary in Appendix A, proprietary implementations of FinQL also use extensible libraries of keywords for, for example, indicators, economic releases, and fundamental news events. (This is similar to the use of standard libraries or third party libraries in general programming). Appendix B presents an example of such a library, which is representative of a specific FinQL implementation. 5.
STRUCTURE OF SIMPLE QUERIES The most basic queries in FinQL are for futures: es continuous
and for stock, ibm stock These unqualified queries simply return all the daily closing price data and changes from the price input data source for the S&P 500 E-mini futures contract and IBM, respectively. Relative to the domain model, several phrases, clauses, and parameters are left out. Implicitly, these take on their default values. For example, the default trade in these queries is buy. The default interval is daily time bars. In the first query, the continuous (or alternatively the by contract) identifier is required to identify the exchange symbol as a futures contract. However, there is an omitted expiry months sub-clause, which takes on the default value of all months, and an omitted contract sub-clause, which uses a default depth of 0, which means to always use the front-month contract. In the second query, the stock identifier indicates the exchange symbol is for an equity. The time box for both these queries defaults to from (optional) the starting date of the price input data source and to the end of it. The default price for both queries is close. The money management clause, which is left out in both, uses a 12
horizon of 1 bar (in this case, 1 day) by default. In the following sub-sections, these optional phrases, clauses, and parameters will be included to fully describe the structures of different types of FinQL queries. Unlike these basic queries, most FinQL queries are qualified in some way. In FinQL queries, the data specification phrase and the qualification phrase work together to define state or event scenarios under which data is selected. We add to these scenarios those queries that more explicitly backtest trading strategies. These are the three types of FinQL queries—state queries, event queries, and strategy queries. 5.1
Simple State Queries A simple state query retrieves data about the time series when its price is in a particular
state relative to an indicator(s). Relative to the state query in Fig. 2, we consider the research question: What happens to the price of the S&P 500 E-mini futures contract the day after it closes above its 20 day ema in 2012? Fig. 2 shows the complete query, including the optional clauses in gray. The input data source is daily price bars for the S&P 500 E-mini futures contract (es) beginning January 1, 2012 and ending December 31, 2012. The result set includes data from when the close price for the front month contract3 was above its 20 day ema until the horizon, which is 1 day. To generate the result set, simulated long (buy) round trip trades are evaluated using the close price. At the close of each day, if the state is true (i.e. if the close is above the 20 day ema), then a simulated long position is opened at the close price (say, of day 1). Even though the price used to evaluate the state could be something else (say, the high), the close price is still used to open positions. Because the horizon is 1 day, the position is closed the
3
S&P 500 E-mini futures expire quarterly HLOZ. Other futures expire monthly FGHJKLMNOXYZ. All months are shown for demonstration. Whatever the case, the default is to use all contracts.
13
following day (i.e. day 2) at the close price. The position opening price and closing price are used to calculate the change in price. Also, there is an implied size to each trade. Because there is only a single exit condition (i.e. horizon 1 day), the size or quantity of each trade is one contract or share. If we use the defaults and the entire data set, the query in Fig. 2 can be considerably shortened to: es continuous above ema 20 Table 4 shows a sample of the result set returned from the state query in Fig. 2 executed against a database that begins January 1, 2000. To demonstrate what can be done with (a sample from) the result set, Figs. 3, 4, and 5 show some of the bells and whistles from a hypothetical FinQL implementation, including a residuals plot of the change field in Table 4, an equity curve of a $1000 investment in the strategy, and a histogram of the change column, which can serve as a reference distribution. 5.2
Simple Event Queries A simple event query retrieves data about the time series of prices after something
happens. These events could be indicator events, like when a price changes from one state to another relative to an indicator (called a crosses event), or it could be the arrival of new economic data (called a news, or release, event). Crosses event queries are simple queries because the result set depends upon only one price input data source. News, or release, events are complex queries because the result set depends upon more than one input data source. In this section, we examine simple crosses event queries. Crosses occur when the price or indicator value changes either from a below state to an above state (i.e. crosses above) or from an above state to a below state (i.e. crosses below).
14
Fig. 6 shows the structure of a basic crosses event query. It uses daily es close prices as in the previous state query example. The event occurs when the close price crosses above its 20 day ema. Because this event query uses many of the defaults mentioned previously, it can be shortened considerably. es continuous crosses above ema 20 It is also possible to look at an event query based upon two indicators. What happens when the 20 day ema crosses the 50 day ema? es continuous ema 50 crosses above ema 200 5.3 Simple Strategy Queries Simple strategy queries are just state queries or event queries that more explicitly backtest trading strategies—using both long and short simulated positions. For example, a strategy query examines what happens to a strategy that buys when a crosses above occurs and sells when a crosses below occurs. To enable this equal-but-reverse logic, FinQL uses the inverse keyword. Fig. 7 shows the structure of a simple strategy query. In the strategy query in Fig. 7, a long position is opened on the occurrence of a crosses above ema 20 event, and (even though it is not explicitly stated) a short position is opened on the occurrence of a crosses below ema 20 event, because of the buy and inverse sell trade clause. This is fairly straightforward for a moving average, but the inverse logic depends upon the indicator. If the query uses rsi 14 crosses above 80 to open long positions, then the inverse condition to open the short position
15
will occur at rsi 14 crosses below 20. As before, because the event query in Fig. 7 uses many of the defaults mentioned previously, it can also be shortened. buy and inverse sell es continuous crosses above ema 20 5.4
Closing Positions The exit conditions embedded in the money management clause determine when
positions are closed. So, far the exit conditions have all been an interval horizon. But, there are others. For example, the exit condition can also be based upon an indicator event. es continuous above ema 20 until crosses above ema 50 The exit condition can also be an objective (obj or target) in percent, dollar, tick, or point units (e.g. until obj 100 dollars). We can also employ a hard stop (e.g. until stop 10 ticks) or a trailing stop (e.g. until trailing stop 5 percent). 5.4.1 Multiple Exit Parameters As discussed, the state query in Fig. 2 uses a position size of 1, which is implied by the number of parameters in the money management clause. If there were multiple parameters, however, say until horizon 1 5 10 days, then the quantity of the opening trade would be three, where the first contract or share is closed after 1 day, the second after 5 days, and the third after 10 days. 5.4.2 Multiple Exit Conditions
16
It is also possible to specify multiple exit conditions in the money management clause. For example, this query specifies three exit conditions, one for a trailing stop, one for a dollar objective, and one for a time horizon. es continuous crosses above ema 20 until trailing stop 10 20 30 points obj 200 400 dollars horizon 20 days In this example, the position is opened with a quantity that is equal to the maximum number of exit condition parameters, which is in this case three for the trailing stop. In this scenario, if the first position is closed because the trailing stop 10 is hit, then the objective 200 is cancelled. This logic is known as one-cancels-the-other (OCO). The first position will be managed with OCO with trailing stop 10 and objective 200. The second position will be managed with OCO with trailing stop 20 and objective 400. The third position will be managed just with trailing stop 30. All positions that remain open will be closed at the horizon. When a stop and/or an obj are specified, positions may be closed intra-interval if the price touches the stop or obj. If both conditions are met in the same bar and it is impossible to ascertain which occurred first, then the implementation could pull intra-interval data to determine the order of these events. 5.4.3 Pyramid Suppose we ask: What happens to the price the five days after it closes above its 200 day ema? It is fairly clear in this question how trades are meant to be opened. If the state is true, then a position should be opened at the closing price of that day. However, what should happen if the entry condition remains true, or re-occurs, while the first position is open is not clear. Fig. 17
8 illustrates three scenarios—A, B, and C—showing trades and their durations as arrows. In Fig. 8 as in Fig. 1, the close price of the es is the solid line and the 200 day ema is the dotted line. As can be seen, the state close above ema 200 is true on days 1 through 9. If we assume that day 1 is the first day where this state is true, then in all three scenarios—A, B, and C—a position is opened at the close price of that day, 1205.50, and will be held until a horizon of 5 days, unless the state is still true at the close price of day 2 (and in Fig. 8 it is still true). In this case, then one of the three scenarios will occur. Scenario A:
If the state is still true at the close price of day 2, then the position opened at the close of day 1 will be closed at the close price of day 2, 1226.75, and a new position will be opened at that same price. This will occur for each day until the condition is false, in which case the last position will be held for 5 days, or until the state becomes true again. This is the default behavior using the query: buy es continuous above ema 200 until horizon 5 days
Scenario B:
If the state is still true at the close price of day 2, then a new position will be opened at the close price of day 2, 1226.75, so that the total position is now long two contracts. Because the state is still true at the close prices of days 3 through 9, a new position will be opened at these prices each day. Of course, the original day 1 position will be closed at the day 6 close price, the day 2 position will be closed at the day 7 close price 1181.00, and so on, until the last position opened on day 9 at 1164.00 will be closed at the close price of 995.50 on day 14. This
18
technique for building positions is called a pyramid strategy. In the statistical sense, this is an overlapping rolling sample. buy pyramid es continuous above ema 20 until horizon 5 days In this case, the maximum position size defaults to 5, as implied by the money management clause which restricts the duration of the trade. Alternatively, we could explicitly specify a maximum position size, say buy pyramid 3, which adds some flexibility as in Scenario C. Scenario C:
This scenario is commonly queried, and is simply a special case of scenario B where the maximum position size is 1. If the state is still true at the close price of day 2, then because a position (opened at the close of day 1) already exists, a new position will not be opened until the original position is closed at the horizon of 5 days, which occurs at the close price of day 6, 1183.25. This is a nonoverlapping rolling sample. buy pyramid 1 es continuous above ema 20 until horizon 5 days
6.
STRUCTURE OF COMPLEX QUERIES Complex queries are those queries that join data from more than one input data source
using the and keyword. In the data specification phrase of all queries, a price input data source must be specified. In subsequent phrases, however, additional input data sources may be specified. If they are missing, however, then FinQL uses the most recently specified input data
19
source. So, this example is not a complex query since the rsig 10 indicator clause uses es continuous as the price input data source4. es continuous above ema 20 and rsig 14 between 5 and 10 6.1
Complex State Queries The following state query is a complex query because it pulls from both the es and us
(i.e. U.S. 30 Year Treasury Bond futures) price input data sources in order to generate the result set. What happens to the es the next day if the 1 day roc (rate of change) for the us is above 3%? es continuous and us continuous roc 1 above 3 In this example, the first price input data source is es, and the second, joining input data source is us. In all cases, the trades occur and the result set is generated from the first input data source and can be conditional upon states or events in the second input data source. The result set consists of those es positions that are opened when the state us above ema 20 is true. We can append more indicators as in this example. What happens to es the next day if it is above its 20 day ma and the 14 day rsi for us is above 10 and the 1 day roc (rate of change) for gc (gold futures) is above 2%?
4
The evaluation rsig 14 between 5 and 10 is true if the current value of the rsi over the whole history (i.e. global g) up to that day is between the 5th and 10th percentile. Alternatively, rsiw 100 14 between 5 and 10 would be true if the current value of the rsi over the last 100 day window (w) was between the 5th and 10th percentile. The specifiers g or w can be added to any indicator. If the indicator is not an oscillator (e.g. ema), then it is first converted to an oscillator (e.g. by calculating ema – close), then looking at the percentile of the difference.
20
es continuous above ema 20 and us continuous rsi 14 above 10 and gc continuous roc 1 above 2 Now, the notation rsi 14 is equivalent in FinQL to rsi( 14 ). An alternative syntax is to add the instrument as the first parameter. So, we can use the more compact, but equivalent notation: es continuous above ema 20 and rsi( us, 14 ) above 10 and roc( gc, 1 ) above 2 This adds some flexibility. What happens to gc (gold) when the rsi 14 of es is above the rsi 14 of nq? gc continuous rsi( es, 14 ) above rsi( nq, 14 ) 6.2
Complex Event Queries Trading strategies that use news events, or release events, as triggers to open positions
are common. Table B2 contains an example list of news release keywords. News event queries are complex queries because they pull data from a price input data source and a news input data source, say cpi, in order to generate the result set. What happens to es on days when cpi release comes out above expected value by .3? es continuous and cpi release above expected by 0.3
21
Economic news data can also be a time series. So, we can analyze it relative to indicators, too. What happens to the es if the cpi release is above its 10 value ema? es continuous and cpi release above ema 10 For stocks, fundamental news, or release, events are also of interest. For example, what happens to the price of ibm the day after an eps (earning per share) release? ibm stock and eps news Futures exchanges release commitment of traders reports each Friday. These reports contain various information about futures and/or options contracts. To differentiate between these reports, FinQL queries use a string formatted as shown in Table 5. Relative to the letters and their definitions in Table 5, queries can include more than one letter for a given field. So, CM adds together commercials and money managers. What happens if hedgers and money managers increase their long positions in cl (crude oil) futures? cl continuous and fpcml release roc 1 above 0 6.3
Complex Strategy Queries This complex strategy query backtests a fairly in depth trading strategy. What happens if
I buy (sell) es after bonds rally (drop) over 5 points in the previous 5 minutes (i.e. 5 one minute bar) and hold until I hit my targets, get hit on a trailing stop, or after 10 minutes? buy and inverse sell 1 minute es continuous 22
and us continuous rallies by 5 points in 5 bars until target 3 5 10 ticks trailing stop 2 3 4 ticks horizon 10 bars The rallies keyword is a synonym for increasing or expanding. Alternatively, the drop keyword is a synonym for decreasing or contracting. These keywords can also be used on indicators. What happens when the value of the 20 day ATR (average true range) drops by 10 ticks over 5 days? es continuous atr 20 drops by 10 ticks in 5 days 7.
RANGES FinQL facilitates research cycling through ranges, which speed the search for optimal
combinations of indicators and parameter values. An individual FinQL query statement, given a vector (or range) of parameter values for an indicator, will execute multiple queries and return a vector of result sets. A vector of parameter values for one indicator combined with a vector of parameter values for a second indicator will return a two-dimensional grid of result sets using the various combinations of parameter values. In a FinQL query, a vector can replace a single parameter value. The vector syntax uses starting to finishing values with an optional step value (i.e. start:step:finish, where the default step is +1). What happens the day after the es crosses above its 20, 40, 60, 80, and 100 day emas? es continuous crosses above ema 20:20:100 23
As depicted in Fig. 9, this single FinQL query will run five queries and return five result sets, one each for the five ema parameter values. What happens the day after the rsi 14 on es is below 15, 20, 25, 30, and 35 day and the close price is below its 5, 10, 15, 20, and 25 day ema? es continuous rsi 14 below 15:5:35 and close below ema 5:5:25 This query returns a 5×5 grid containing 25 result sets as depicted in Fig. 10. Alternatively, we can used linked ranges to restrict the results sets to only the entrywise combinations of vector values using a link variable at the end of the range. What happened to the es over the sliding two year windows from 2000 to 2010? es continuous year from 2000:2010:y to 2002:2012:y In this query, the link variable y ties the incrementation between the parameters together, so that it returns a vector of eleven result sets [2000 to 2002, 2001 to 2003, … , 2010 to 2012]. Related ranges are also useful for cases where you want to test a grid of two variables, but where the second variable must be bigger than the first one. What happens to the es when the short term ema crosses above the long term ema? es continuous ema 2:2:10:x crosses above ema 2:2:10:x+ This query will return only the upper triangle of a 5 × 5 grid as in Fig. 11. 8.
CROSS-SECTIONAL ANALYSIS
24
Similar to ranges, we can also query cross-sectionally (i.e. across instruments) or even across indicators (as long as the parameter agrees with all indicators). So, for example, we may want to look at the same state or event for many futures contracts. es,nq,cl,us,tf continuous above ema,ma,kama 20 This query returns a 5 × 3 grid of result sets. In similar fashion, users can pre-define a basket of instruments to quickly retrieve cross-sectional information. The basket could be the components of an index. In this example, spx represents the 500 stocks in the S&P index (and not the futures contract it). spx basket above ema 20 This query returns a vector of 500 result sets. 8.1
Conditional Data Specification In all the previous examples the specification of the price input data set was fixed in the
query. However, the selection of the instrument(s) can be conditional on states or events. For example, assume the user has predefined a basket of 100 stocks called mystocks. What happens if I buy the top 10 stocks by roc (rate of change) over the past 30 days and sell the bottom 10 and hold them for one month? buy and inverse sell top 10 by roc 30 mystocks basket until horizon 1 month We can also look at deciles (in this example by roc (rate of change) over the past 10 days) using top 10 percent and a link variable. This enables tests similar to those described in O'Shaughnessy (2011).
25
buy top 0:10:90:x to 10:10:100:x percent by roc 10 mystocks basket until horizon 1 month 8.2
Spread Queries FinQL queries can also return information about spreads. In this example, a simple
FinQL state query uses a cl (crude oil) calendar spread. The contracts that comprise the calendar spread will, or course, evolve over time, yet we need only to specify the months at the outset of the evaluation as strings containing the symbol, the month, and the year (e.g. clh12 is crude oil, March, 2012). The continuous identifier rolls the data forward to evolve the front and back month contracts and, therefore the spread price, automatically. clh12 - clj12 continuous Should only the spread for a specific expiry be required, this query could amended with month H. More complicated spreads can also be defined. The formula for a one year ed (eurodollar) butterfly would include the spread ratio. edz15 – 2 * edz16 + edz17 continuous Complex FinQL queries also enable examination of intermarket spreads and pairs. The following state query pulls data from both es and nq as part of a statistical arbitrage strategy that uses the normalized z-score (i.e. z = ( x – μ ) / σ) of a ratio spread price (for demonstration we use the trivial ratio of -1 es plus 2 nq ) in order to generate trades. What happens if I sell (buy) the spread if its close z-score crosses above (below) 2 (-2) and hold it till the z-score reverts to 0 with a trailing stop of 50 dollars? sell and inverse buy -es + 2 * nq continuous ( close - ma( 30 ) ) / std( 30 ) as z crosses above 2 until z below 0 26
trailing stop 50 dollars Notice in this query the use of as to alias the algebraic expression as z, which is used later in the query. Conditional data specification is also useful when spreading across the term structure of commodities. For example, the following statement will sell the most expensive spread (i.e. by price) and buy the cheapest one (i.e. a dynamic box trade) and hold the position for one week. sell and inverse buy top 1 by price clf15 - clg15 by contract depth 0 to 11 until horizon 1 week 9.
QUERY EXAMPLES In this section, we present several example FinQL queries that demonstrate the use of
additional keywords. For example, we could assess the historical price behavior by looking at a range of prices after the event. es continuous crosses above ema 50 from 2 to 5 points Alternatively, we could augment the value of the indicator, say, by 10 ticks (or percent or points) over the ema. 9.1
Seasonality Seasonality (or repeated patterns) in financial time series data is often investigated. For
example, we may only be interested in activity in certain years. es continuous year 2010 to 2010 The January effect is well-known, and we can examine performance in the individual months: month from 1:12:x to 1:12:x. We may be interested in Tuesday reversals, and we can look at the days of the week: dayofweek 1:5:x to 1:5:x. We can look at the first five calendar days of the 27
month: dayofmonth 1:5:x to 1:5:x; or the first week of the year: dayofyear from 0101 to 0107. We can also look at intra-day periods. For example, what happens to the es in the first half hour of trading GMT (Greenwich mean time)? 5 minute es continuous timeofday 143000 to 1500000 gmt This example uses d2r (i.e. days to roll) to look at activity of futures contracts on specific days relative to the roll date. es continuous d2r from 1:5:24:x to 5:5:29:x 9.2
Self The self keyword specifies that an indicator applies to the value of an indicator and not
the price of the instrument. What happens to the es when the rsi 14 crosses its own ema 5? es continuous rsi 14 crosses above self ema 5 Without self, the ema 5 in this query would refer to es close. With self, however, ema 5 refers to the indicator of the indicator (i.e. ema 5 of the rsi 14). 9.3
Watch As discussed, by default all opening and closing transactions occur after the interval in
which the condition is satisfied at the close price. If we want to measure simultaneous relationships, then we want to see how the price changed on days when the condition turned out to be true. Opening trades can occur at the open price of the current interval, where the condition is true at the close by adding the watch qualifier.
28
watch es continuous above ema 20 Another use of watch is to investigate dependence relationships between markets. What happens to es on days when us bonds have a positive roc? watch es continuous roc( us, 1 ) above 0 This query will show the cumulative return of es only on those days where U.S. bonds have positive returns. 9.4
Similarity Tests Using Like and Similar The like and similar keywords perform similarity tests from an extensible list of
algorithms. For example, a version of Sakoe and Chiba’s (1978) dynamic time warping (dtw) algorithm can align two time series of prices. By manipulating the time axis, dtw measures the similarity between the two series independent of time. Series that are sufficiently similar are used to generate the result set. What happens to the es after the 50 most similar 3 day periods to the first three days of the February? es continuous similar 50 dtw like 20150201 to 20150203 The similar clause is optional and takes on a default parameter value of 20. What happened to the es the next day following any of the 20 days most similar to yesterday where it also crossed above the ema 35? es continuous like yesterday and crosses 29
above ema 35 10.
CHANGING INTERVALS Over the course of this paper, we have assumed that the interval clause specifies a time
interval, such as daily or 5 minute bars. However, analyses of other types of series data, using other intervals to calculate open-high-low-close bars, is also common in the financial industry. For example, high frequency traders might look at the 10 trade ema instead of the 10 minute ema. Or, as another example, VWAP execution traders might use volume series data to look at the ema of the price over that last 1000 shares or contracts traded. These are fixed activity series intervals (instead of fixed time series intervals). This example uses a fixed number of trades. 10 trades es continuous above ema 20 We could also look at fixed range series intervals in terms of dollars or ticks. Without changing the syntax of the other phrases in any way, FinQL queries can execute against price input data sources of bars built on these intervals as well. 11.
CONCLUSION Query languages are meant for end users who are not necessarily professional
programmers. In this paper, we presented the design of FinQL. FinQL is built on a domain model that formalizes the jargon used in finance. It empowers end users through a compact query structure that focusses on business rules, and delivers standardized results that quickly provide information about past price behavior. We presented a dictionary of FinQL keywords and the structures of simple and complex queries. We also showed how FinQL facilitates cycling using ranges and cross-sectional analysis using baskets of instruments and conditional 30
data specification. While the paper presents examples consistently as time series queries for pedagogical reasons, FinQL can evaluate queries over activity series and range series. We note that analysis of time series data is important in many domains, including genomics, geophysics, and climatology. With little or no modification, appropriate FinQL queries can be executed against data from any of these domains. Of course, clauses such as buy and inverse sell have no meaning in these other domains, so in this respect FinQL is a superset of the syntax necessary for more general application.
31
Acknowledgements The authors would like to thank Drs. Ricky Cooper and Philip Maymin for their valuable contributions to the development of FinQL, especially in the area of cross-sectional analysis.
32
References Ahadi, A, J Prior, V Behbood, & R Lister 2015, ‘A Quantitative Study of the Relative Difficulty for Novices of Writing Seven Different Types of SQL Queries.’ In Proceedings of the 2015 ACM Conference on Innovation and Technology in Computer Science Education, pp. 201-206.
Arasu, A, S Babu, & J Widom 2006, ‘The CQL continuous query language: semantic foundations and query execution.’ The VLDB Journal—The International Journal on Very Large Data Bases, Vol. 15, pp. 121-142.
Aronson, D 2011, Evidence-based technical analysis: applying the scientific method and statistical inference to trading signals. John Wiley & Sons.
Barišić, A, P Monteiro, V Amaral, M Goulão, & M Monteiro 2012, ‘Patterns for evaluating usability of domain-specific languages.’ Available on ResearchGate.com.
Broekstra, J, & A Kampman 2003. ‘SeRQL: a second generation RDF query language.’ In Proceedings of SWAD-Europe Workshop on Semantic Web Storage and Retrieval, pp. 13-14.
Brooks Jr, FP 1995, The mythical man-month (anniversary ed.). Addison-Wesley
Buneman, P, & RE Frankel 1979. ‘FQL: a functional query language.’ In Proceedings of the 1979 ACM SIGMOD international conference on Management of data, pp. 52-58.
33
Caginalp, G & D Balevonich 2003, ‘A theoretical foundation for technical analysis.’ Journal of Technical Analysis, Vol. 59, pp. 5-22.
Chan, HC, HH Teo, & XH Zeng 2005, ‘An evaluation of novice end‐user computing performance: Data modeling, query writing, and comprehension.’ Journal of the American Society for Information Science and Technology. Vol. 56, pp. 843-853.
Chandra, R & A Segev 1993, ‘Managing temporal financial data in an extensible database.’ In Proceedings of the 19th VLDB Conference, pp. 302-313.
Cooper, R, M Ong, & B Van Vliet 2014, ‘Multi-scale capability: A better approach to performance measurement for algorithmic trading.’ Algorithmic Finance, Vol. 4, pp. 53-68.
Evans, E 2004, Domain-driven design: tackling complexity in the heart of software. AddisonWesley Professional.
Gould, JD & RN Ascher 1975, ‘Use of an IQF-like query language by nonprogrammers.’ IBM Res. Rep. RC 5279, IBM Thomas J. Watson Research Center, Yorktown Heights, NY.
Grinold, R 1989, ‘The fundamental law of active management.’ Journal of Portfolio Management. Vol. 15, pp. 30–37.
34
Haigh, KZ, W Foslien, & V Guralnik 2004, ‘Visual Query Language: Finding patterns in and relationships among time series data.’ In Proceedings of the 7th Workshop on Mining Scientific and Engineering Datasets.
Han, J, Y Fu, W Wang, K Koperski, & O Zaiane 1996, ‘DMQL: A data mining query language for relational databases.’ In Proceedings of 1996 SiGMOD, Vol. 96, pp. 27-34.
Hochheiser, H, & B Shneiderman, B 2004. ‘Dynamic query tools for time series data sets: timebox widgets for interactive exploration.’ Information Visualization, Vol. 3, pp. 1-18.
Huang, YW & PS Yu 1999, ‘Adaptive query processing for time-series data.’ In Proceedings of the 5th ACM SIGKDD international conference on knowledge discovery and data mining, pp. 282-286.
Jacob, KJ & D Shasha 1999, ‘FinTime - A Financial Time Series Benchmark.’ SIGMOD Record, Vol. 28, pp. 42-48.
Johnston, WM, JR Hanna, & RJ Millar 2004, ‘Advances in dataflow programming languages.’ ACM Computing Surveys (CSUR), Vol. 36, pp. 1-34.
Kersten, M, Y Zhang, M Ivanova, & N Nes 2011, ‘SciQL, a query language for science applications.’ In Proceedings of the EDBT/ICDT 2011 Workshop on Array Databases, pp. 1-12.
35
Kumiega, A, T Neururer & B Van Vliet 2014, ‘Trading system capability.’ Quantitative Finance, Vol. 14, pp. 383-392.
Lerner, A & D Shasha 2003, ‘Aquery: Query language for ordered data, optimization techniques, and experiments.’ In Proceedings of the 29th International Conference on Very Large Data Bases. Vol. 29, pp. 345-356.
Lerner, A, D Shasha, Z Wang, X Zhao & Y Zhu 2004, ‘Fast algorithms for time series with applications to finance, physics, music, biology, and other suspects.’ In Proceedings of the 2004 ACM SIGMOD International Conference on Management of Data, pp. 965-968.
Mork, P, R Shaker, A Halevy, & P Tarczy-Hornoch 2002, ‘PQL: A declarative query language over dynamic biological schemata.’ In Proceedings of the AMIA Symposium. American Medical Informatics Association, p. 533.
O'Shaughnessey, J 2011, What Works on Wall Street, 4th ed. McGraw-Hill Companies.
Ramakrishnan, R, D Donjerkovic, A Ranganathan, A., KS Beyer & M Krishnaprasad 1998, ‘Srql: Sorted relational query language.’ In Proceedings of International Conference on Scientific and Statistical Database Management. p. 84.
Reisner, P 1981, ‘Human factors studies of database query languages: A survey and assessment.’ ACM Computing Surveys (CSUR), Vol. 13, pp. 13-31.
36
Sakoe, H & S Chiba 1978, ‘Dynamic programming algorithm optimization for spoken word recognition’. IEEE Transactions on Acoustics, Speech and Signal Processing. Vol. 26, pp. 43– 49.
Sharpe, WF 1994, ‘The sharpe ratio.’ Journal of Portfolio Management, Vol. 21, pp. 49-58.
Shasha, D 1999, ‘Tuning time series queries in finance: Case studies and recommendations.’ IEEE Data Engineering Bulletin, Vol. 22, pp. 40-46.
Shneiderman, B 1978, ‘Improving the human factors aspect of data base interactions,’ ACM Transactions on Database Systems. Vol. 3, pp. 417-439.
Snodgrass, RT, S Gomez, & LE McKenzie Jr, 1993. ‘Aggregates in the temporal query language TQuel.’ IEEE Transactions on Knowledge and Data Engineering. Vol. 5, pp. 826-842.
Thomas, JC & JD Gould 1975, ‘A psychological study of query by example,’ in Proceedings of the National Computer Conference, pp. 439-445.
Thomas, JC 1983, ’Psychological issues in the design of database query languages.’ Designing for human-computer communication, pp. 173-206.
37
Topi, H, JS Valacich, & JA Hoffer 2005, ‘The effects of task complexity and time availability limitations on human performance in database query tasks.’ International Journal of HumanComputer Studies, Vol. 62, pp. 349-379.
Whitley, KN 1997, ‘Visual programming languages and the empirical evidence for and against.’ Journal of Visual Languages & Computing, Vol. 8, pp. 109-142.
Whitney, A & D Shasha 2001, ‘Lots o'Ticks: real time high performance time series queries on billions of trades and quotes.’ ACM SIGMOD Record, Vol. 30, p. 617.
Yang, Q & X Wu 2006 ‘10 challenging problems in data mining research.’ International Journal of Information Technology & Decision Making, Vol. 5, pp. 597-604.
Zhang, Y, M Kersten, M Ivanova, & N Nes 2011, ‘SciQL: bridging the gap between science and relational DBMS.’ In Proceedings of the 15th Symposium on International Database Engineering & Applications, pp. 124-133.
38
Appendix A Trade Clause buy pyramid rolling sell inverse
Buy order to open position Position builder specifier Same as pyramid Sell order to close Opposite of position entry logic (definition is indicator dependent)
Interval: Time daily minute(s)
Fixed daily time interval Fixed minute-based time interval (e.g. 5 minute)
Interval: Activity contract(s) share(s) trade(s)
Fixed number of contracts traded (per bar) interval Fixed number of shares traded (per bar) interval Fixed number of executions (per bar) interval
Interval: Range dollar(s) point(s) tick(s)
Fixed dollar range (per bar) interval Fixed point range (per bar) interval Fixed tick range (per bar) interval
Symbol Identifiers stock by contract continuous basket
Stock identifier, using split and dividend back-adjusted prices. Futures identifier, using prices by contract. Futures identifier, using continuous back-adjusted prices. User-defined basket (of stocks or futures) identifier
Futures Qualifiers Contract depth (Futures only, default: 0 equals front month) depth Days to roll (Futures only) d2r Month codes for futures are: January F, February G, March H, April J, May K, June M, July N, August Q, September U, October V, November X, December Z
Events crosses news release
Value changes states relative to the value of an indicator News release event (See example list of news events in Appendix B) Same as news
States / Directions above below contracting decreasing drop(s) expanding increasing rally(ies) bottom top
The value is above that of some threshold or an indicator The value is below that of some threshold or an indicator Same as decreasing The value is going down some amount over some interval Same as decreasing Same as increasing The value is going up some amount over some interval Same as increasing Used to rank symbols based on some condition Used to rank symbols based on some condition
Units dollar(s) percent point(s) tick(s)
Dollars Percentage points Price points Number of ticks
Prices 39
open high low close
Opening price of the bar High price of the bar Low price of the bar Closing price of the bar
Times bar(s) day(s) yesterday year(s) month(s) week(s) dayofweek dayofmonth dayofyear timeofday
Number of intervals Calendar days Previous day Year (YYYY) Calendar month (MM) Calendar week Monday 1, Tuesday 2, Wednesday 3, Thursday 4, and Friday 5. Calendar days (MMDD) Calendar days (YYYYMMDD) Time using gmt (Greenwich mean time) (HHMMSS)
Money Management until horizon obj stop target trailing
Introduces an explicit position exit clause Specifies a time for when to exit the position Specifies a unit goal for when to exit the position Specifies a stop loss for when to exit the position Same as obj Indicates the stop is a trailing stop
Prepositions Between from in to with
Specifies a range of values for comparison Optional introduction to timebox clause Used in various clauses. Used to specify end date of timebox Used in various clauses.
Other and as like # self similar
Joins data in a complex query Used for creating an alias. Use similarity test (For example: dtw for dynamic time warping, or euc for Euclidean distance. Other dimension reduction algorithms could be defined) Comment specifier Specifies use of the indicator of the indicator Number of historical instances to return (used with like)
Math
Description
+, − *, / >,=,