was protected with sprayed-on fireproofing material composed primarily of ... The characteristics of the concrete and the fire-proofing material are not given in the ...
VALIDATION OF THE FREEWARE ‘FIRE DYNAMICS SIMULATOR VERSION 2.0’ FOR SIMULATING TUNNEL FIRES
Steve Cochard Project Manager, Electrowatt Infra Ltd, Zurich, Switzerland
1
SYNOPSIS
Many regulatory authorities are now requiring that the emergency ventilation system in a road tunnel be validated using computational fluid dynamics (CFD). Several such codes are commercially available to many engineers who are responsible for designing tunnel ventilation systems but their costs are often prohibitive - € 20’000 for a one-year lease for a single computer is typical. On the other hand free and low-cost CFD codes are available but are these suitable for predicting tunnel fires? This paper reports the results of a study aimed at validating the results given by the freeware ‘Fire Dynamics Simulator version 2.0’ (FDS2) developed by the National Institute of Standards and Technology (NIST)1. The validation of the software has been carried out using the Memorial Tunnel Fire Ventilation Test Program (MTFVTP) Test Case 321 A - a 40 MW fire with a single point supply in the ceiling as the ventilation system. The paper demonstrates that the FDS2 code predicts well the measured data, is suitable for predicting fires in road tunnels and can, just like other state-of-the-art codes, provide valuable information. 2
ONE-DIMENSIONAL CODES
Electrowatt Infra has over 35 years experience in the design and engineering of ventilation and fire life safety systems. During recent years many one-dimensional (1D) codes have been developed and improved by our team to predict the propagation of smoke in underground systems in the case of fire, e.g. [2]. Those tools are well suited during the initial design phases of a project to find the best ventilation concept as they have the following advantages: • Complex systems can be simply modelled and easily modified, • Parametric studies can be undertaken to find the best solution, • Robustness and flexibility, and • Short calculation times. The main disadvantages of 1D codes are: • Low precision with low air velocities, • Uniform concentration of value by sector, • 3D phenomena cannot be predicted, and • Smoke stratification and backlayering cannot be predicted.
1
Technology Administration, U.S. Department of Commerce
3
FIRE DYNAMICS SIMULATOR VERSION 2
The software ‘Fire Dynamics Simulator version 2.0’ (FDS2) has been developed by Kevin McGrattan et al. at the National Institute of Standards and Technology (NIST), Maryland, USA. FDS2 solves the ‘low Mach number’ form of the Navier-Stokes equations, developed by Rehm and Baum [12], for a multiple species fluid. These simplified equations involve the filtering out of acoustic waves while allowing for large variations in temperature and density but not pressure. The equations are discretised in space using second order central differences and in time using an explicit, second order, predictorcorrector scheme [3] [5]. In FDS2 the combustion is simulated by a Mixture Fraction Model [4]. The Mixture Fraction is a conserved quantity representing the fraction of material at a given point that originated as fuel. In such a model fuel and oxygen cannot co-exist. The two dimensional surface, embedded in a three dimensional space, where both fuel and oxygen disappear as product define the ‘flame sheet’. The local heat release rate is computed from the local oxygen consumption rate at the flame surface. For a Large Eddy Simulation (LES) [9], where the grid resolution is not fine enough to capture the mixing processes at all relevant scales, a sub-grid scale model for the viscosity is applied. In FDS2 viscosity is modelled following the analysis of Smagorinsky [13]. The thermal radiation is solved using a Finite Volume Method. The solver has two main modes of operation – a grey gas model (default) and a wide band model [5]. Both allow gas to gas, wall to wall and gas to wall interactions. Only the grey gas model has been used due to the predominance of soot produced by typical tunnel fires. Four types of thermal boundary conditions are available in FDS2 [6]: • the boundary has an imposed temperature (which may vary with time), • the boundary is a thermally-thin solid, in which case all the solid is at the same temperature, • the boundary is a thermally-thick solid, in which case a one-dimensional heat conduction is applied. or • the boundary can burn if its temperature reaches a certain value. 4
SIMULATION
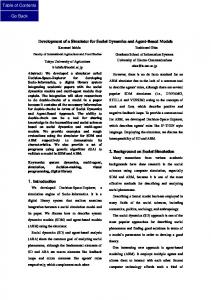
For the validation of FDS2, the Test Case 321A of the well known MTFVTP [11] has been chosen. It was part of a series of tests to estimate the air velocity required to control smoke backlayering. This test consisted of a single point supply of fresh air through a 28 m² opening in the ceiling located 135 m north of the fire centreline (Figure 1). The ventilation was started 2 minutes after the ignition of the fire and fresh air flow rates reached 84 m³/s 80 seconds later (Figure 2). The north portal of the tunnel was completely closed to force all the air supplied by the fan past the fire site. The fire-zone was protected with sprayed-on fireproofing material composed primarily of cement and vermiculite.
236 m 135 m
66 m
North
South
11 m 26 m 29 m
G F
E
D C B A
Lo op 2 02
Lo op 3 01
Lo op 3 02
Lo op 3 03
Lo op 3 04
Lo op 2 05
Lo op 3 05
Lo op 3 06
80 m3/s
Lo op 3 07
12 m
107 m
29 m 238 m
238 m
Figure 1: Position of the loops in the Memorial Tunnel
Fifteen measurement trees were installed in the tunnel to record temperature, air velocity, carbon monoxide and carbon dioxide concentration. Each measurement tree formed a loop. The temperature
probes were placed at 30 cm (A), 107 cm (B), 183 cm (C), 244 cm (D), 305 cm (E), 351 cm (F) and 396 cm (G) above the road surface on each measurement tree (Figure 1). The heat release rate of the fire is shown in Figure 2 indicating that, during the first 5 minutes of the test, the maximum heat release rate was 40 MW. Ten measurement trees have been modelled to compare the temperature measured on the tunnel centre-line with the results from the simulation. The five remaining measurement trees have not been simulated as the temperatures recorded were no higher than 28°C. The characteristics of the concrete and the fire-proofing material are not given in the MTFVTP test report so they have been modelled using mean values found in the literature [8]. The length of the calculation domain is shorter than the length of the tunnel. Tests indicated that modelling more than 100 metres north of the point supply was not necessary and only increased the calculation time. In order to halve the calculation time and the memory needed the tunnel is considered to be symmetric about the vertical centre-line. To reduce the total number of cells those at the end of the domain, far from the fire, are stretched. The smallest cells, of dimension 20 x 20 x 20 cm, are located around the fuel pan to capture the flame sheet. The domain is filled with 480’000 cells. The calculations were carried out on a 1.5 GHz Pentium 4 with 512 MB of RAM and required approx. 40 hours to simulate the first 5 minutes of the test. 5
RESULTS
Before the ventilation system was started, the hot gases flowed north driven by the buoyancy force associated with the tunnel gradient of 3.2%. Once the ventilation was started the air flow was forced towards the south portal. The overall phenomenon has been well simulated. As an example; probe F on Loop 306 (Figure 4), 29 m north of the fire, measured a temperature of 440°C 120 sec after the beginning of the fire, which was double that recorded by probe F on Loop 303 (Figure 9) located 26 m south of the fire, at the same time. Five minutes after the start of the fire that situation was reversed; probe F on Loop 303 (south) measured a temperature of 640°C while the probe F on Loop 306 (north) recorded a temperature of 105°C. The comparison between the measured and simulated heat release rate are shown in Figure 2. ] W M [ e t a r e s a l e r t a e H
45
90 FDS 2 MTFVTP
40
m [ e t a ]r s 3/w o l f
35 30 25
e m u l o V
20 15
70 60 50 40 30
10
20
5
10
0
0
50
100
150 Time [s]
200
250
300
FDS 2 MTFVTP
80
0
0
50
100
150 Time [s]
200
250
300
Figure 2: Heat release rate and volume flow rate
In the following paragraphs the simulation results for each loop are compared with the measured data. 5.1 Loop 307 (62 m north from fire) The comparison between the measured data and the simulation shows good agreement (Figure 3).
FDS 2.0
MTFVTP
300 ] C ° [ r u t a r e p m e t r i A
300 ] C ° [
G F E D C B A
250
200
r u t a r e p m e t
150
r i A
100
50
0
G F E D C B A
250
200
150
100
50
0
50
100
150 time [sec]
200
250
0
300
0
50
100
150 time [sec]
200
250
300
Figure 3: Loop 307, 62 m north from fire
The hot gases travelled towards the north portal (uphill) and Loop 307 measured an increase in the air temperature. Once the ventilation was started, fresh air was forced from the point supply and cold air replaced the hot air and the measured temperatures decreased. The difference between the maximum temperatures measured and calculated at probe G is about 50°C. The maximum temperatures recorded by both probe F and E are higher than that recorded by probe G. Is this inversion of the temperature gradient real or due to a problem with probe G? Two hypotheses could explain this inversion: •
Probe G was defective and was not recording the correct temperature.
•
An object (which has not been modelled) was located close to the loop and modified the flow field in such a way that colder air was directed onto probe G.
The maximum value simulated for probe F has a 10°C difference with the measured maximum. The maximum temperatures simulated for G, F and E appear earlier than the measurements (∆t=~30sec). Small changes in the modelling of the point supply – a sensitive parameter – modify the temperature gradient at Loop 307. The injected air flow has been simulated using the 8 points given by the MTFVTP Test Report with linear interpolation. A larger number of points may have improved the results. The direction of the air flow at the point supply has been simulated as being perpendicular to the false ceiling but this might not represent reality, depending on the false-ceiling geometry and the ventilation system configuration. 5.2 Loop 306 (29 m north from fire) The increase of temperatures recorded at Loop 306 before the ventilation was started, as well as the temperature decrease once the ventilation had been started, have been properly simulated (Figure 4). FDS 2.0
MTFVTP
550 ] C ° [ r u t a r e p m e t r i A
550 ] C ° [
G F E D C B A
500 450 400 350
r u t a r e p m e t
300 250
r i A
200
450 400 350 300 250 200
150
150
100
100
50
50
0
0
50
100
150 time [sec]
200
250
300
G F E D C B A
500
0
0
50
100
150 time [sec]
Figure 4: Loop 306, 29 m north from fire
200
250
300
As for Loop 307, the maximum simulated temperatures also appear earlier than the measured ones. The maximum measured and simulated temperatures at probe F have a difference of about 20°C. The simulated probe E and D have underestimated the maximum measured temperature by ~50°C. 5.3 Loop 305 (11 m north from fire) The results obtained for Loop 305 are the least accurate (Figure 5). The difference between the maximum temperatures measured and simulated at probe G is about 50°C. The comparison with the experimental data shows that the simulated temperature at probes F and E are underestimated by 20%. Before starting the ventilation the hot gases went uphill towards the north portal. The velocity field in the tunnel is driven only by the fire. FDS 2.0
MTFVTP
1000 ] C ° [ r u t a r e p m e t r i A
1000 ] C ° [
G F E D C B A
900 800 700
r u t a r e p m e t
600 500 400
r i A
300
800 700 600 500 400 300
200
200
100
100
0
0
50
100
150 time [sec]
200
250
300
G F E D C B A
900
0
0
50
100
150 time [sec]
200
250
300
Figure 5: Loop 305, 11 m north from fire
Figure 6: Flame sheet 100 sec after the start of the fire, with loop 305, 205 and 304
Figure 6 shows the flame sheet 100 seconds after the start of the fire. Points E, F and G are inside the flame where, theoretically, no combustion is taking place. This is a limitation of the model: in reality the combustion is not an infinitely fast reaction but takes time and with the strong turbulence and buoyancy forces, the combustion is brought inside the flame sheet as defined by the mixture fraction model. 5.4 Loop 205 (at the fire) The results simulated for Loop 205, the closest to the fuel pan, are not presented here. Even though the simulated results are of same amplitude as the measured data, they fluctuated too much to make any interesting comparison. 5.5 Loop 304 (12 m south from fire) Loop 304 is the closest one south of the fire and the ‘shape’ of the temperature plots is different from the ones recorded by the loops north of the fire. The temperatures increased when the ventilation was started and forced the air from the point supply, to the south portal, through the fire (Figure 7).
FDS 2.0
MTFVTP
1000 ] C ° [ r u t a r e p m e t r i A
1000 G F E D C B A
900 800 700
] C ° [ r u t a r e p m e t
600 500 400
r i A
300
900 800 700 600 500 400 300
200
200
100
100
0
0
50
100
150 time [sec]
200
250
0
300
G F E D C B A
0
50
100
150 time [sec]
200
250
300
Figure 7: Loop 304, 12 m south from fire
The comparison shows that the simulation overestimates the temperatures before the ventilation is started and underestimates them once the ventilation is running at full speed. Nevertheless the final temperatures predicted by FDS2 are, for the four points: A, D, F and G, within 20°C of the measured data. For the three remaining points the error is about 100°C The problem faced at Loop 305 (11 m north of the fire) does not appear at Loop 304 (12 m south of the fire). Before the ventilation is started the flame sheet hardly ever reaches Loop 304 because it then tends to go up to the north portal. Once the ventilation is started, the air flow is forced south. The strong mixing due to the increased turbulence and the extra oxygen, both a consequence of the forced ventilation, reduce the size of the flame sheet. The flame sheet reaches the measurement tree as ‘bubbles’ which quickly run out of fuel (burn out). When the fire is ventilated more oxygen arrives and mixes with fuel and the heat release rate at the flame sheet increases. A visualisation of the flame sheet is given, as an example, in Figure 8, 240 seconds after the start of the fire.
Figure 8: Flame sheet 240 sec after the start of the fire, with loop 305, 205 and 304
5.6 Loop 303 (26 m south form fire) The increase of temperature associated with the start of the ventilation, which pushed the hot gases towards the south portal, is well represented by the simulation (Figure 9). FDS 2.0 ] C ° [ r u t a r e p m e t r i A
MTFVTP
G F E D C B A
700
600
500
] C ° [ r u t a r e p m e t
400
300
r i A
700
600
500
400
300
200
200
100
100
0
0
50
100
150 time [sec]
200
250
300
G F E D C B A
0
0
50
100
150 time [sec]
Figure 9: Loop 303, 26 m south from fire
200
250
300
The simulated temperatures at probes C, D and A agree well with the recorded data. During most of the test the two simulated probes G and F overestimate the measured temperature by about 100°C. The simulated temperature at probe B underestimates the measured temperature once the ventilation starts. The temperature measured by probe E does not fit with the expected stratification of the temperature as a function of the height. The same two questions mentioned for probe G at Loop 307 arise: •
Does probe E correctly record the air temperature? Is the measurement valid?
•
Was an object present close to the loop (which has not been modelled) that modified the flow field in such a way that colder air was directed onto probe E?
5.7 Loop 302 (66 m south from fire) The temperatures recorded during the test are well reproduced by the simulation except for the temperature gradient simulated at probe A which is stronger, 200 sec after the beginning of the fire, than the measured one (Figure 10). At probe B the simulation provides a good approximation of the temperature during the first 210 sec, after which its value increases more slowly than the measured one. This could be explained by a problem of turbulence induced by an object not simulated in the model. FDS 2.0
MTFVTP
450 ] C ° [ r u t a r e p m e t r i A
450 ] C ° [
G F E D C B A
400 350 300
r u t a r e p m e t
250 200
r i A
150
400 350 300 250 200 150
100
100
50
50
0
0
50
100
150 time [sec]
200
250
0
300
G F E D C B A
0
50
100
150 time [sec]
200
250
300
Figure 10: Loop 302, 66 south from fire
5.8 Loop 301 (107 m south form fire) As for Loop 302 the temperature gradient, once the ventilation system is running, is overestimated by probe A (Figure 11). FDS 2.0
MTFVTP
300 ] C ° [ r u t a r e p m e t r i A
300 G F E D C B A
250
200
] C ° [ r u t a r e p m e t
150
r i A
100
50
0
G F E D C B A
250
200
150
100
50
0
50
100
150 time [sec]
200
250
300
0
0
50
100
150 time [sec]
Figure 11: Loop 301, 107 m south from fire
200
250
300
Apart from probe B (which underestimates the final measured temperature) the other simulated data are in good agreement with the measured values. The temperatures recorded by probes D, E, F and G are, during the 5 first minutes of the test, of similar values. This has been well simulated. The temperature stratification has also been well modelled; the temperature at probe B is lower than that measured by probe F but higher than those recorded by probes G and D. Even if the simulated results for probes C and D underestimate the temperatures, their difference is well modelled. 5.9 Loop 202 (236 m south form fire) 23 m south from the fire and 3 minutes after the start of the fire, the simulated temperatures are within 15°C of the measured values (Figure 12). FDS 2.0
MTFVTP
180 ] C ° [ r u t a r e p m e t r i A
180 ] C ° [
G F E D C B A
160 140 120
r u t a r e p m e t
100 80
r i A
60
160 140 120 100 80 60
40
40
20
20
0
0
50
100
150 time [sec]
200
250
300
G F E D C B A
0
0
50
100
150 time [sec]
200
250
300
Figure 12: Loop 202, 237 m south from fire
The increase of temperature, once the ventilation is started, is overestimated by the simulation. The simulation gives a temperature stratification that is not as strong as the one measured. The final temperatures measured go from 85°C to 160°C, while the simulated ones go from 100°C to 150°C.
6
DISCUSSION
The validation of the freeware ‘Fire Dynamics Simulator version 2.0’ (FDS2) has been carried out using the Memorial Tunnel Fire Ventilation Test Program (MTFVTP) Test Case 321A. This paper has demonstrated that the FDS2 code predicts well the measured data and is suitable for predicting fires in tunnels. FDS2 not only predicts well the overall phenomena but also gives valuable estimations of the temperatures. The main goals of the MTFVTP were to define the best ventilation system to adopt in road tunnels in case of fire and to create a database. The MTFVTP database has largely been used to validate numerical codes even if some particular items of information are missing. Very limited information about the characteristics of the concrete and the fire-proofing material are given in the MTFVTP Test Report. That information is essential to calculate the heat flux through the walls and the resulting drop of air temperature. Small differences in any of the values defining those characteristics produce noticeable changes in the air temperature even if the overall phenomena are kept unchanged. The flame sheet is determined by the flow field through the mixture fraction. The heat release at the flame sheet changes the flow field and the temperature field associated with it. Any object in the tunnel modifies the flow field and, therefore, the flame sheet and the temperature field. The modelling of the boundary conditions as close to reality as possible is needed to reach good results. Not enough information on the shape and position of all the data acquisition and support systems placed in the tunnel are given in the MTFVTP Test Report which may lead to inaccuracies in the modelling of the system.
The fuel pans, as an example, not only define the base of the flame sheet but also modify the flow field. Small differences in the modelling of the fuel pan, where the fire is taking place, produce different flame sheets with different flow and temperature fields. The results of the temperature, velocity or gas concentrations made during the MTFVTP are presented in the Test Report with a period of ~30 seconds. The Shannon sampling theorem states that, when converting from an analogue signal to digital, the sampling frequency must be greater than twice the highest frequency of the input signal in order to be able to reconstruct the original perfectly from the sampled version [10]. Following this theorem the number of data points given in the MTFVTP Test Report allows reconstruction of a signal with a period of a minute! With such a frequency significant information has been lost. The accurate measurement of high temperature is not easy. Most of the measurement devices had to be protected against the heat. The measurement uncertainty is not given in the MTFVTP Test Report but cannot be neglected. Another unknown is the delay induced by the measurement devices and if it has been corrected. For a Large Eddy Simulation (LES), where the grid resolution is not fine enough to capture the mixing processes at all relevant scales, a sub-grid scale model for the viscosity is applied. The grid used here is too coarse to capture the small eddies at the flame and results in a smooth flame sheet. Without taking into account that the combustion is not an infinitely fast reaction, the flame sheet has a thickness due to the turbulence which brings the combustion in and out of the flame sheet as defined by FDS2. Bell et al.[1], show the combustion layer of a turbulent flame (Figure 13).
Figure 13: Turbulent flame2
7
CONCLUSION
Numerical simulation and experiment are two powerful tools to understand fire in tunnels. Simulations are widely used to predict smoke propagation or the temperature field, but before being used they need to be validated with experimental data. The validating process requires having access to complete, and well documented, experimental data in order to evaluate and improve the simulation. With a more complete set of values the results presented in this paper may have been improved. The code FDS2 can provide information equal to commercially available CFD codes. 8
REFERENCES:
[1]
Bell, et al, ‘Turbulent Flame Propagation, Proceeding. of the Combustion Symposium 28, 2000"
[2]
J. R. Day, M. Spoerri & A. Turi, A “footprint” technique for rapidly assessing the effectiveness of emergency ventilation systems, 10th Int. Symposium on Aerodynamics and
2
"Turbulent flame propagation" - image courtesy of the Center for Computational Sciences and Engineering at the Lawrence Berkeley National Laboratory. (http://seesar.lbl.gov/CCSE)
Ventilation of Vehicle Tunnels, Boston, USA: 1 - 3 November 2000, BHR Group Ltd, ISBN 1 86058 255 9
[3]
Drotz. Méthodes numériques en Mécanique des Fluides. Notes de cours. 1999
[4]
J.E. Floyd, H.R. Baum and K.B. McGrattan. A Mixture Fraction Combustion Model for Fire Simulation Using CFD. Technical Report, National Institute of Standard and Technology, Gaithersburg, Maryland, USA, November 2001.
[5]
K.B. McGrattan, H.R. Baum, R.G. Rehm, G.P Forney, J.E. Floyd, and S. Hostikka. Fire Dynamics Simulator (Version 2) - Technical Reference Guide. Technical Report NISTIR 6783, National Institute of Standard and Technology, Gaithersburg, Maryland, USA, November 2001.
[6]
K.B. McGrattan, G.P Forney, J.E. Floyd, and S. Hostikka. Fire Dynamics Simulator (Version 2) - User’s Guide. Technical Report NISTIR 6784, National Institute of Standard and Technology, Gaithersburg, Maryland, USA, November 2001.
[7]
K.B: McGrattan, H.R. Baum, R.G. Rehm, G.P Forney, J.E. Floyd, and S. Hostikka. User’s guide for Smokeview Version 2.0 - A Tool for Visualizing Fire Dynamics Simulation Data. Technical Report NISTIR 6761, National Institute of Standard and Technology, Gaithersburg, Maryland, USA, July 2001.
[8]
F.P. Incropera and D.P. DeWitt. Fundamentals of Heat and Mass Transfer. John Wiley & Sons, Inc, New York, USA, 1996.
[9]
M. Lesieur. La Turbulence. Presses Universitaires de Grenoble, Grenoble, France, 1994
[10]
R. Longchamp. Commande numérique de système dynamiques. Presse Polytechniques et universitaire romandes, Lausanne, Switzerland 1995
[11]
Massachusetts Highway Department. Memorial Tunnel Fire Ventilation Test Program, Interactive CD-ROM & Comprehensive Test Report, 1996
[12]
R.G. Rehm and H.R Baum, The Equations of Motion for Large Industrial Outdoor Fires. In Fire Safety Science – Proceedings of the Sixth International Symposium. International Association for Fire Safety Science, 1999
[13]
J. Smagorinsky. General Circulation Experiments with the Primitive Equations. I. The Basic Experiment. Monthly Weather Review, 91:99-164,1963