activities age-appropriate: the ball and peekaboo cloth were replaced by hand puppets and a toy house. Transcription. Videotaped parent-child interaction was ...
First Language http://fla.sagepub.com/
Predictors of MLU: semantic and morphological developments Pamela Rosenthal Rollins, Catherine E. Snow and John B. Willett First Language 1996 16: 243 DOI: 10.1177/014272379601604705 The online version of this article can be found at: http://fla.sagepub.com/content/16/47/243
Published by: http://www.sagepublications.com
Additional services and information for First Language can be found at: Email Alerts: http://fla.sagepub.com/cgi/alerts Subscriptions: http://fla.sagepub.com/subscriptions Reprints: http://www.sagepub.com/journalsReprints.nav Permissions: http://www.sagepub.com/journalsPermissions.nav Citations: http://fla.sagepub.com/content/16/47/243.refs.html
>> Version of Record - Jun 1, 1996 What is This?
Downloaded from fla.sagepub.com at Harvard Libraries on December 4, 2014
243
Predictors of MLU: semantic and
morphological
developments* PAMELA ROSENTHAL ROLLINS,
SNOW Harvard Graduate School of WILLETT
CATHERINE E. JOHN B.
University of Texas at Dallas
}
Education
ABSTRACT
In the past decade the existence of individual differences in both rate and route of language development has been widely accepted. Some between-child differences are observed in the synchronization of morphological with semantic skills. These differences are obscured by portmanteau measures like MLU. The purpose of this paper is to explore semantic and morphological predictors of MLU in order to identify individual variation in language development in a fairly large number of typically developing children. To accomplish this goal, we identified two additional variables: NPSAT, a measure of morphological skill, and MLUcw, a measure of utterance length in content words. A growth modelling strategy was used to identify both ’within-child’ and ’between-child’ differences in longitudinal data from 36 children. We found that typically developing children indeed use different strategies in lengthening their utterances. We therefore recommend caution in the use of MLU to ’language match’ children when doing research on early language development. INTRODUCTION
Mean
*
Length
of Utterance in
morphemes (MLU-m)
was
proposed by
Portions of the analyses discussed here have been presented at ASHA. The authors would like to express their appreciation to Barbara Pan for co-ordinating the transcription and data analysis on the New England sample and for help with reliability, to Andrew Celesnick for completing the noun phrase saturation coding, to the many transcribers who helped produce the transcripts, and to Krista Bey for editorial assistance. This research was supported by NIH through ’Foundations for Language Assessment in Spontaneous Speech’, HD 23388, C. Snow, P.I. Address for correspondence: Pamela Rosenthal Rollins, UTD/Callier Center, 1966 Inwood Rd, Dallas, TX 75235, USA.
0142-7237/96/1602-0243
$5.00
@
Alpha Academic
Downloaded from fla.sagepub.com at Harvard Libraries on December 4, 2014
244
Brown (1973) as a relatively easy mechanism for selecting, from different children, language samples that represented comparable developmental levels and thus might display similar linguistic phenomena. Indeed, for Brown’s subjects Adam, Eve and Sarah, samples selected at particular MLU-m points seemed remarkably similar in other respects as well: in the types of semantic relations expressed and the types of morphological markers supplied. Following Brown’s early work, MLU-m has become the standard developmental index for child language researchers by which children are compared with one another. In this tradition, MLU-m has also been used extensively as a matching variable in studies in which children with language disorders are compared with children developing normally. In recent years, however, researchers have questioned the utilization of MLU as a research and clinical tool (Plante, Swisher, Kiernan & Restrepo 1993). This is because language is a multi-dimensional skill, and MLU-m therefore obscures individual differences among children in their focus, for example, on semantic and morphological learning. The purpose of this paper is to document that changes in MLU-m reflect changes in both semantic and morphological learning and that the relative contribution of these skills may differ across children having similar MLU-ms. To accomplish this goal, we identify new measures that reflect developmental change in semantic and morphological learning. Before we describe the current study, we will (a) review the advantages and limitations of using MLU-m, and (b) identify the component parts of MLU-m which suggest the value of different measures. Reasons
why MLU-m has been
used
Part of the reason that MLU-m has been so widely adopted in child language research is that it is developmentally sensitive and reflects advances in any of a variety of language systems, including morphology, syntax, semantics and conversational skill. Thus, MLU is generally considered useful as an indicator of a child’s global language level, even though it provides an inadequate basis for tracing changes in component systems or for matching children (Plante et al. 1993). Limitations
of MLU-m strengths in MLU-m
The have led some to ignore the limitations that have been identified in the literature over the past 20 years. Documented limitations have included the following: 1.
MLU-m does not reflect structural characteristics of the child’s language past the early stages of development. A reliable
Downloaded from fla.sagepub.com at Harvard Libraries on December 4, 2014
245
with morphosyntactic skills has only been established between MLU-m scores of 1.0 and aproximately 4.0, which is typically reached at about 3;6 years (Klee & Fitzgerald 1985, Rondal, Ghiotto, Bredart & Bachelet 1987, Scarborough 1990). The reliability of MLU-m declines at higher scores as the acquisition of new grammatical knowledge (such as control over ellipsis and embedding) is no longer reflected in utterance length. At these higher levels, utterance length tends to reflect conversational context much more than developmental stage (Johnston, Miller, Curtiss & Tallal 1993). Though it is crucial that MLU-m be based on a count of morphemes the child is using productively, it is not always clear exactly which ones these are. In Brown’s original study, he first carried out a full-scale productivity analysis of his subjects’ speech, using several hundred utterances to decide which morphemes were used in several different contexts, before calculating MLU-m on one hundred utterances. The common practice since Brown, though, has been to calculate MLU-m using general rules about what morphemes are likely to be productive, and very often with only a hundred or so utterances available in all. Unfortunately, either alternative (i.e., to do a proper productivity analysis or to rely on general rules) has its problems. MLU-m works fairly well for languages, like English, that have segmentable morphological markers, but is difficult to apply to synthetic languages, and may produce non-comparable results across different languages (Crystal 1974). Only limited reliability for MLU-m has been established with children who exhibit language disorders (Rondal et al. 1987, Scarborough, Rescorla, Tager-Flusberg, Fowler & Sudhalter 1991). For these children, the particular pattern of linguistic, cognitive, social, and communicative factors exhibited may influence utterance length (Rollins 1994, Scarborough et al. 1991). Thus, MLU may reflect language differently for different populations of children (Johnston & Kamhi 1984, Plante et al. 1993, Scarborough et al. 1991 ). There has been some question as to which utterances to include in the MLU-m calculation to ensure representativeness. Some utterance types artificially inflate or deflate MLU-m calculations (Chapman 1981, Plunkett 1993). Researchers studying children with and without language disorders have modified Brown’s original rules by excluding some or all of the following utterance types: imitations of the previous speaker, self-repetitions, one word
relationship
2.
3.
4.
5.
Downloaded from fla.sagepub.com at Harvard Libraries on December 4, 2014
246 answers to
and routines (Bloom 1970, Rollins 1991 ). Klee & Fitzgerald ( 1985) proposed
yes-no-questions,
1994, Scarborough
et al.
called Mean Syntactic Length, excluding single order to eliminate pragmatic influences on morpheme utterance length. There is considerable diversity of practice concerning which utterances to include in the MLU-m calculation to ensure that the metric best represents the child’s linguistic level. Similarly, Plunkett (1993), found that the application of standard distributional and frequency criteria inflated the MLU-m as compared with an articulatory precision and fluency criteria. a measure
they
utterances in
Identifying predictors of MLU-m It is clear from much research that MLU-m does correlate with morphological and syntactic skills in young children (Brown 1973, de Villiers & de Villiers 1973, Klee & Fitzgerald 1985, Rondal et al. 1987, Scarborough 1990). Yet, some research suggests that normallydeveloping children show considerable variation in morphological sophistication at all levels of MLU-m. Lahey, Libergott, Chesnick, Menyuk & Adams (1992) found variation across children in the proportional use of each of Brown’s 14 grammatical morphemes at identical MLU-m levels. Though their work did not address the source of variation empirically, we might suggest that the variation they found occurs because a subset of typically developing children use a relatively high proportion of content words at a given MLU-m level. That is, while some children may increase their MLU-m by increasing their use of grammatical morphemes, adding plurals and determiners as in the noun phrase ’the boys’, others may increase their MLU-m by increasing the number of content words, e.g., ’good boy’, ’two boy’, or ’very big boy’. It is important then to understand the relative contribution that grammatical morphemes and content words make to utterance length. Evidence that their contribution may differ between children comes from case studies reported in Snow & Pan (1993) whose data on normally-developing children with MLU-m scores of 1.30-1.33 varied enormously in use of morphological markers. Thus, exploring the normal variation in the relative contribution that grammatical morphemes and content words make to MLU-m is necessary if we are to understand exactly what MLU-m measures, both for normally-developing children and for children with language disorders. The
study
The current
study
was
undertaken to extend
our
understanding
Downloaded from fla.sagepub.com at Harvard Libraries on December 4, 2014
of how
247 children can be achieved through different longitudinal data collected from a relatively large of sample normally-developing children to test our hypothesis in the context of development. We hypothesize that changes in MLU-m reflect the relative contributions of the morphological system (as evidenced by the use of function words and inflections) and semantic system (as evidenced by children’s use of content words). In order to test this, we have examined the relationship between change over time in MLU-m and changes in two additional variables: (a) NPSAT, a measure of morphological skill (see below for explanation), and (b) MLU-cw, a measure of utterance length in content words. In this paper, we investigate the relationship between the changes in MLU over time and the development of these two predictors to determine the degree to which MLU-m obscures differences among children in their strategies for lengthening their utterances. We used longitudinal data collected from a relatively large sample of subjects developing normally to allow for the testing of developmental hypotheses using a similar MLU-ms
across
routes. We used
growth modelling perspective. RESEARCH DESIGN
Subjects The subjects
whose language development is reported here were drawn from the New England sample (Pan, Imbens-Bailey, Winner & Snow, in press, Snow, Pan, Imbens-Bailey & Herman, in press).’ We chose the 52 children for the New England sample from a larger sample of 100 children on whom video tapes were available through the MacArthur Individual Differences Project (see Dale, Bates, Resnick & Morisett 1989, for description of subject recruitment and background information on the original sample). We selected the New England sample using the following criteria: English-speaking families; no evidence by age 3 of any hearing impairment or developmental delay; equal proportions of girls and boys; representation of the full range of socio-economic status available in the original sample; and children whose families could be contacted for data collection at age 5. An additional criterion for the current study was that children were brought to the laboratory for assessment at 1;2, 1;8, and again at 2;6-2;8. These criteria constrained the sample to 36 children, 18 boys and 18 girls.
[1]
The New
England sample has been donated to the CHILDES data base.
Downloaded from fla.sagepub.com at Harvard Libraries on December 4, 2014
248
Hollingshead score was 55 with a standard deviation of 10.6. Preliminary analyses indicated that differences among children either in skill level or in growth rate were unrelated to gender or social class,2 therefore we reported results from the group as a whole (see Snow et al., in press, for other analyses on this same sample). Mean
Data collection
Parent-child dyads were brought to the laboratory at three ages: at ages 1;2, 1;8, and again between the ages of 2;6 and 2;8. With the exception of three children who were videotaped with their fathers for one session, all dyads were mother-child pairs. Parents and children were videotaped using a camera located either at ceiling level in one comer of the room and operated by remote control, or located behind a oneway mirror. At 1;2 and 1;8, transcripts analysed for this study consist of spontaneous language collected during a variety of dyadic activities. During the warm-up period, the parent and child were left alone in a small room with a set of toys, and the parent was instructed to take a few minutes to let the child become accustomed to the setting. During the remaining semi-structured free play period, the parent was asked to play with the child using the contents of four boxes. The boxes contained, in order, a ball, a cloth for peekaboo, paper and crayons, and a book. Parents were not instructed how long should be spent on each box, but were asked to have only one box open at a time, and to try to get to all four boxes in about 10 minutes. In reality, the sessions were terminated only when the parent had tried to engage the child in all four activities. This led to some variation in the duration of the videotaped session, ranging from 10 to 25 minutes, with greater variability in session length at 1;2 than at 1;8. The protocol for parent-child interaction at the third time point (ages 2;6-2;8) also involved the four boxes. There was no warm-up period, however, and two substitutions were made in order to render the activities age-appropriate: the ball and peekaboo cloth were replaced by hand puppets and a toy house.
Transcription Videotaped parent-child
interaction
was
transcribed
on
to
computer
[2] We performed regression analyses in which we treated social class as a continuous variable, using Hollingshead scores. There were no significant gender or
SES differences
on
any of the
measures
of skill level
or
Downloaded from fla.sagepub.com at Harvard Libraries on December 4, 2014
estimated
growth rate.
249 files using the transcription conventions of the Child Language Data Exchange System (MacWhinney 1991). Transcripts were verified by a second
transcriber for content and checked for adherence to conventions using the automatic checking facilities of the CHILDES system. Utterance boundaries were based primarily on intonation contour and secondarily on pause duration. No attempt was made to distinguish the number of unintelligible words in a string. Discrepancies in the transcription were resolved by consensus.
transcription
Language measures For each child at each obtained:
point
in time, the
following
measures were
1. Mean Length of Utterance in morphemes (MLU-m) MLU-m was computed automatically using the computer facilities of the Child Language Data Exchange System. Guidelines proposed by Brown (1973) were employed, except that we chose not to omit the first page of the transcript and we employed a time-based criterion rather than an utterance-based criterion to control for possible sampling differences (Miller 1991). Anticipating that few of our subjects would produce enough intelligible utterances at 14 months to constitute a 100utterance sample, we included all utterances occurring within the first 10 minutes.33 2. Noun Phrase Saturation (NPSAT) NPSAT measures morphological skill by examining children’s provision of morphological markers (articles, delimiters or number markings) within the noun phrase (refer to Appendix A). This measure Elkins (1989) and was designed was based on one developed by Pan & as an alternative to the traditional practice of assessing the percentage of occasions on which a child supplies each of 14 English morphemes (Brown 1973). The traditional practice, which determines separate scores for each of the 14 morphemes in the obligatory context, is typically unreliable for analysing morphological skills in children at emergent stages of language development. First, certain morphological I
[3]
MLU was generated automatically using the CLAN program MLU. By default, this program excludes unintelligible strings and repetitive dysfluencies. That is, a child utterance that is entirely unintelligible contributes neither to the number of child utterances nor to the number of child morphemes. By contrast, a partially unintelligible utterance such as ’want xxx’ does contribute to the total number of child utterances, with the unintelligible string xxx being counted as one morpheme in length.
Downloaded from fla.sagepub.com at Harvard Libraries on December 4, 2014
250
categories do not naturally occur at high frequencies, particularly when language samples contain relatively few utterances; and second, considerable interpretation of the child’s intended utterances is often required in order to determine which morphological marker is obligatory. For example, when a child points to a plate of cookies and says ’want cookie’, the observer is hard pressed to decide whether the omitted obligatory morpheme is the article a or the plural marker -s (Lahey et al. 1992). We have therefore adopted a somewhat less detailed way of assessing very young children’s morphological production in spontaneous speech that requires less inference. Each noun phrase produced by the child is identified and coded - first, for whether overt morphological marking is required and, second, for whether the child provides all required morphological markings. NPSAT is then computed as the percentage of total noun phrases in which the child correctly used a morphological marker, when a marker was obligatory. Thus, in the noun phrase ’cat’ the observer need not decide whether the target phrase was ’a cat’, ’the cat’ or ’two cats’, only that a necessary morphological marker was not provided. In the original Pan & Elkins scheme, separate saturation scores could be calculated for the noun, verb, and prepositional phrases used in the speech samples of very young children. In the present study, we present only information on the noun phrase saturation measure (NPSAT) because children in the age range 1;2-2;8 produce few verb and prepositional phrases that require overt morphological marking. 3. Mean Length of Utterance in content words (MLU-cw) MLU-cw was used to measure the child’s ability to produce semantic content. As with MLU-m, MLU-cw was computed automatically using the MLU program of CHILDES on all utterances occurring within the first 10-minute interval. In order to eliminate the influences of grammatical morphemes on mean utterance length, all bound morphemes and function words such as ’a’, ’the’, ’in’ and ’on’ were excluded from the computation. MLU-m and MLU-cw were computer-generated, therefore estimates of inter-rater agreement were not obtained. Twenty per cent of the total corpus from which NPSAT was computed was coded independently by a second rater, for a net agreement of 94% (Cohen’s
Reliability
Kappa
=
0.92) .
Statistical
analyses Historically, there has been considerable controversy about the measurement of change (Rogosa, Brandt & Zimowsky 1982). Taking
Downloaded from fla.sagepub.com at Harvard Libraries on December 4, 2014
251
snapshots of children’s observed status ’before’ and ’after’ is not the best way to reveal the intricacies of their progress. Changes may be occurring smoothly over age with some complex and substantively interesting trajectory. Crude pre-/post-measurements can never reveal the details of that trajectory. To do a good job of describing individual change over time, a truly longitudinal perspective must be adopted. Children must be followed carefully over time with multiple waves of data being collected on their status at sensibly spaced intervals. The investigator must assemble an observed growth record for each child in the data set. If the attribute of interest - MLU-m, for instance - is changing steadily and smoothly over a long period of time, perhaps only three widely-spaced measurements (’waves of data’) on each child will be sufficient to capture the shape and direction of the change. But if the trajectory of individual change is complex, then many more closely-spaced measurements may be required. Once collected, preliminary analyses of the observed growth records are aided by plotting a graph of observed status against age ’within’ each child. Inspection of these ’within-child’ plots then provides evidence as to whether and how each child is changing with age. Some children may be changing rapidly while others may be changing more slowly, or not at all. Subsequently, the within-child empirical growth plots can be summarized by fitting a suitable individual growth model to the data for each child. In our study, inspection of within-child plots suggested that a straight-line could be used to represent individual growth in each of the measures with age. (The decision to use a linear individual growth model is consistent with the picture from cross-sectional studies on the relationship between MLU-m and age through 36 months of age; see Klee, Schaffer, May, Membrino & Mougey 1989, Miller & Davidson 1986, Wells 1985). Chapman 1981, Scarborough, Wyckoff & we used Consequently, ordinary least-squares regression analysis and a to summarize linear model change over time in MLU-m, NPSAT and MLU-cw. Finally, the estimated slopes of these fitted trajectories were used in follow-up analyses to represent monthly rates of change for each child on each measure (between the ages of 14 and 32 months). In these ’between-child’ analyses, we could easily explore the relationship between our dependent variable - monthly change in MLU-m - and monthly change in NPSAT and MLU-cw using standard correlational and regression methods. For a fuller description of the individual growth modelling strategy used here, see Willett (1989, 1994). Willett & Ayoub ( 1991 ) provide a detailed worked example of the approach.
Downloaded from fla.sagepub.com at Harvard Libraries on December 4, 2014
252 TABLE 1.
14
to
Univariate statistics for monthly rate of growth from 32 months of age and precision estimates (n = 36)
RESULTS
Within-individual growth Growth in MLU-m Table 1 presents univariate statistics summarizing the sample distributional properties of the estimated monthly rate of individual change in MLU-m. The estimated rates of change rangeci from 0.027 to 0.197 morphemes per month, with an average of 0.090 morphemes per month across all children (the slope of the growth curve differs from 0, t = 14.2, p < 0.0001) and a standard deviation of 0.018 morphemes per month. These findings are consistent with the cross-sectional studies of Miller & Chapman (1981) who found an average ’monthly’ rate of change of 0.103 and of Klee et al. (1989) who found an average ’monthly’ rate of change of 0.085. As to be expected from a longitudinal design such as ours, on average, the coefficient of determinations was higher in the present study than in either the Miller & Chapman or the Klee et al. studies which obtained R2statistics of 0.78 and 0.56, respectively. In our study, across all children in the sample, the average R2statistic for the within-individual relationships between MLU-m and age was 0.919 with a standard deviation of 0.095. The observed within-individual R2statistic for 75% of the sampled children was 0.897 or higher. As is evident from the RZstatistics, most of the individual growth rates were precisely estimated; the standard errors of the estimated growth rates were less than 0.083 for all children examined. The mean square error (MSE) for child number two, however, was large. Inspection of the individual growth record for this child suggested that MLU-m had plateaued between 20 and 32 months. Such plateaux have been observed in cross-sectional samples for children of 42 months and above (Scarborough et al. 1986). Hence, assuming a linear relationship
Downloaded from fla.sagepub.com at Harvard Libraries on December 4, 2014
253 between MLU-m and age was unjustified for this particular child and she was removed from the sample in the subsequent between-child
analyses. Growth in Noun Phrase Saturation4 Table 1 also displays summary statistics describing the monthly rate of individual change in NPSAT. The average rate of change in NPSAT was approximately 3.8% per month (the slope of the growth curve differs from 0,t = 19.8, p < 0.0001). As evident from the R2 statistic and the MSE statistic (see Table 1), all individual growth rates were precisely estimated. Growth in MLU-cw On average, children’s MLU-cw increased by 0.064 content words per month (the slope of the growth curve differs from 0,t = 7.46, p < 0.0001) between the ages of 14 and 32 months (see Table 1). As evident from the R2statistic and the MSE statistic (see Table 1), all individual growth rates in MLU-cw were precisely estimated.
Inter-individual
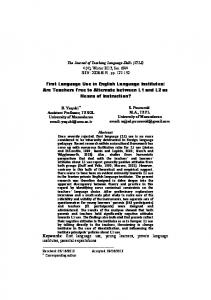
differences in monthly rate of change in MLU-m expected, for children between 14 and 32 months, there was a moderate, positive relationship between growth in MLU-m and growth in NPSAT (r 0.488, p < 0.003) and a strong positive relationship between growth in MLU-m and growth in MLU-cw (r 0.923, p < 0.0001). Furthermore, controlling for growth in MLU-cw, the estimated partial correlation between MLU-m and NPSAT was 0.566 (p < 0.0005), suggesting that growth in NPSAT is useful for measuring growth in morphological skills in young children. We regressed MLU-m on the main effects of NPSAT and MLU-cw, individually and as a pair (see Table 2, Models M1, M2 and M3). In the final regression model, which contained both predictors, approximately 90% of the variation in the monthly rate of change in MLU-m was attributable to the combined effects of monthly growth in NPSAT and in MLU-cw. For the final model, we plotted the fitted relationship between growth in MLU-m and growth in NPSAT, at the sample first and third quartiles of growth in MLU-cw, representing slow and fast growth in semantic content, respectively (see Fig. 1). The figure illustrates that growth in MLU-m can be achieved in different ways by different children. For instance, among children who grow more slowly in semantic content, average growth in MLU-m can be achieved by As
was
=
=
[4] NPSAT was quadratically transformed our
correlation and
so that the linearity assumption underlying regression analyses was not violated.
Downloaded from fla.sagepub.com at Harvard Libraries on December 4, 2014
254 in MLU-m on and NPSAT (n = 35t)
Regression of growth
TABLE 2.
**
*p