RESEARCH ARTICLE
Fitness Change and Subsequent Academic Performance in Adolescents LI-JUNG CHEN, PhDa KENNETH R. FOX, PhDb PO-WEN KU, PhDc,d CHIH-YANG TAUN, PhDe
ABSTRACT BACKGROUND: This study examined the association between fitness change and subsequent academic performance in Taiwanese schoolchildren from 7th grade to 9th grade. METHODS: The 7th graders from 1 junior high school district participated in this study (N = 669). Academic performance was extracted from school records at the end of each grade. Cardiovascular (CV) fitness, sit-and-reach flexibility, bent-leg curl-ups, and height and weight for calculating body mass index (BMI) were assessed at the start of each grade. RESULTS: The results showed that improvement in CV fitness, but not muscular endurance or flexibility, is significantly related to greater academic performance. A weak and nonsignificant academic-BMI relationship was seen. CONCLUSION: CV fitness exhibits stronger longitudinal associations with academic performance than other forms of fitness or BMI for adolescents. Keywords: physical fitness; cardiovascular fitness; academic achievement; school performance; school achievement. Citation: Chen L-J, Fox KR, Ku P-W, Taun C-Y. Fitness change and subsequent academic performance in adolescents. J Sch Health. 2013; 83: 631-638. Received on March 8, 2012 Accepted on August 19, 2012
T
here is a possibility that maintaining a high level of physical fitness might be helpful for improving academic performance in schoolchildren. This belief is supported by a meta-analysis demonstrating a significant positive relationship between physical activity and cognitive functioning in children (effect size = .32).1 This fitness-academic performance relationship is especially interesting as students spend large amounts of their time at school working in the cognitive domain. Although several studies have found a positive link between physical fitness and academic performance,2-5 the focus has mainly been on cardiovascular (CV) fitness.6 Results for the association among other forms of fitness (muscular strength, flexibility, and body composition) and academic performance have been inconsistent,7-9 suggesting a need for further exploration. Additionally, there is little longitudinal work on the fitness-academic performance relationship, with 1
review showing that all studies were cross sectional and correlational in design.6 These cross-sectional studies are unable to establish the causal direction of the relationship between physical fitness and academic performance. Longitudinal data controlling potential confounders (eg, sex and socioeconomic status [SES]) only appear in 1 published prospective study.10 London and Castrechini10 examined the association between academic performance and overall physical fitness from 4th to 7th (N = 1325) and 6th to 9th grades (N = 1410) in the United States. The results indicated that a combination of fitness tests was more predictive of academic performance than any one test. Students who were persistently fit had higher academic scores than those who were persistently unfit, suggesting improved fitness is associated with increased academic performance over time. There is also 1 longitudinal study focusing on the association of CV fitness with cognitive function.11 The findings
a Associate Professor, (
[email protected]), National Taiwan University of Physical Education and Sport, No. 16, Section 1, Shuang-Shih Road, Taichung 404, Taiwan. bProfessor, (
[email protected]), University of Bristol, Centre for Sport, Exercise and Health, Tyndall Avenue, Bristol BS8 1TP, UK. c Professor, (
[email protected]), National Changhua University of Education, No. 1, Jinde Road, Changhua 500, Taiwan. dProfessor, (
[email protected]), National Yang Ming University, No.155, Sec. 2, Linong St., Beitou District, Taipei 112, Taiwan. e Assistant Professor, (
[email protected]), National Taiwan University of Physical Education and Sport, No. 16, Section 1, Shuang-Shih Road, Taichung 404, Taiwan.
Address correspondence to: Po-Wen Ku, Professor, (
[email protected]), National Changhua University of Education, No. 1, Jinde Road, Changhua 500, Taiwan. This work was supported by the Taiwan National Science Council (NSC-99-2410-H-028-002-MY2).
Journal of School Health
•
September 2013, Vol. 83, No. 9
•
© 2013, American School Health Association • 631
showed that those with increased CV fitness between 15 and 18 years of age had higher intelligence scores than those with decreased fitness. This suggests that CV fitness change is positively related to cognitive function for schoolchildren. During adolescence, physical fitness may change with age or physical maturation. Changes in fitness may be systematically related to time and this may confound relationships with academic performance. Advanced analytical techniques are available for assessing change that is systematically related to the passage of time.12 For instance, latent growth curve (LGC) analysis can provide growth curve interpretations and individual trajectories over time.13-15 Furthermore, previous reviews have shown that no study was conducted on Asian children.6 The cultural differences might affect this fitness-academic performance relationship. For example, there is a strong tradition and emphasis on education and attending additional academic sessions for Asian schoolchildren often at the expense of participation in active pursuits and sports.16,17 These academic-related behaviors, requiring sitting down, may restrict time available for physical activity and effect children’s fitness levels. Examining the association of physical fitness on academic development would provide information for educational policies on school curriculum to promote learning among schoolchildren. To address these concerns, this study was designed to explore the longitudinal associations of different forms of fitness on academic performance among adolescents. Specifically, this study applied regression and LGC analyses with 3-wave data on adolescent fitness and academic performance to fill the gap in the relationship between changes of fitness and subsequent academic performance.
of 2010 (end of 8th grade: academic data), Fall of 2010 (beginning of 9th grade: fitness data), and Summer of 2011 (end of 9th grade: academic data). Measures Academic performance. Academic performance was the outcome variable, which was measured as the mean score of Language, Mathematics, Science, and Social Studies. All students took exactly the same tests in school and the scores which ranged from 0 to 100 were extracted from the school records at the end of each grade. Fitness. The fitness tests were completed during physical education (PE) classes in fall each year, and administered by the Chief of PE to ensure consistency from 7th grade to 9th grade. The fitness tests included 4 measures: (1) 1600(boys)/800(girls)-meter run was used to assess CV endurance. It is one of the most widely used measures for determining aerobic capacity in children.2,5,10,18 Acceptable validity and reliability have been established in previous research;9 (2) The standardized sit-and-reach test was used to measure the lower back and hip joint flexibility; (3) The number of bent-leg curl-ups attained in 1 minute was used to test abdominal muscle strength and endurance; and (4) Body mass index (BMI) was obtained through measured height and weight by the school nurse. The raw scores of the 1600(boys)/800(girls)-meter run, sit-and-reach test, and bent-leg curl-ups were converted into a percentile rank (PR) based on normative data at each age and for each sex in Taiwan. Then, the above fitness results were grouped into 2 levels: ‘‘pass’’ and ‘‘fail.’’ Those who had fitness PR less than the 25th were classified as ‘‘fail,’’ which was suggested by the Taiwan Ministry of Education as ‘‘needs improvement.’’ Changes in fitness levels were created based on the difference between each child’s scores in 7th grade and 9th grade. Four groups were categorized: ‘‘pass-pass’’ (pass at 7th grade and 9th grade), ‘‘pass-fail’’ (pass at 7th grade but fail at 9th grade), ‘‘fail-pass’’ (fail at 7th grade but pass at 9th grade), ‘‘fail-fail’’ (fail at 7th grade and 9th grade). Weight and height were converted to BMI and children were categorized as underweight, normal weight, overweight, and obese using age and genderspecific criteria suggested by the Taiwan Ministry of Education.19 Both the overweight and obesity figures were combined for analyses and subsequently referred to as ‘‘overweight/obesity.’’ Then, a weight change variable was created based on an individual’s weight status difference between 7th grade and 9th grade. Six groups were categorized as ‘‘always normal’’ (normal weight at 7th grade and 9th grade), ‘‘always underweight’’ (underweight at 7th grade and 9th grade), ‘‘always overweight/obese’’
METHODS Participants This study was conducted in 1 high school district in Taichung City, the third largest city in Taiwan. All students who enrolled in the school at 7th grade (N = 723) were invited to take part in this study. Before collecting the data, the research team had meetings and discussions with the Principal, Director of Student Affairs, and Chairman of Parents’ Association of the school. Any student who moved out of the district, students with disability, or students who did not return the consent form were excluded from the study. The final sample was 669 with 352 boys and 317 girls (mean age grade = 14.6). Data were collected on 6 occasions across 3 school years. The 6 occasions were Fall of 2008 (beginning of 7th grade: baseline demographic data and fitness data), Summer of 2009 (end of 7th grade: academic data), Fall of 2009 (beginning of 8th grade: fitness data), Summer 632
•
Journal of School Health
•
September 2013, Vol. 83, No. 9
•
© 2013, American School Health Association
(overweight/obese at 7th grade and 9th grade), ‘‘became normal’’ (not normal weight at 7th grade but was normal weight at 9th grade), ‘‘became overweight/obese’’ (not overweight/obese at 7th grade but was overweight/obese at 9th grade), and ‘‘became underweight’’ (not underweight at 7th grade but was underweight at 9th grade). Demographic characteristics. Demographic variables collected in this study were based on previous literature. Variables included in most studies were age,2,8,9 sex,2,8-10,20 SES/parents’ education/meal price status,2,10,18,20 and ethnicity.2,10 In this study, sex and parents’ SES were collected at 7th grade. These factors have been shown to be associated with children’s academic performance.21,22 SES was assessed by parents’ occupation and education based on Hollingshead’s ‘‘Two Factor Index of Social Position,’’ modified to fit Taiwanese society by Lin.23 Parents’ occupation and education were both divided into 5 levels and scored from 5 to 1. The SES score was obtained with occupational score × 7 + educational score × 4.24 Scores were then grouped into tertiles (low, moderate, and high). The child’s age was not considered since all participants were 7th graders in 2008-2009 school year and 9th graders in 2010-2011 school year and grade in Taiwan is solely determined by birthdate. As for the ethnicity, the majority of junior high school students in Taiwan were Chinese (aborigines 2.9%, new immigrants 1.1%, and Chinese 96.0% during 2008-2009 school year; Department of Statistics, Taiwan Ministry of Education, www.edu.tw/statistics/). Thus, ‘‘ethnicity’’ was not included in the demographic variables. Statistical Analysis Descriptive statistics. Variable means and percentages were calculated for sex and academic performance at 7th grade. The differences were tested using χ 2 , t test, or analysis of variance (ANOVA). Univariate and multivariate linear regressions. To estimate the relationship between change in fitness levels and academic performance, univariate and multivariate linear regressions were conducted. The dependent variable was academic performance at 9th grade. The independent variables, recorded as dummy variables, were changes of fitness levels and weight status (2 waves: 7th and 9th grade data) controlling for sex and SES. Variables showing significant relationships with academic performance in the univariate model were then entered into a multivariate model simultaneously. The above analyses were performed with SPSS 16.0 for Windows (IBM, Armonk, NY). LGC analysis. LGC, a powerful technique for longitudinal analyses, can reduce error by estimating growth parameters and their effects in one model.25 It permits straightforward examination of individual Journal of School Health
•
change over time and variability in intraindividual change.26 A model of the LGC is a 2-stage process. The first stage is viewed as a ‘‘within-person’’ model (level 1 or called a measurement model) representing individual change over time. This level modeling intraindividual change comprises 2 growth parameters: (1) an intercept parameter representing an individual’s score on the variable of interest at time 1; (2) a slope parameter reflecting the individual’s rate of change over time. Second, the level 2 model is regarded as a ‘‘between-person model’’ (or called a structural model) estimating inter-individual differences in change. This level is limited to the regression paths linking the constant to the intercept and slope factors and their related residuals.14,15,27 Chisquare test statistics, the normed fit index (NFI > .95), the comparative fit index (CFI > .95), and the root mean square error of approximation (RMSEA 3) or kurtosis (>8).28 The analyses were conducted using EQS 6.1 with fullinformation maximum likelihood estimation, which is suggested to be an optimal method for the treatment of missing data.29
September 2013, Vol. 83, No. 9
•
© 2013, American School Health Association • 633
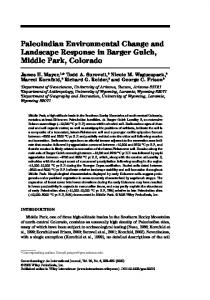
Figure 1. Latent Growth Model of CV Fitness and BMI on Academic Performance From 7th Grade to 9th Grade D1
E23
Gender
E3
Constant
Fitness_7 Fitness Intercept
E24
D5
Fitness_8 Fitness Slope
E25
Score_7
E54
Score_8
E55
Score Intercept
Fitness_9
D2
D3
E15
BMI_7 Score_9 BMI Intercept
E56
Score Slope D6
E16
BMI_8 BMI Slope
E17
BMI_9
D4
RESULTS
regression model showed no significant relationship between changes in flexibility and muscular strength and academic scores (p = .488 and .158, respectively). Sex, SES, weight status change, and CV fitness change were significantly associated with academic performance (p < .001,