Int. J. Environment and Pollution, Vol. 29, Nos. 1/2/3, 2007
Flare minimisation via dynamic simulation Amarnath Singh, Kuyen Li*, Helen H. Lou, J.R. Hopper, Hardik B. Golwala and Sandesh Ghumare Chemical Engineering Department, Lamar University, Beaumont, Texas 77710, USA E-mail:
[email protected] E-mail:
[email protected] E-mail:
[email protected] E-mail:
[email protected] E-mail:
[email protected] *Corresponding author
Thomas E. Kelly Equistar Chemicals, Houston, Texas, USA E-mail:
[email protected] Abstract: This paper describes a project of flare minimisation during plant startup by using dynamic simulation. Dynamic simulation was developed for recovery area in an olefin plant and used to examine startup procedures: • approaching shutdown • startup with recycle ethane • starting the cracked feed and increasing the feed to normal production rate. The dynamic simulation gives an insight into the process dynamic behaviour that is not apparent through the use of steady state simulation. This information is crucial for plant startup in order to minimise the flaring. This project demonstrated a feasibility of pollution prevention through flare minimisation for an olefin plant. Keywords: pollution prevention; emission reduction; flare minimisation; dynamic simulation. Reference to this paper should be made as follows: Singh, A., Li, K., Lou, H.H., Hopper, J.R., Golwala, H.B., Ghumare, S. and Kelly, T.E. (2007) ‘Flare minimisation via dynamic simulation’, Int. J. Environment and Pollution, Vol. 29, Nos. 1/2/3, pp.19–29. Biographical notes: Amarnath Singh received his BTech from Anna University, India, in 1986, MS from the University of Toledo, Ohio, in 1988, and D.E. Lamar University, Texas, in 2004. All his degrees are in Chemical Engineering. He is currently a Process Technology Engineer at GE Plastics, Mt. Vernon, Indiana. Kuyen Li joined Lamar Chemical Engineering Department in 1978 after four years industrial working experiences. He received his BS and MS from Cheng Kung University, Taiwan, in 1968 and 1970, respectively, PhD from Mississippi State University in 1977, all in Chemical Engineering.
Copyright © 2007 Inderscience Enterprises Ltd.
19
20
A. Singh et al. Helen H. Lou received her BS Degree from Zhejiang University in 1993, MS and PhD Degrees from Wayne State University in 1998 and 2001, respectively, all in Chemical Engineering, and a MA Degree in Computer Science from Wayne State University in 2001. She is currently an Associate Professor in Department of Chemical Engineering, Lamar University. Her research has been mainly focused on process synthesis, design, modelling, control and optimisation. J.R. Hopper joined Lamar Chemical Engineering Department in 1969 after five years experiences in oil industry. He received his BS from Texas A&M University in 1959, M.Ch.E. from the University of Delaware in 1964, and PhD from Louisiana State University in 1969, all in Chemical Engineering. Hardik B. Golwala received his BE from South Gujarat University, India in 2001 and MES from Lamar University in 2004, all in Chemical Engineering. He is working with Oiltanking, Beaumont, Texas as an Environmental Coordinator. Sandesh Ghumare received his BS from Dr. B.A. Technological University, India in 2000 and MES from Lamar University, Texas in 2004, all in Chemical Engineering. He had finished an internship with Texas Commission on Environmental Quality in 2004. Thomas E. Kelly worked as a Process Control Engineer for Equistar Chemicals at Houston, Texas.
1
Introduction
Flaring is a vital part of the chemical process. The flare in a chemical plant serves an important function which protects the operator, the owner, the process plant and the environment. Many processes would not be possible without flaring. However, excessive flaring causes environmental and social negative impacts and also results in a tremendous economic loss (Pohl et al., 1986; Li et al., 2003). Flare minimisation is crucial to environment, economics and safety issues. Current practice of flare minimisation in Chemical Process Industry (CPI) is not standardised. This is due to the fact that each plant has different processes and operating procedures. The guidelines dealing with the basic flare burner design, issued by EPA (1985), are a set of standards that the Refinery, Chemical and Petrochemical industry have to adhere to. These guidelines give limits for the heat capacity, the tip velocity, the pilot burner, and the steam/air injection to ensure that the efficiency of flaring is maintained above the recommended 98% hydrocarbon destruction. However, the best way to prevent emissions from the flare is to reduce the number of instances when the plant has to flare and also to reduce the quantity of the material to be flared. This is the fundamental solution for pollution prevention (Williamson and Dennehy, 2001). During a process upset or plant startup/shutdown, an off-specification (off-spec) product stream may be resulted. This off-spec stream may be sent for flaring if the problem could not be corrected promptly. The best way to avoid this is to use a dynamic simulation to critically check the startup operating procedures before the plant startup. The startup operating procedures are the steps taken by the plant operating personnel to
Flare minimisation via dynamic simulation
21
start up a plant from shutdown situation. Each of these steps involves the manipulation of the process plant through the extensive control system (Doe and Coppard, 2001). In absence of foresight, many plants are using engineering trial-and-error to modify operating procedures to gain expensive and maybe painful experiences for the flare minimisation. Under the pressure of environmental regulations, flare minimisation in a chemical plant is required and has been the objective of many studies to achieve ‘Zero’ flaring. Common practices of flare minimisation in an ethylene plant include: recycling the off-spec streams, start up with fewer furnaces, total reflux of C2 fractionator, and precharging the fractionator with pure ethylene among other methods which are plant/site specific. This project was initiated to find a methodology to reduce emissions from CPI, especially during plant startup/shutdown and process upset. The focus of this study was on ethylene plant because the ethylene is a major High Reactive VOC (HRVOC) which causes ozone pollution in heavy industry area such as Houston (TexAQS, 2000, 2001). The Lamar project team worked together with Equistar Chemicals, a major ethylene producer in Southeast Texas. In this project a dynamic process simulation was set up, validated, and used to critically examine the potential process and procedure modifications in order to minimise flaring during plant startup/shutdown. The process simulation is based on first principles and therefore the methodology developed in this project is applicable in general and is not limited to one particular plant or process. The process simulation is a cost-effective approach for identifying pollution prevention opportunities. The benefits from this project are not only for environment and society (less flaring and ozone spikes) but also for the economics and sustainability (save raw material and energy) of the CPI.
2
Process description
The OP1 plant of the Channelview complex of Equistar Chemicals was used for the flare minimisation study through dynamic simulation. Specifically, the recovery section of the ethylene plant was selected for dynamic simulation. This section mainly includes the Deethanizer, Depropanizer, Acetylene converter and the C2 Splitter. The feedstock is sent to the cracking furnace. The effluent from the furnace is forwarded to the Quench Tower. In the Quench Tower, the cracked gas is cooled and partially condensed. Quench Tower overhead vapour is sent to Charge Gas Compression section. Charge gas from the final stage compression is dried prior to the Chilling section. Hydrogen extracted in the Chilling section is recovered. The charge gas is then fed to the Fractionation section, which consists of Demethanizer, Deethanizer and Ethylene Fractionator. In the Demethanizer, methane is separated from the charge gas mixture as overhead vapour and sent to the fuel gas system. The bottom consisting the mixture of ethylene, ethane, propane, and heavier hydrocarbons is then sent to the recovery section. There are three feed streams to the Deethanizer. The lowest feed point is the precut Demethanizer bottom; the other two feeds to the Deethanizer come from the Demethanizer bottoms, split into two streams one on pressure control and another one on temperature control. Deethanizer tower performs a split of C2 and C3+ (C3 and heavier hydrocarbons). C2’s are the overhead product while C3+s’ go out of the bottom of the Deethanizer tower.
22
A. Singh et al.
The C3+s leave the bottoms of the Deethanizer and are fed to the Depropanizer, which separates C3’s and C4’s. C3’s and lighter are removed overhead while C4’s and heavier are taken off at the bottom. The three feed streams feeding the Depropanizer are Condensate Stripper bottoms stream, Deethanizer bottoms stream and a recycle stream from the propylene Green Oil tower bottoms. The Deethanizer overhead product contains a small amount of acetylene, which must be eliminated from the ethylene product to meet product specifications. This acetylene is removed by hydrogenation to ethane in the Acetylene Converters. The separation of ethane and ethylene as well as final purification of the ethylene product is accomplished in the Ethylene Fractionator. A large number of trays is necessary because of the close boiling points of ethane and ethylene. The condensed overhead vapours are routed to the Ethylene Fractionator Reflux Drum and then are pumped back onto the tower by the Ethylene Fractionator Reflux Pumps. The Product Drum/Methane Stripper is located at the top and ethylene enters at the top and flows down through the packed section, where it contacts vapour generated by its two reboilers. The bottoms of the drum go to the product pipeline. Non-condensables, methane and hydrogen, remaining in the Reflux Drum are recycled.
3
Steady state simulation
The steady state simulation available in the plant was used as a starting point for developing the dynamic simulation. This simulation model, using Aspen Tech’s ‘Aspen Engineering Suite 10.2’, simulated only the recovery and purification section of the Ethylene plant. There are around 50 streams and 14 blocks in the flow sheet. The total number of components in the simulation was reduced to 16 to improve the speed of the dynamic simulation. The property method used is RKS-BM (Redlich-Kwong-Soave cubic equation of state with Boston-Mathias alpha function). It is the recommended property method for gas processing, refinery, and petrochemical applications (Aspen Physical Property System, 2003). The steady state simulation results were checked and found in good agreement with plant operation data of Deethanizer, C2 Splitter, and Depropanizer. The dynamic manipulation of certain critical streams was also not possible as these were predefined and determined in the steady state simulation. The problems were overcome by modification of the steady state simulation. For an example, the C2 Splitter and vent recovery unit was initially modelled as a single column with side draw product in the steady state simulation. This unit was converted back to two columns to permit the product stream to be manipulated in the dynamic simulation. After modifications to the flow sheet were completed the results of the steady state simulations were compared and it was confirmed that the modification did not affect the simulation results. Finally the steady state simulation model was ready to be converted to the dynamic model. Additional process equipment data, such as the liquid hold-up, vessel geometry and orientation were taken from the P&ID (Process and Instrument Diagram) and equipment drawings.
Flare minimisation via dynamic simulation
4
23
Dynamic simulation
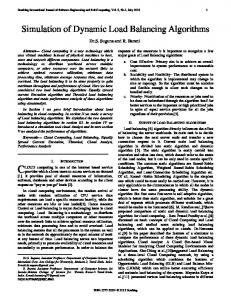
The steady state simulation model was exported as flow driven dynamic simulation file. The dynamic simulation was initialised and the operation of the simulation model was checked. This was done for the stability check and to confirm that the steady state simulation results hold. The controllers are then placed and the controller parameters are set. Placing the controllers at proper locations and input its correct parameters are the most important tasks in this dynamic model (Aspen Plus and Aspen Dynamics 11.1 User Guide, 2003). Process flow diagram with the control scheme is shown in Figure 1. Figure 1
5
Process flow diagram for the recovery area of ethylene plant
Control mechanism used in dynamic simulation
Based on the process description and control loops, the Proportional, Integral, and Derivative (PID) control scheme of each tower was implemented in the dynamic simulation. The tuning parameters of the actual controllers were taken from the Distributed Control System (DCS) input specifications of the plant. For the Deethanizer tower, pressure and temperature in the condenser are controlled at their required set points by the respective controllers with mass flow rate and heat duty being the manipulated variables. A reverse acting flow controller maintains the reflux flow. The set points are decided on the basis of process control information. Two level controllers are required to maintain the levels of liquids in the condenser as well as reboiler and mass flow rate is varied in both cases. A critical controller for Deethanizer is the temperature control of the control tray. In case of Depropanizer the pressure and temperature in the condenser, the reflux flow, and the levels of liquids in condenser and reboiler are maintained in a similar controller mechanism at their required set points.
24
A. Singh et al.
For the C2 Splitter, four level controllers help to maintain the levels of liquid in the condenser and reboiler for both columns (C2 splitter and vent recovery unit). Two pressure controllers maintain the pressure for the column condensers with a flow controller maintaining the reflux flow. The critical controller for this column is the ratio controller, which analyses the mole fraction of the vapour of ethylene vs. ethane on that tray. Heat duty of the reboiler can be varied to maintain the designed set point so as to obtain the desired product quality. After all the correct parameters of controllers were typed in, the dynamic simulation was allowed to run for some specific period to study the dynamic behaviour of all the streams with respect to time during plant startup/shutdown procedures. The results obtained in the graphical form were presented. Finally the recycle streams of C2 and C3 rich components are added to the flow sheet.
6
Simulation runs
The dynamic simulation runs for the recovery section of the ethylene plant are grouped into three groups. Changes can be made to: •
feed rate
•
controller set points
•
reflux flow rate
•
product composition specifications
to observe the resulting changes in stream flow, pressure and temperature in the dynamic model. The temperature and pressure profile of the columns can also be examined. The three phases of simulation run studied for the startup/shutdown procedure are: •
‘shut down’ of the process to reach startup condition
•
start-up with recycle ethane
•
startup of the cracked feed from the furnace.
In each of the following three runs, we are looking for operation condition that will give a stable startup. Under this stable startup condition, the flaring could be minimised.
6.1 ‘Shut down’ of the process to reach startup condition To begin, the ethylene recycle stream and the propylene recycle stream are added to the Deethanizer column feed. The first task in dynamic simulation was to reduce the feed flow rates gradually to 40% of the rated flow. The flow rates for both feed streams were reduced continuously, while the feed flow rate to the Depropanizer was reduced to zero. The process conditions are observed and controller set points changed to maintain control of the process based on the control parameters specified for this operation. The start-up condition is defined as the input flow rates of pure ethylene and polymer grade propylene from storage tanks to the Deethanizer and recycled after passing through all the columns. At the end of this stage both the feed streams to the Deethanizer are reduced to zero with the ethylene and propylene recycle streams ramped up gradually to
Flare minimisation via dynamic simulation
25
operating levels (40% of rated capacity). The tower temperature profile corresponds well to the composition of the feed and the specifications of the products. As many of the components are not available in the feed during this step, the temperature profile reflects the available components, as shown in Figure 2. Figure 2(a) is the temperature profile in the Deethanizer with an old temperature control setting at 144°F. This temperature profile indicates an unstable product stream from the top of the Deethanizer. Figure 2
The temperature profiles of the Deethanizer (a) before and (b) after changing the control tray temperature
(a)
(b)
The model simulation found that when the temperature control setting was reduced from 144°F to 135°F, the Deethanizer tower could be run in a much more stable condition, as may be seen from Figure 2(b). This has an effect of improving the column stability, and reducing reboiler and condenser load. This means that the process conditions at the top and bottom product streams of the Deethanizer are not easily affected by disturbance in the feed.
6.2 Start-up with recycle ethane Startup conditions as mentioned in the above section are used as the starting point for the simulation to proceed with the next phase. This phase was incorporated to have the columns of the recovery section running and stabilized with pure ethane before furnace cracking could be started. To do this the plant procedure states that the recovery section and the compression section are in ready to start with flow established by circulating ethane. The ethane feed is started through the whole system. In the recovery section ethane feed is seen first in the Deethanizer. The ethane feed is increased from zero up to 71,000 lb/hr. The dynamic response of the flow, temperature and pressure conditions of the product stream shows the response of the process in the simulation as indicated in Figure 3.
26 Figure 3
A. Singh et al. The dynamic response of the process streams (a) 436 (Deethanizer top) and (b) 434 (final product), after recycle ethane is started
(a)
(b)
The stream composition change from pure ethylene feed to about 50 : 50 mixture of ethylene and ethane within an hour, as shown in Figure 4(b), at the top of the Deethanizer. Figure 4
(a) The temperature profiles of the Deethanizer at the end of this phase and (b) the composition of ethylene and ethane in top product stream of Deethanizer
(a)
(b)
As may be seen from Figure 4(a), the Deethanizer top tray temperature changes from –2°F (shown in Figure 2(b)) to 12°F to reflect the composition change of the feed to the tower.
6.3 Startup of the cracked feed from the furnace The plant is now ready for starting the furnace in phase 3. This is simulated by starting the cracked feed through the Deethanizer. The responses of the three towers are observed and control changes are made to keep the process in the control range. The top composition Deethanizer changes from 50 : 50 to about 90 : 10 of ethylene to ethane ratio (shown in Figure 6(a)) as more ethylene enters through the cracked feed. The column top temperature controller set point has to be changed from 12°F (Figure 5(a)) to –2°F again
Flare minimisation via dynamic simulation
27
to maintain the process control (Figure 5(b)). In this phase, the top composition of Deethanizer tower changes from 50 : 50 to about 90 : 10 of ethylene to ethane ratio (Figure 6(a)). The behaviour of ethylene product stream is given in Figure 6(b). Figure 5
The Deethanizer tower profile (a) before and (b) after changing the temperature
(a) Figure 6
(b)
(a) Composition of ethylene and ethane in top product stream of Deethanizer and (b) The trends of the process streams 434 (final product)
(a)
(b)
All the tasks during shutdown-startup of the ethylene plant are performed using dynamic simulation model and results obtained are checked with the previous data available and plant personnel to confirm the reliability of the model. This model approved by industry people has diverse applications spanning design, operations and training. Dynamic simulation runs performed on the basis of process flow scheme, equipment data and instrument data, after proper analysis, give good result and provide practical improvements like recycling the streams, change in control mechanisms to help reduce the flare loads particularly during startup-shutdown and upset conditions. With the help of dynamic simulation, a situation that leads to flaring of off-spec stream could be avoided. The operator can take proper actions or set proper control setting according to the suggestions from dynamic simulation. Without dynamic simulation, a decision in such cases can only come from experience or trial-and-error.
28
A. Singh et al.
The response time for stabilisation of different column levels is different with the C2 Splitter column level taking the longest time, about 15 hours. This information helps the operating staff understand the time and response that is expected during actual plant start-up. The temperature profile changes with the change in feed composition. The movement of the profile will provide important decisions on the temperature control setting and control strategies to be adopted. The heat duty and the condenser duty, the reflux flow rate or the composition of any stream can be checked and analysed. The foresight of the dynamic behaviour and the proactive control action will minimise flaring events and provide smoother plant startup.
7
Outcome
The actual flaring associated with shutdown and startup of the ethylene plant OP1 was considerably reduced by 75% over the earlier startup of a similar plant at that site. This was possible by changing the procedure and installations of deinventory piping, installed prior to shutdown. The flaring from shutdown and startup were less by 56% from the estimates made before the turnaround.
8
Conclusions
The dynamic simulation of the ethylene recovery section is an important tool to test the startup/shutdown operation procedures. The dynamic simulation gives an insight into the process behaviour that is not apparent through steady state simulation and process engineering calculation. The process simulation is a cost-effective approach for identifying pollution prevention opportunities. The benefits from this project are not only for environment and society (less flaring and ozone spikes) but also for the economics and sustainability (saves raw material and energy) of the CPI.
Acknowledgement The authors from Lamar University appreciate the grant support and research opportunity provided by Lyondell-Equistar Chemicals. Partial support from (TARC) Texas Air Research Center and EPA Region 6 is appreciated.
References Aspen Physical Property System (2003) Physical Property methods and models 11.1. Aspen Plus and Aspen DynamicsTM 11.1 User Guide (2003) http://www.aspentech.com/ publication_files/Applications_of_Dynamic_Simulation.pdf. Doe, K. and Coppard, D. (2001) ‘Process simulation and ethylene cracker for operation training’, Proceedings of the 13th Ethylene Producers Conference, Houston, Texas, April 23–26, pp.656–671.
Flare minimisation via dynamic simulation
29
EPA (1985) ‘Evaluation of the efficiency of industrial flares: flare head design and gas composition’, EPA-600/2-85-106, September. Li, K., Singh, A., Heinlein, H., Shah, T., Zhou, L. and Lou, H. (2003) ‘Applications of an IT tool, OMS, on real-time emission inventory’, 12th Annual Emission Inventory Conference: Emission Inventories – Applying New Technologies, San Diego. Pohl, J., Lee, J. and Payne, R. (1986) ‘Combustion efficiency of flares’, Combustion Science and Technology, Vol. 50, pp.217–231. Texas 2000 Air Quality Study (TexAQS 2000) Workshop (2001) Texas Natural Resource Conservation Commission (TNRCC), University of Texas, Pickle Research Center, August 7–10. Williamson, M. and Dennehy, J. (2001) ‘Procedural changes to minimize flaring during ethylene plant start-ups and shutdowns’, Proceedings of the 13th Ethylene Producers Conference, Houston, Texas, April 23–26, pp.295–321.