FLAT2D: Fast Localization from Approximate Transformation into 2D Robert Goeddel1 , Carl Kershaw1 , Jacopo Serafin2 , and Edwin Olson1
Abstract— Many autonomous vehicles require precise localization into a prior map in order to support planning and to leverage semantic information within those maps (e.g. that the right lane is a turn-only lane.) A popular approach in automotive systems is to use infrared intensity maps of the ground surface to localize, making them susceptible to failures when the surface is obscured by snow or when the road is repainted. An emerging alternative is to localize based on the 3D structure around the vehicle; these methods are robust to these types of changes, but the maps are costly both in terms of storage and the computational cost of matching. In this paper, we propose a fast method for localizing based on 3D structure around the vehicle using a 2D representation. This representation retains many of the advantages of “full” matching in 3D, but comes with dramatically lower space and computational requirements. We also introduce a variation of Graph-SLAM tailored to support localization, allowing us to make use of graph-based error-recovery techniques in our localization estimate. Finally, we present real-world localization results for both an indoor mobile robotic platform and an autonomous golf cart, demonstrating that autonomous vehicles do not need full 3D matching to accurately localize in the environment.
I. I NTRODUCTION Many autonomous vehicles require fast and accurate localization estimates to safely plan and navigate through the environment. Even a 0.5 m lateral position error can be serious for a lane keeping application. Consumer grade GPS is insufficiently accurate to support these needs, which has resulted in the development of algorithms based on data from LIDAR and cameras. 3D LIDAR has proven particularly popular on state-ofthe-art autonomous vehicles due to its accuracy and ability to produce fast, 360◦ FOV information about the surrounding environment. Additionally, 3D LIDAR sensors are more robust to occlusion than their 2D counterparts. However, the data from these sensors can be challenging to use in localization applications. The dense 3D prior maps necessary to support 3D matching operations take up large amounts of storage space, making it impractical to locally store full 3D maps of large geographic regions. Indeed, it can take hundreds of MBs of storage for even a small urban region. On the other hand, systems cannot tolerate the risks incurred by fetching data on-demand from a remote source. Assuming the storage challenges have been overcome, alignment and localization in 6DOF still present challenges. 1 Robert are with gineering,
Goeddel, Carl Kershaw, and Edwin Olson the Department of Computer Science and EnThe University of Michigan, Ann Arbor, MI
{rgoeddel,ckershaw,ebolson}@umich.edu 2 Jacopo Serafin is with the Department of Computer Science, Sapienza University of Rome, Rome, Italy
[email protected]
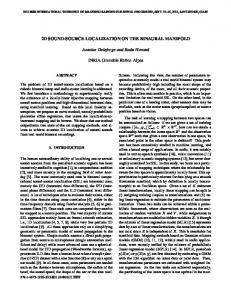
(a) Scene w/ Ramps
(b) 2D Map
Fig. 1: An example map for a scene containing (left to right) a 16◦ , 14.5◦ , and 10◦ ramp. Black denotes scan matching structure, red navigational hazard, light gray unknown, and white observed free space. The slope cutoff for hazards is 15◦ . Due to noise, the 14.5◦ ramp is intermittently marked as a hazard.
Traditional 3D alignment algorithms like Iterative Closest Point (ICP) have poor convergence properties and require good initial registration to produce high quality alignments. Non-uniformity in 3D LIDAR data can exacerbate convergence issues. 2D LIDAR sensors are often used in indoor robotic applications, resulting in prior map representations are compact and efficient to match against. However, the planar nature of these sensors makes them susceptible to errors due to occlusion by transient obstacles, or complete failure to observe off-plane hazards. Thus, it is desirable to find a way to use rich, robust 3D LIDAR information as efficiently as we use the existing 2D data. Unlike a 6DOF ICP approach, our proposed system determines only three degrees-of-freedom of the robot: x, y, and θ. However, roll and pitch can be easily extracted from a low-cost accelerometer, and reasonably accurate z estimates (if needed by an application at all) can be encoded in the prior map, since we can safely assume the car stays on the ground. Our approach is based on 2D scan matching against vertical structure extracted from a 3D point cloud. The verticality constraint ensures crisp, easily matchable scans that produce precise localization results. The structure of the Velodyne VPL-16 and HDL-32E sensors (namely: spinning, vertical fans of laser diodes) make them particularly well suited for the rapid identification of such structure. Switching to a 2D representation significantly reduces map storage needs. Particle filters are often used for localization systems using prior maps. In this paper, we propose an alternative based on the GraphSLAM formulation, allowing us to leverage
recovery methods such as max mixtures [1] or switchable constraints [2]. The advantages include immunity from particle depletion and produce higher precision solutions. In this paper, we demonstrate that 2D localization systems can enable effective operation of autonomous vehicles. In particular, we introduce: • A fast, slope-based algorithm for creating compact, 2D structure maps suited for scan matching based on 3D Velodyne LIDAR data; • An implementation of 2D localization based on GraphSLAM, allowing us to incorporate state-of-the-art outlier rejection techniques; • Results from a real-world 2D localization system deployed on an autonomous golf cart as well as a midsized mobile robot designed for indoor/outdoor reconnaissance, demonstrating that our 2D method accurately localizes both systems with greatly reduced storage needs compared to a full 3D system. II. R ELATED W ORK A. LIDAR-Based Localization The notion of using 2D matching methods for 3D tasks is not new. Thrun et al. demonstrated a 3D map-building system based around 2D scan-matching [3]. A full 3D polygon map is constructed based on data from a separate, upwards facing sensor. The 3D representation is kept sparse by eliminating overly similar polygons. However, this system only uses a planar LIDAR for scan matching purposes, missing potentially useful off-plane features. Nobili et al. directly compared the performance of a 2D SLAM system based on both planar and 3D LIDAR [4]. They conlude that, while the planar configuration resulted in slightly more accurate localization, the maps built with a VLP-16 were more robust to environmental changes. Accurate registration of 3D data is a significant challenge for 3D methods. In the 2D domain, Olson, Diosi, and Kleeman, among others, have demonstrated methods for fast and accurate registration of scans [5], [6]. However, in 3D spaces, most applications employ some variation of ICP [7]. ICP can work well with dense data, but is ill suited for matching between scans consisting of non-uniform rings of data, as in the case of Velodyne sensors. Variations such as Serafin and Grisetti’s Normal Iterative Closest Point (NICP) improve the convergence properties, but are still designed with dense data in mind, such as that from an RGB-D sensor [8]. Nonetheless, some 3D SLAM variants based on 3D LIDAR exist. Moosmann and Stiller introduced a SLAM method specifically targeting the Velodyne HDL-64E [9]. Transformations between scans are resolved using ICP. The authors modify the nearest-neighbor data association search to also take into account the normals at each point, making their search more robust to errors. Wolcott and Eustice demonstrated a method for localization based on a prior 3D ground map, exploiting intensity information to match this model against data from a inexpensive monocular camera [10]. By focusing on ground-only
matching, it eliminates some of the need to store a dense 3D prior. This method performs comparably to purely LIDARbased methods. However, it has difficulty with occlusions due to dynamic obstacles and weather conditions (i.e. snow or puddles). To address these issues, Wolcott and Eustice employed a 2D approach similar to the one presented in this work. Dense 3D data is compressed into a 2D grid, where each cell contains a Gaussian mixture map summarizing the vertical structure [11]. This greatly reduces the storage needs for prior maps. They extend Olson’s multiresolution scan matcher [6] to handle mixture map representations, yielding scan matches for 20 cm resolution maps at 3-4 Hz. Our results in this work suggest that an even simpler, more compact representation of structure may be sufficient for localization needs. B. Camera-Based Localization Another class of 3D localization methods focuses on extracting high level features rather than aligning the full scans. For example, Cummins and Newman presented FABMAP, an appearance-based SLAM system [12]. FAB-MAP recognizes previously visited places based on a visual vocabulary, even in the presence of varying visual conditions. However, the system is better suited to identifying large-scale loop closures, rather than precisely localizing the vehicle within the environment. Sattler et. al demonstrated a method for registering images to a database of 3D point models [13]. The authors find correspondences between an image and model by comparing SIFT descriptors extracted from each. At this point, RANSAC may be used to estimate the camera pose. The method, however, is only sufficient for registering pose within several meters and still depends on dense 3D priors. C. Extracting 2D Map Information From 3D Data Korah et al. introduced the Strip Histogram Grid (SHG), a polar variation of voxel grid methods created to aid recognition of structure in the environment [14]. The SHG is able to encode information over a larger reason than traditional voxel-based representations, enabling the identification of vertical structure over larger regions. The authors demonstrate its application to 3D scene segmentation for dense representations of urban scenes. Morton and Olson presented the HLD classifier for identifying terrain based on 3D LIDAR data [15]. The classifier handles both positive and negative obstacles by classifying cells based on height, slope, and data density. Additionally, it propagates this information through the map to fill in unobserved regions. This method is tailored for obstacle detections needed by navigation systems, though it can be tuned for localization. However, the message-passing portion of the algorithm is expensive, limiting its applicability to high-speed environments. Stanford’s DARPA Grand Challenge Team extracted obstacle information from Velodyne data by comparing the distance between the concentric rings generated by each
laser during a complete sweep of the sensor [16]. As the terrain changes, the rings compress. By comparing measured distance between beams to expected distance, very small obstacles (on the scale of a curb) can be reliably detected. In this paper, we propose a structure classification strategy based on a similar principle of observing differences between rings of the scan, but explicitly classifying based on the slope between consecutive points in a vertical slice of returns. III. E XTRACTING S TRUCTURE FROM 3D P OINTS In several of the works described above, 3D LIDAR data is converted into 2D representations for use in localization or navigation. Most systems have need of both of these capabilities, but the type of structure extracted from the 3D point data differs greatly depending on the task at hand. Navigation must identify all hazardous structure, including plants, curbs, and other vehicles. However, the performance of SLAM and localization systems can be negatively affected by an overabundance of structure to match. If “fuzzy,” unreliably observable structures such as long grass, a bush, or even a sloped wall are presented to a scan matcher, the variation between scans can result in bad alignments and poor pose estimates. This section introduces a pair of methods for extracting high-quality 2D structure maps to be used primarily in localization. The first is an improvement over a baseline strategy based on counting the number of points falling into a 2D bin. The second exploits structure in Velodyne sensors, classifying structure based on its estimated verticality. A. A Baseline Method for 2D Structure Extraction Many commonly applied 2D structure extraction methods are built around a quantization of the world in XY space [4]. In the simplest case, range returns falling within a specified z-height band relative to the ground are projected down into this grid and marked as obstacles. This works well for hazard estimation, but is very susceptible to noise. Alternatively, one can partition the world into voxels, only marking structure on a 2D summary map where the number of occupied voxels in a vertical line exceeds the specified threshold. This ensures a certain level of “verticality” (i.e. repeatability) in the detected structure. One weakness of these methods is their inability to deal with negative obstacles. Negative obstacles may generate no or very distant range returns, causing them to not appear in the map at all. Issues also arise from quantization errors due to noise. B. Compact Voxel Popcount We propose a novel voxel representation that is compact, fast, and adaptive to local terrain height. Each XY grid cell stores a floating point minimum z-height and a 64-bit integer. Each bit of this integer corresponds to a fixed-size band of vertical range. Most systems are only concerned with potential obstacles within a relatively limited z-range around the ground; the minimum z-height parameter allows us to focus on a particular region of interest (i.e. 20 cm to
(a)
(b)
Fig. 2: An 8-bit example of our compact, bit-based voxel representation. Bits in an integer correspond to bands of z-height. Bits are set to 1 when LIDAR points fall into their band, with the 0th bit corresponding to the band containing the lowest observed height for that XY bin, as in (a). If new observations fall below a bin’s current z-min, previous measurements are bit-shifted to efficiently make room for the new observations (b).
(a) No Fill-In
(b) 25 cm Fill-In
(c) 50 cm Fill-In
Fig. 3: By applying a hole fill-in algorithm during 3D data processing, we densify the resulting 2D map data, facilitating later scan matching. Larger amounts of fill in greatly increase effective data density, but can negatively affect the system’s ability to represent certain fine-detail structures (e.g. a picket fence).
200 cm). When a LIDAR point is received that is lower than the minimum z-height, the XY cell can be updated using a simple bit shift. An 8-bit example can be seen in Fig. 2. In this formulation, the identification of vertical structure can be performed with a POPCOUNT operation on the integer: if the number of bits set to 1 exceeds a threshold, the cell passes a verticality test and is marked as structure. Additionally, we may efficiently isolate smaller vertical bands of data with bitwise-AND: for example isolating obstacles the same height as the vehicle. Our representation may be further improved by working in polar coordinates. Most 3D LIDAR sensors operate by rotating a vertical fan of lasers, resulting in an obvious relationship between the data and a polar coordinate frame. By binning in polar coordinates, we avoid costly projection into Cartesian coordinates. Similarly, quantization error now only occurs in the range dimension, rather than in both X and Y. The SHG is another instance of a polar binning method [14]. C. Slope-based, Multi-Class Structure Detection We propose a second novel extension to 2D structure representation, namely, to represent multiple classes of structure in one map. In our applications, we find that it is helpful to distinguish between hazard, an obstacle to navigation, and slammable structure, i.e. vertical structure that we can reliably scan match against. In this way, we may support
most commonly performed in Cartesian coordinate frames, so we choose to produce our 2D structure maps in Cartesian coordinates, as well. Operating on this unified map saves computation, as it eliminates the need to produce separate maps for each task. This method still experiences challenges with negative obstacles due to frequent lack of direct observability. In cases where drop offs are observable, the slope-based classification strategy will correctly identify dangerous drop offs, but otherwise will fail to mark a hazard. Fig. 4: A successful scan match in an indoor environment. In this example, we match observations from the current pose (yellow) against those from the prior map (teal). The red triangle denotes the historic pose closest to our prior estimate of the robot’s current global pose.
navigation systems and localizations systems with the same data stream without adversely affecting the performance of either. The fan-like structure Velodyne HDL-32E and VPL-16 sensors lends itself well to the extraction of slope information between points. Even small obstacles appear as noticeable jumps in slope, making them easy to detect. In contrast to the previous method, which looks for vertical continuity in a single cell, this method can also detect hazards that span multiple cells, such as steeply sloped ground. A multi-class representation of structure emerges naturally from this formulation: structure exceeding some minimum slope should be marked as hazardous to navigation, while structure exceeding an additional slope threshold should be upgraded to slammable structure. This is appealing, as hazards may be marked based on the capabilities of the particular system. In our indoor robot system, for example, we find that marking navigation hazards for slopes exceeding 15◦ and slammable structure at slopes exceeding 80◦ off the XY plane works well. We process a single, vertical fan of range returns from the bottom up, conservatively marking obstacles in an occupancy grid at the location of the return nearest to the robot. Additionally, we add a “dummy return” at (0, 0, 0), the position of the robot, to the scan, since we assume the robot to be on the ground at all times. Example results of a 2D map constructed from a single rotation of a Velodyne VPL-16 can be seen in Fig. 1. In our system, we find that sufficient performance is achieved by measuring the slope between 2 consecutive vertical measurements. However, particularly in applications where sensor noise is a concern, slopes may be fit across 3 or more points. This can have the effect of smoothing out smaller obstacles, causing them to disappear, but likewise can improve the robustness of “slammable” detection. Though this method could accumulate structure in a polar coordinate frame, the goal of marking mixed-classes of structure is to support navigation and localization simultaneously based on a unified 2D map. Navigation tasks are
D. Hole Fill-In Though Velodyne data is more dense rotationally than vertically (0.38◦ horizontal vs. 2◦ vertical spread between observations for a VPL-16 rotating at 20 Hz), at a distance of 15 m, points are already 10 cm apart. These holes in the data present challenges during scan matching, which relies on having sufficient data density to detect overlap in structure. To address this problem, we employ a straightforward technique for filling gaps in the data. For consecutive vertical slices, returns from each laser diode are considered in turn. If, in both slices, the returns were marked as the same class of structure, we fill in a line of the same class between the corresponding cells in our 2D map. This allows the scan matcher to make matches at longer ranges. To avoid filling structure where none exists, we only apply fill-in to range returns that are less than a specified distance apart. Example 2D mapping results before and after fill-in can be seen in Fig. 3. IV. SLAM AND L OCALIZATION We consider two coordinate systems in which the robot can operate: local and global. The robot’s local coordinates are determined by its open-loop odometry. The robot’s global coordinates are the actual position of the robot in the world, e.g. as defined by an existing global map. The goal of localization, then, is to compute a transformation L2G that can convert local coordinates into global coordinates. A robot may have one or more systems capable of generating L2G estimates, including but not limited to GPS and scan matching against a known map. We find it convenient to formulate the challenge of merging these estimates as a equivalent to solving a SLAM problem: each L2G estimator produces noisy observations in which we place a certain amount of confidence. Thus, we may find the Maximum Likelihood Estimate (MLE) L2G by minimizing the error among these separate estimates. A. SLAM-Graph Formulation Our SLAM system and our localization formulate GraphSLAM in distinct ways. The SLAM system creates robot pose nodes at fixed intervals of motion, linking them with relative factors from odometry, camera, and scan matching observations (detailed below). Likewise, global factors provided primary by GPS or human annotation can be added to the graph, though our system only uses these for initial registration of the map to satellite imagery. In conjunction
A. Hazard and Structure Detection
Scanmatch
GPS FIXED
Fig. 5: A simple example of a factor graph for localization. In addition to standard factors based on GPS or odometry measurements, scan matching factors are added describing transformations back to a known map (in red). During optimization, the portion of the graph corresponding to the known map is held fixed, allowing the localization graph to remain compact.
with the previously described 2D structure extraction methods, this allows us to construct globally-consistent maps of the environment. Our particular system poses localization in terms of factorgraph optimization, as well, where scan match results between the robot and known locations in the map result in factor potentials on the robot’s current position. An example instance of such a match can be seen in Fig. 4. Additional L2G factors can added based on GPS observations; these present in our system, but weighted considerably less than scan matching factors. Fig. 5 depicts a simple example of a resulting factor graph. This formulation the system to initialize the system’s prior based on GPS, switching to more precise scan matching once initialized. Solving the resulting graph yields the present and historic L2G systems for the robot. One advantage of formulating localization as a graph-solving problem is the ability to incorporate concepts like max mixture edges into solutions. Max mixture edges [1] allow the system to reject erroneous observations, for example, due to a bad scan match or bad GPS fix, preventing sudden, catastrophic shifts in the L2G estimate. Unfortunately, this formulation does not come without a cost. The longer the vehicle is in operation, the more nodes and factors accumulate in the graph, resulting in increasing memory consumption and slower solve times. To prevent excessive accumulation, we fix the maximum number of nodes in the graph. When new observations would result in this threshold being exceeded, the oldest observations are removed from the graph, allowing the localization system to operate in a fixed memory footprint and with stable solution times.
V. E XPERIMENTAL R ESULTS We deployed our mapping and localization systems on two platforms: the SmartCarts autonomous golf cart as well as our MAGIC 2.0 mapping robot. Both platforms were equipped with a 2.8 GHz Intel i7-4900MQ and 8 GB of RAM, with code written in C.
We validate our 2D structure classification on two scenes: one to demonstrate that our hazard detection threshold maps well to real-world sloped obstacles, and another to validate that we may classify a wide range of vertical structure, even in the presence of partial occlusion. To prove that our method is able to correctly distinguish between real-world navigation hazards, we created a scene containing ramps of slope 10, 14.5, and 16◦ , pictured in Fig. 1a. These angles were chosen to be near the hazard threshold of 15◦ . We expect the 10 and 14.5◦ ramp will be marked as safe, while the 16◦ ramp will be marked hazardous. The robot captured the scene from several meters away, viewing the ramps from their lower, ground-level ends. Our terrain classifier successfully marked the 10◦ ramp as drivable, and the 16◦ ramp as hazardous, as expected based on the threshold. Due to sensor noise, parts of the 14.5◦ ramp were marked as hazardous as well. This demonstrates that our hazard detection system is working correctly, but is not entirely robust to noise. We set up an additional scene to demonstrate that our method can preserve information about partially occluded structure, ensuring that useful scan matching features are not removed from the map. The scene consisted of several vertical structures ranging from 0.1 m to 1 m in height, spaced evenly apart in ascending order by height, pictured in Fig. 6a. The robot was placed to view this scene end on, such that the taller structures were partially obscured by the shorter structures. Five bands of structure are clearly visible in front of the robot in Fig. 6b. Only one band of LIDAR strikes fell on the smallest object, a 0.1 m tall box. As a result, its vertical face was not detected and it was only marked as hazardous, nonslammable structure. However, the rest of the structure was correctly identified as sufficiently vertical to be marked as slammable and accurately placed in the grid map. This shows that our algorithm can correctly identify and denote vertical structure in the environment for use in 2D scan matching. B. Map Compactness One advantage of 2D storage is the compactness of the map representation. Our occupancy grid implementation stores class labels for each cell using a single byte, with each cell corresponding to a 5×5 cm area in the world. A prior map produced by our SLAM system can be seen in Fig. 7. The map covers a region of size 74×85 m. For scan matching purposes, we employ a version of the map which preserves information about the structure visible from a series of viewpoints from a previous traversal. The resulting scan matching map has a memory footprint of under 4 MB. For comparison, storing the raw 3D range returns corresponding only the selected viewpoints requires 16.3 MB. Converting these returns to 3D points suitable for algorithms such as ICP causes the storage needs to expand to nearly 100 MB.
(a) Scene with Vertical Occluded Structure
(b) 2D Map
Fig. 6: 3D point cloud data allows the robot to observe partially occluded structure and incorporate it into its maps. In this scene, the robot observes obstacles of increasing heights, ranging from 10 cm to 1 m. Vertical structure is denoted in black, hazardous terrain in red, unknown in light gray, and observed free space in white. 120 100
Slope 70
°
Slope 80
°
Slope 85
°
Frequency
80 60 40 20
(a) Open-Loop Trajectory
(b) Corrected Trajectory
Fig. 7: Open-loop odometry during the traversal of the BBB Building at the University of Michigan (a) compared to a trajectory generated using our localization system (b). The robot’s openloop odometry drifts rapidly, but the localization system is able to reliably recover the robot’s true pose within the building.
0 0
0.01
0.02
0.03
0.04
0.05
Angular Error (rads)
Fig. 8: Frequency of angular errors in radians for localization based on varying thresholds of vertical structure classification. If set too high, insufficient quantities of structure are extracted to support reliable scan matching. If set too low, too much structure is detected to precisely constrain scan matching results.
C. Indoor Localization We tested our localization pipeline on our MAGIC 2.0 platform, a system designed for dual indoor/outdoor use. The MAGIC 2.0 robot was equipped with a MEMS grade gyro, wheel encoders, and a Velodyne VPL-16 mounted approximately 0.6 m above the ground. Additionally, we use a fiber-optic gyro (FOG) to acquire ground-truth orientation estimates over the scale of a single pass of the building. We generated a map of the 3rd floor our building and evaluated the localization system based on a log of a separate, handdriven traversal. Results for open loop pose vs. corrected global pose can be seen in Fig. 7. Even as the open-loop odometry drifts, the localization system is able to correct for these errors, keeping the robot in the middle of the hallways at all times. We numerically evaluate the impact of different parts of our system against results from the FOG ground-truth, which measures rotation about θ. By contrasting the FOG θ estimate against the global one produced by localization when employing different occupancy grid generation pipelines, we
identify the best combination of features to implement and the appropriate parameterizations. To quantify the quality of localization, we present distributions of theta error sampled at discrete time steps and binned by steps of 0.005 radians of angular error (roughly equivalent to a 0.25◦ ). 1) Slope Threshold: First, we examine the impact of various threshold settings for vertical structure detection in the slope based method. We expect overly high and low values to negatively impact scan matching results, resulting in lowquality localization. We tested localization for a traversal of our test environment with the structure threshold set to 70, 80, and 85◦ . The resulting distributions of observed angular errors can be seen in Fig. 8. We find that the middle threshold of 80◦ performs best. This is in line with our expectations. Maps constructed based on the 85◦ threshold mark vertical structure less frequently, likely due to sensor noise. The scan matcher, with less or insufficient structure to constrain its matches, produces low quality matches as a result. In contrast, the 70◦ threshold is
120
120 With Fill-In Without Fill-In Polar Coordinates
100
100 80
Frequency
80
Frequency
Our Method MEMs Odometry
60 40
60 40 20
20
0
0 0
0.01
0.02
0.03
0.04
0.05
Angular Error (rads)
Fig. 9: Frequency of angular errors in radians for localization based on a polar occupancy map, a Cartesian occupancy grid, and a Cartesian occupancy grid with fill-in applied. The polar map produces more large-scale deviation from truth than it’s Cartesian counterpart. However, the results for the Cartesian map are further improved by filling in the regions between vertical slices of observations, aiding the scan matching it achieving good alignments.
too permissive, marking non-vertical structure and sometimes dilating vertical structure. The scan matcher depends on crisp structure to acquire good matches, so this dilation hurts match (and thus localization) quality. 2) Slope vs. Polar Popcount: Next, we examine the impact of employing a compact, polar-coordinate-based popcount method vs. the slope method with and without fill-in. We expect fill-in to boost performance, as distant observations can be more effectively matched by the scan matcher. It is expected that the polar and Cartesian methods will otherwise perform similarly. Bin size parameters were tuned to offer the best-case performances for each method. For the slope method, grid resolution was set to 5 cm and the slammable threshold was set to 80◦ . Fill-in, when used, was performed for points within 25 cm of each other. The polar popcount method was set to have bins 0.01 rads (0.5◦ ) wide in θ and 5 cm in range. Structure was marked in bins with at least 2 bits marked. The resulting distribution of observed angular errors can be seen in Fig. 9. Fill-in has the expected impact on the slope-based method, shifting the distribution of error closer to 0. Unexpectedly, the polar popcount performs noticeably worse than both slope methods, exhibiting a large tail of errors in excess of 0.05 rad (2.8◦ ). We hypothesize that this is due to the bin size in the polar frame becoming more spread apart at large distances. The natural spread in bins negatively impacts scan matching, as long-range observations are smeared across wider and wider areas. This manifests as the larger angular errors seen in the results. 3) Slope Method vs. Open-Loop Odometry: Finally, we present a comparison between our best-performing method from the previous analysis and open-loop, MEMs odometry. Odometry-based estimates are initially aligned with the
0
0.05
0.1
0.15
0.2
Angular Error (rads) Fig. 10: Frequency of angular errors in radians for localization for open-loop odometry compared to our final localization system. The orientation estimate provided by a MEMs-grade gyro drifts over time, resulting in divergence from ground-truth of up to .155 rads (9◦ ). In contrast, our corrected pose estimates are within .02 rads (1.1◦ ) of truth 87% of the time.
global coordinate frame, but then allowed to drift naturally. The results can be seen in Fig. 10. The θ estimates produced based on the robot’s MEMs grade IMU drift significantly over the 10 min traversal of the building, accumulating a maximum error of nearly .155 rads (.9◦ ). Conversely, 2D scan matching based on slope-based structure maps is able to localize the robot within .02 rads (1.1◦ ) of ground-truth 87% of the time, .025 rads (1.4◦ ) 97% of the time, and in the worst case, deviates from ground truth by just under 0.045 rads (2.5◦ ). D. Computational Costs We present timing data for the indoor dataset to evaluate how frequently our localization system is able to update pose estimates. Our method can be broken up into three distinct stages: map building, scan matching, and graph solving. To ensure a recent, 360◦ view of the area surrounding the robot, we produce 2D scan matching maps after every revolution of the Velodyne. At the maximum rotation rate allowed by the hardware, a revolution is completed every 50 ms. We are able to process this data incrementally in real time, resulting in less than 1 ms of delay between the completion of a revolution and publication of a map. The resulting maps are consumed by a scan matching module, which in turn publishes its best estimate of the robot’s current pose in the global map. Scan matching time dominates the cost of our algorithm and varies greatly based on the quality of the initial pose estimate. The median time to acquire the best match is 140 ms, but times as low as 100 ms and as high as 180 ms are common. In the rare event that no good match is found, the search can take as long as 400 ms. Finally, the scan matching results are incorporated into a localization graph which solves for the current and historical robot poses. The graph is mostly sparse, resulting in a linear
growth in solve time. We find that solve time increases at a rate of roughly 1 ms per 100 historical poses in the graph. By limiting the size of the graph, we are able to keep solve times under 5 ms. Based on this timing information, our system was able to produce new L2G estimates at a rate of 5 Hz. E. Outdoor Localization We also tested our localization pipeline outdoors on our SmartCarts autonomous golf cart platform. Our vehicle was equipped with a FOG for yaw estimates, an encoder on the left-rear wheel, and a Velodyne HDL-32E for scan matching. We registered hand-annotated lanes against a SLAM map of the environment gathered prior to testing. The robot was then driven to a start location and tasked to drive autonomously between several waypoints in the road network. A comparison of open-loop vs. localization corrected pose can be seen for a portion of the trajectory in Fig. 11. Our open loop odometry slowly accumulates error, even with high-grade sensors like a FOG. Matching scans against a 2D structure map corrects for this error, though, keeping the SmartCart within its lanes throughout the test. VI. C ONCLUSION Recent advances in localization for autonomous vehicles rely on matching 3D structure in the environment, providing robustness to the effects of weather and road maintenance. However, the resulting maps are computationally costly to match against and have large storage requirements. In this paper, we present a localization system harnessing the rich structural data of 3D LIDAR sensors, but with the computational and storage efficiency of 2D methods. We introduce two methods for extracting 2D structural information from 3D LIDAR in support of 2D scan matching as well as a novel localization method based on GraphSLAM algorithms. We quantify the performance of these methods in a real-world system, evaluating predicted orientation estimates against high-quality estimates produced by a FOG. Our system consistently produces accurate position estimates, even in the presence of partial occlusions and dynamic obstacles. R EFERENCES [1] E. Olson and P. Agarwal, “Inference on Networks of Mixtures for Robust Robot Mapping,” in Proceedings of Robotics: Science and Systems (RSS), Sydney, Australia, July 2012. [2] N. Sunderhauf and P. Protzel, “Switchable Constraints for Robust Pose Graph SLAM,” 2012. [3] S. Thrun, W. Burgard, and D. Fox, “A Real-Time Algorithm for Mobile Robot Mapping With Applications to Multi-Robot and 3D Mapping,” in Proceedings of the IEEE International Conference on Robotics and Automation (ICRA). San Francisco, CA: IEEE, 2000. [4] S. Nobili, S. Dominguez, G. Garcia, and M. Philippe, “16 Channels Velodyne Versus Planar LiDARs Based Perception System for Large Scale 2D-SLAM.” [5] A. Diosi and L. Kleeman, “Fast Laser Scan Matching Using Polar Coordinates,” The International Journal of Robotics Research, vol. 26, no. 10, pp. 1125–1153, 2007.
Fig. 11: A trajectory based on open-loop odometry on a FOGequipped golf cart (blue) vs. our localized trajectory (green). Structure from the 2D prior map is shown in yellow. Noisy open-loop odometry causes errors in pose estimation, but 2D scan-matching results are sufficiently accurate for our localization system to correct the errors, keeping the vehicle safely within its lane.
[6] E. B. Olson, “Real-time correlative Scan Matching,” in Robotics and Automation, 2009. ICRA’09. IEEE International Conference on. IEEE, 2009, pp. 4387–4393. [7] P. J. Besl and N. D. McKay, “Method for Registration of 3-D Shapes,” in Robotics-DL tentative. International Society for Optics and Photonics, 1992, pp. 586–606. [8] J. Serafin and G. Grisetti, “NICP: Dense Normal Based Point Cloud Registration,” in Intelligent Robots and Systems (IROS), 2015 IEEE/RSJ International Conference on. IEEE, 2015, pp. 742–749. [9] F. Moosmann and C. Stiller, “Velodyne Slam,” in Intelligent Vehicles Symposium (IV), 2011 IEEE. IEEE, 2011, pp. 393–398. [10] R. W. Wolcott and R. M. Eustice, “ Visual Localization Within LIDAR Maps for Automated Urban Driving ,” in Proceedings of the IEEE/RSJ International Conference on Intelligent Robots and Systems, Chicago, IL, USA, September 2014, pp. 176–183. [11] ——, “ Fast LIDAR Localization Using Multiresolution Gaussian Mixture Maps ,” in Proceedings of the IEEE International Conference on Robotics and Automation, Seattle, WA, USA, May 2015, pp. 2814– 2821. [12] M. Cummins and P. Newman, “Appearance-only SLAM at Large Scale with FAB-MAP 2.0,” The International Journal of Robotics Research, vol. 30, no. 9, pp. 1100–1123, 2011. [13] T. Sattler, B. Leibe, and L. Kobbelt, “Fast Image-based Localization Using Direct 2D-to-3D matching,” in Computer Vision (ICCV), 2011 IEEE International Conference on, Nov 2011, pp. 667–674. [14] T. Korah, S. Medasani, and Y. Owechko, “Strip Histogram Grid for Efficient LIDAR Segmentation from Urban Environments,” in Computer Vision and Pattern Recognition Workshops (CVPRW), 2011 IEEE Computer Society Conference on. IEEE, 2011, pp. 74–81. [15] R. D. Morton and E. Olson, “Positive and Negative Obstacle Detection using the HLD Classifier,” in Proceedings of the IEEE/RSJ International Conference on Intelligent Robots and Systems (IROS), September 2011. [16] M. Montemerlo, J. Becker, S. Bhat, H. Dahlkamp, D. Dolgov, S. Ettinger, D. Haehnel, T. Hilden, G. Hoffmann, B. Huhnke, D. Johnston, S. Klumpp, D. Langer, A. Levandowski, J. Levinson, J. Marcil, D. Orenstein, J. Paefgen, I. Penny, A. Petrovskaya, M. Pflueger, G. Stanek, D. Stavens, A. Vogt, and S. Thrun, “Junior: The Stanford entry in the Urban Challenge,” J. Field Robot., vol. 25, no. 9, pp. 569–597, 2008.