The fate of the integer quantum Hall effect IQHE at weak magnetic field is studied ... transitions are controlled by a quantum critical point with a universal scaling ...
PHYSICAL REVIEW B, VOLUME 64, 165317
Float-up picture of extended levels in the integer quantum Hall effect: A numerical study D. N. Sheng,1 Z. Y. Weng,2 and X. G. Wen3 1
Department of Physics and Astronomy, California State University, Northridge, California 91330 2 Center for Advanced Study, Tsinghua University, Beijing 100084, China 3 Department of Physics, Massachusetts Institute of Technology, Cambridge, Massachusetts 02139 共Received 22 April 2001; revised manuscript received 24 July 2001; published 8 October 2001兲
The fate of the integer quantum Hall effect 共IQHE兲 at weak magnetic field is studied numerically in the presence of correlated disorders. We find a systematic float-up and merging picture for extended levels on the low-energy side which results in direct transitions from higher-plateau IQHE states to the insulator. Such direct transitions are controlled by a quantum critical point with a universal scaling form of conductance. The phase diagram is in good agreement with recent experiments. DOI: 10.1103/PhysRevB.64.165317
PACS number共s兲: 73.43.⫺f, 71.30.⫹h, 73.20.Jc
How extended levels evolve with disorders and the magnetic field B is central to our understanding of the integer quantum Hall effect 共IQHE兲. Earlier on, Khmel’nitzkii1 and Laughlin2 had argued that extended levels should continuously float up towards higher energy with reducing B. And the assumption that extended levels never merge has led to a select rule of the global phase diagram3 for the IQHE, in which a direct transition from a higher-plateau ( ⬎1) state to the insulator is prohibited. But direct transitions have been observed in many recent experiments,4 – 6 which have renewed theoretical interest in reexamining the float-up picture in IQHE systems. Previous numerical studies in the tight-binding model 共TBM兲 with white-noise disorders have indicated7–10 the existence of direct transitions from higher IQHE plateau states to the insulator. But a detailed analysis8 has also revealed that the lattice effect plays a central role there: such a direct transition first happens near the band center due to the presence of extended level carrying negative topological Chern number 共a peculiar lattice effect兲 which forms a high-energy IQHE-insulator boundary and starts to ‘‘float down’’ towards the low-energy regime with increasing disorder or reducing B. During the float-down process, the boundary keeps merging with lower extended levels such that the plateaus disappear in a one-by-one fashion. However, such a float-down picture, due to the lattice effect, is not expected in the continuum limit. Recall that in a continuum model, there does not exist a high IQHE-insulator boundary as the band center is essentially located at infinite energy. In this case a levitation of extended levels by disorders is expected as discussed in Refs. 11–13. Since it has been generally believed that the experimental situation should be physically described by the continuum model due to the weakness of magnetic fields compared to the bandwidth and low density of charge carriers, it becomes especially interesting whether the float-up of extended levels alone can also lead to a direct transition in the low-energy regime. A float-up of the lowest extended level actually has been seen in a numerical calculation10 based on the TBM but its journey has quickly ended by merging into the float-down IQHE-insulator boundary from the band center. In order to study how such a float-up feature near the band edge 0163-1829/2001/64共16兲/165317共5兲/$20.00
evolves, one has to somehow ‘‘delay’’ the floating-down process of the high IQHE-insulator boundary. Note that the inter-Landau-level mixing caused by uncorrelated 共whitenoise兲 disorders happens more strongly near the band center, which may enhance the tendency for extended levels near the band center to move down. So one can try to ‘‘smooth’’ the lattice effect by introducing short-range correlations among disorders. As a result to be shown below, the float-up process will then become a dominant effect for those lower extended levels as the float-down of the high IQHE-insulator boundary is significantly slowed, in contrast to the case in the white-noise limit8 at similar weak magnetic fields. In this paper, we present a systematic floating-up and merging pattern revealed for extended levels near the band edge. Specifically, the lowest extended level starts to float upward at stronger disorder or weaker B and eventually emerges into the second lowest extended level to form a new IQHE-insulator boundary on the low-energy side, leading to a ⫽2→0 direct transition, while the aforementioned upper IQHE-insulator boundary still remains at high energy. And such a lower IQHE-insulator boundary keeps moving up to merge with higher-energy extended levels to result in 3-0, 4-0, . . . direct transitions with increasing disorders or reducing B. The phase diagram is in good agreement with the experiments. Furthermore, direct transitions to the insulator at the lower boundary are found to be consistent with a quantum critical point picture, and in particular the conductance as a function of B⫺B c (B c denotes the critical magnetic field兲 is of the universal form for 1-0, 2-0, . . . up to 6-0 transitions within the numerical resolutions. The TBM H⫽⫺ 兺 具 i j 典 e ia i j c †i c j ⫹H.c.⫹ 兺 i w i c †i c i , with the magnetic flux per plaquette ⫽ 兺 䊐 a i j ⫽2 m/M (m and M are integers兲. And we define B⫽m/M . The correlated disor2 2 der w i is generated by w i ⫽W/ 兺 j f j e ⫺ 兩 Ri ⫺R j 兩 / 0 . Here Ri denotes the spatial position of site i. W and 0 are the strength and correlation length scale of disorders, respectively. f i is a random number distributing uniformly between (⫺1,1). To illustrate how extended levels near the band edge evolve with the disorder strength W, the density of states carrying nonzero Chern number ( ext ) as a function of the Landau level filling number (n L ) is plotted in Fig. 1共a兲 at
64 165317-1
©2001 The American Physical Society
D. N. SHENG, Z. Y. WENG, AND X. G. WEN
PHYSICAL REVIEW B 64 165317
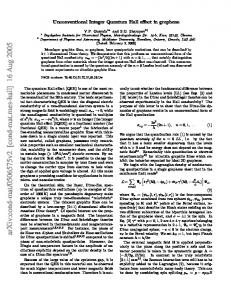
FIG. 1. 共a兲 The positions of extended levels determined by the peaks (⽧) of the density of states with nonzero Chern number 共see text兲. 共b兲 The single-peak behavior of the longitudinal conductance xx vs W, corresponding to the merged lowest two extended levels passing filling number n L ⫽2. 共c兲 The numerical phase diagram in the electron-density–magnetic-field (n-B) plane at 0 ⫽1. The inset: the critical disorder W c for the ⫽2→0 transition at n L ⫽2 as a function of B.
B⫽1/64, 0 ⫽1, and the sample size 32⫻64. We have checked that the positions of all the peaks of ext shown in Fig. 1共a兲 are sample size independent at three different sample sizes: N⫽16⫻64, N⫽24⫻64, and N⫽32⫻64. These peaks denote the positions of extended levels while the nonpeak part of ext should scale to zero presumably in the thermodynamic limit similar to the results reported before8,14 with weak disorders. In Fig. 1共a兲, as W is increased from 0.7 to 1.4, extended level positions 共marked by diamonds兲 all start to float up slightly from the filling number n L ⫽ ⫹0.5 ( ⫽0,1, . . . ). Besides the general float-up feature, Fig. 1共a兲 also shows that the lowest extended level distinctly moves faster than the second lowest extended level, so that the first plateau between these two extended levels should be narrowed during this float-up process. If such a narrowing is to continue with the increase of the disorder strength, then it eventually can result in the vanishing of the first plateau, leading to a direct plateau-insulator transition. To investigate this possibility, we fix the Landau level filling number at n L ⫽2, which is around the center of the second plateau at weak disorders, and then calculate the longitudinal conductance xx using the Landauer formula by calculating all the Lyapunov exponents from the transfer matrix method15,16 with stripe samples17 of L x ⫽L and L y ⬎106 . In Fig. 1共b兲, an example how xx changes with W is shown at the fixed n L ⫽2: At small W, xx remains small and decreases with sample length L, characterizing the insulating feature at the center of the plateau. But with the increase of W, xx first increases to signal that the extended levels at the lower filling number approach the plateau center at n L ⫽2. Then it peaks at some W⫽W c and finally decreases monotonically at W⬎W c . The single-peak behavior in Fig. 1共b兲 indicates that two lowest extended levels are already merged before they pass through n L ⫽2 as a single extended level at W c ⫽1.55. Such a direct transition from ⫽2 to the insulator persists into very weak magnetic fields from B⫽1/64 to B⫽1/2304. W c , at which the merged lowest two extended levels pass n L ⫽2, is shown in the inset of Fig. 1共c兲 as a function of B. We see that W c monotonically decreases with B and is extrapolated to zero in a fashion of B 1/2 in the weak B limit. Similar direct transitions can also be induced by reducing the strength of the magnetic field B. By following the trace of extended levels in the n-B plane (n is the on-site electron density兲 at fixed W⫽1.4 and 0 ⫽1, we determine the phase diagram in Fig. 1共c兲, where the solid circles represent the lower IQHE-insulator boundary, while the open circles are the positions of various extended levels between plateaus which merge into the boundary at weaker B. This phase diagram is very similar to a recent experimental phase diagram 共Fig. 2 in Ref. 4兲 as well as the earlier ones obtained in Refs. 5 and 6. We have checked that xy indeed saturates to e 2 /h in th plateau region while it approaches zero on insulating side. Both xxc and xyc at the →0 transition are close to e 2 /2h 共Ref. 18兲 in accordance with experiments.6 Apparently the above results critically depend on how reliably one can identify the positions of extended levels using finite-size calculations. Let us focus on the merged extended
165317-2
FLOAT-UP PICTURE OF EXTENDED LEVELS IN THE . . .
PHYSICAL REVIEW B 64 165317
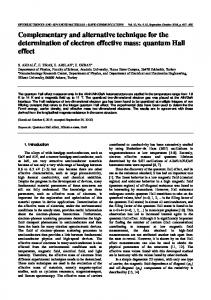
FIG. 2. 共a兲 The single-peak behavior of xx vs B, corresponding to the lowest six plateaus to the insulator transitions at fixed n L ⫽1,2, . . . ,6, respectively. 共b兲 The normalized conductance xx / c ( c is the peak value兲 vs a scaling variable s⫽c (L)(B⫺B c )/B c which follows a universal function form 共1兲.
levels as the lower IQHE-insulator boundary shown in Fig. 1共c兲. By fixing n L ⫽2, marked by the arrow C in Fig. 1共c兲, we calculated the longitudinal conductance xx with B changing continuously at fixed W⫽1.4. We found a peak in xx at B c ⫽1/70 as a 2-0 transition. In Fig. 2共a兲, xx as a function of B with n L ⫽1,2, . . . ,6 at W⫽1.4 are shown for sample width L⫽96. The L-independent peak positions should correspond to ⫽1→0, 2→0, . . . , and 6→0 transitions in Fig. 1共c兲. Remarkably, all these data can be collapsed onto a universal curve
xx / c ⫽2 exp共 s 兲 / 关 1⫹exp共 2s 兲兴 ,
共1兲. Identifying such a simple scaling relation for ⫽1,2 →0 as well as higher plateaus to insulator transitions may be the most striking evidence for a single quantum critical point at each transition. The standard scaling method can be also
共1兲
as shown in Fig. 2共b兲, if one defines a variable s⫽c (L)(B ⫺B c )/B c , which is different from the logarithmical form discussed in Ref. 13. Here the parameter 1/c (L) represents the relative width of →0 transition at a finite L. Furthermore, by collapsing the data at different L’s, we find a scaling curve for ⫽2→0 transition in Fig. 3共a兲, with c 共 L 兲 ⬀L 1/x
共2兲
from L⫽32 to L⫽160. The correlation length exponent is identified to be x⫽4.6⫾0.5 in the inset of Fig. 3共a兲, about doubled from x⫽2.3 for the ⫽1→0 transition which has been similarly determined at n L ⫽1. We emphasize that these scaling features provide very strong evidence for the existence of a new quantum critical point at the 2-0 transition. However, the exponent revealed here may not be accurate as the finite-size correction to the exponent is known to be important.19 The exponents for 3-0, . . . ,6-0 transitions seem further increased but are more difficult to determine as larger sample sizes are needed. Furthermore, Eq. 共1兲 still holds as we change 0 from 1 to 2 and 3 or n L away from integer numbers. The details will be presented elsewhere. Based on Eqs. 共1兲 and 共2兲, we conclude that the ⫽2 →0 transition corresponds to a quantum critical point with measure zero in the L→⬁ limit. We note that the same scaling form has been previously obtained20 for the 1-0 transition, where xx ⫽exp(⫺s)h/e2 and xy ⫽h/e 2 leading to Eq.
FIG. 3. 共a兲 The normalized conductance xx (L)/ c for the ⫽2→0 transition at different sample sizes. The inset: c(L) ⫽c 0 L 1/x where x⫽4.6⫾0.5. 共b兲 The same data are collapsed as a function of /L. The inset: ⬀ 兩 B⫺B c 兩 ⫺x .
165317-3
D. N. SHENG, Z. Y. WENG, AND X. G. WEN
PHYSICAL REVIEW B 64 165317
FIG. 4. The double peak xx before two lowest extended levels merge is shown in the middle panel of 共a兲. 共a兲 xx / c as a function of /L by collapsing all the data at B⬍B c1 with shown in the right inset. 共b兲 By assuming a single critical point at B m , the data collapsing shows worse quality and in the inset becomes saturated approaching B m .
applied to the ⫽2→0 transition to independently verify the one parameter scaling law.21 As shown in Fig. 3共b兲, by collapsing the same data as xx (L)/ c ⫽ f ( /L) by a correlation length , we find ⬀ 兩 (B⫺B c )/B c 兩 ⫺x with x⫽4.5⫾0.5 关the inset of Fig. 3共b兲兴 in agreement with the above result. We have also checked the case right before the lowest two extended levels merge together. By scanning B at a fixed n L ⫽1.8 nearby the scan C shown in Fig. 1共c兲, xx exhibits two distinct peaks at B c1 ⫽0.0151 and B c2 ⫽0.0169 with L ⫽128 关see the middle inset of Fig. 4共a兲兴. The main panel of Fig. 4共a兲 shows the finite-size scaling curve of xx / c as a
D. E. Khmel’nitzkii, Phys. Lett. 106A, 182 共1984兲. R. B. Laughlin, Phys. Rev. Lett. 52, 2304 共1984兲. 3 S. A. Kivelson, D.-H. Lee, and S.-C. Zhang, Phys. Rev. B 46, 2223 共1992兲. 4 M. Hilke, D. Shahar, S. H. Song, D. C. Tsui, and Y. H. Xie, Phys. Rev. B 62, 6940 共2000兲. 5 S. V. Kravchenko, Whitney Mason, J. E. Furneaux, and V. M. Pudalov, Phys. Rev. Lett. 75, 910 共1995兲; A. A. Shashkin, G. V. Kravchenko, and V. T. Dolgopolov, JETP Lett. 58, 220 共1993兲; V. M. Pudalov et al., Surf. Sci. 305, 107 共1994兲. 6 S.-H. Song et al., Phys. Rev. Lett. 78, 2200 共1997兲; D. Shahar 1 2
function of /L obtained by collapsing the data of different sample sizes at B⬍B c1 . The right inset indicates that diverges at B c1 with an exponent x⫽2.4 which is essentially the same as the standard one for the 1-0 transition. A similar finite-size scaling curve has been also obtained for the branch at B⬎B c2 , corresponding to the 2-1 transition. It is noted that the above analysis resembles the study22 of the spin-unresolved case at strong magnetic field where a small spin-orbit coupling is used to lift the spin degeneracy to create two separated but very close quantum critical points. Similar to the latter case, if one ‘‘mistakenly’’ treats the present case as a single critical point at B m , a middle point between B c1 and B c2 , and proceeds with a finite-size scaling analysis, then one gets Fig. 4共b兲 where the quality of data collapsing becomes markedly worse and in particular shows a saturation trend approaching B m , contrary to the assumption of a critical point at B m . Thus, the two separated extended levels with 兩 B c1 ⫺B c2 兩 /B m ⬃0.11 are not mistakable as a single critical point in our numerical analysis. Finally, we make a remark that even if the 2-0 transition that we observed is actually two transitions with very small 兩 B c1 ⫺B c2 兩 indistinguishable numerically, the nice scaling properties 关Eqs. 共1兲 and 共2兲兴 that we found still indicate that there is a new quantum critical point. In this case, the splitting 兩 B c1 ⫺B c2 兩 ⫽0, if it exists, should be caused by a relevant operator of such a new critical point. To summarize, we have identified a float-up and merging pattern for extended levels near the band edge at weak B 共down to B⫽1/2304 where there are 1152 Landau levels between the band edge and center兲. The corresponding phase diagram with direct transitions is in excellent agreement with experiments where the essential features can be explained by the narrowing and destruction of each IQHE plateau due to the sequential merging of neighboring extended levels as the mobility gap in between collapses. D.N.S. would like to acknowledge helpful discussions with R. N. Bhatt, F. D. M. Haldane, and M. Hilke. D.N.S. and Z.Y.W. would like to thank the hospitality of the Aspen Center for Physics where this work was initiated. X.G.W. is supported by NSF Grant No. DMR-97-14198 and NSF-MRSEC Grant No. DMR-98-08941. D.N.S. is supported by the Petroleum Research Fund No. ACS-PRF No. 36965-AC5.
et al., Phys. Rev. B 52, R14 372 共1995兲. D. Z. Liu, X. C. Xie, and Q. Niu, Phys. Rev. Lett. 76, 975 共1996兲; D. Z. Liu et al., Phys. Rev. B 54, 4966 共1996兲. 8 D. N. Sheng and Z. Y. Weng, Phys. Rev. Lett. 78, 318 共1997兲. 9 H. Potempa et al., Physica B 256, 591 共1998兲; Y. Hatsugai, K. Ishibashi, and Y. Morita, Phys. Rev. Lett. 83, 2246 共1999兲. 10 D. N. Sheng and Z. Y. Weng, Phys. Rev. B 62, 15 363 共2000兲. 11 F. D. M. Haldane and K. Yang, Phys. Rev. Lett. 78, 298 共1997兲. 12 M. M. Fogler, Phys. Rev. B 57, 11 947 共1998兲. 13 B. Huckestein, Phys. Rev. Lett. 84, 3141 共2000兲. 14 K. Yang and R. N. Bhatt, Phys. Rev. Lett. 76, 1316 共1996兲; Phys. 7
165317-4
FLOAT-UP PICTURE OF EXTENDED LEVELS IN THE . . .
PHYSICAL REVIEW B 64 165317
Rev. B 59, 8144 共1999兲. A. MacKinnon and B. Kramer, Z. Phys. B: Condens. Matter 53, 1 共1983兲. 16 D. S. Fisher and P. A. Lee, Phys. Rev. B 23, 6851 共1981兲. 17 D. N. Sheng and Z. Y. Weng, Europhys. Lett. 50, 776 共2000兲. 18 D. N. Sheng and Z. Y. Weng, Phys. Rev. Lett. 80, 580 共1998兲. 15
B. Huckestein, Phys. Rev. Lett. 72, 1080 共1994兲. D. N. Sheng and Z. Y. Weng, Phys. Rev. B 59, R7821 共1999兲. 21 B. Huckestein and B. Kramer, Phys. Rev. Lett. 64, 1437 共1990兲. 22 Z. Wang, D.-H. Lee, and X.-G. Wen, Phys. Rev. Lett. 72, 2454 共1994兲; D. K. K. Lee and J. T. Chalker, ibid. 72, 1510 共1994兲. 19 20
165317-5