Dec 21, 2018 - median. Estimated ensemble flood risk curves at present/ .... The Katsura, Uji and Kizu River basins are shown as light red, yellow, and light ...
Hydrological Research Letters 12(4), 28–33 (2018) Published online in J-STAGE (www.jstage.jst.go.jp/browse/hrl). DOI: 10.3178/hrl.12.28
Flood risk curve development with probabilistic rainfall modelling and large ensemble climate simulation data: a case study for the Yodo River basin Tomohiro Tanaka1, Yasuto Tachikawa2, Yutaka Ichikawa2 and Kazuaki Yorozu2 Graduate School of Global Environmental Studies, Kyoto University, Japan 2 Graduate School of Engineering, Kyoto University, Japan
1
Abstract: A flood risk curve is the relation between annual maximum economic damage due to floods and its exceedance probability, which provides useful information for quantitative flood risk assessment. This study proposed to examine the applicability of d4PDF, a large ensemble climate projection dataset, to develop a probabilistic flood risk curve for the Yodo River basin (8,240 km2), Japan. The d4PDF is a climate dataset under historical and 4 K increase conditions with tens of ensembles and provide a physically-based and reliable estimation of ensemble flood risk curves and their future changes. We identified that d4PDF rainfall data has bias for the spatial variability of rainfall probably due to coarse spatial resolution, while not for basin-averaged rainfall. This typical type of bias was removed by incorporating basin-averaged rainfall of d4PDF and observed spatial pattern of rainfall into analytically-based probabilistic rainfall modelling. Derived ensemble flood risk curves provided a histogram of T-year flood damage. The histogram had a long tail and showed that T-year flood damage may be larger than its deterministic estimate located at the median. Estimated ensemble flood risk curves at present/ future climates showed a clear increase of flood risk and its uncertainty at 4 K increase scenario. KEYWORDS flood risk curve; ensemble projection; d4PDF; climate change
INTRODUCTION In a changing climate, flood risk is expected to increase in many parts of the world. In river basins with high levels of flood defenses, it is not feasible to cover all the increments through reinforcement. For integrated flood risk management including hardware/software countermeasures, a flood risk curve, which shows the relation between annual economic damage due to floods and its exceedance probability, is effective because it quantifies the current flood risk and its reduction by both types of countermeasures. Since it is hard to collect enough economic damage statistics, several researchers have demonstrated the derivation of a flood risk curve using the probability distribution of rainfall and/or flood peak discharge, considering their
spatiotemporal distribution (Apel et al., 2006; Neal et al., 2013; Tanaka et al., 2015). The problem of small samples for this type of extreme phenomena is also the case for future projection using Global Climate Models (GCMs). Most GCMs provide climate reproduction and projection for several decades under a few sea surface temperature scenarios and initial conditions. They are not enough to estimate quantiles corresponding to return periods over the simulation periods (such as 100 and/or 200 years). Furthermore, the small number of ensemble members requires statistical resampling to identify the uncertainty range. To address this issue, several inter-organizational research collaboration projects have created a huge number of ensemble climate data. A collaborative research project by several research institutes in Japan has created a database for policy decision making for future climate change (d4PDF), which has large ensembles under the historical (present) and a 4 K increase (future) scenario (and 2 K increase scenario available since August, 2018). (d4PDF, http://www.miroc-gcm. jp/~pub/d4PDF/; Mizuta et al., 2017). Another international research collaboration project, called Half a degree Additional warming, Prognosis and Projected Impacts (HAPPI), has made a multi-model ensemble climate dataset under 1.5 K increase scenario (HAPPI, http://www. happimip.org/about/). This makes it possible to produce a sufficient number of extreme flood events causing overflow even in well-protected areas to help assess flood risk and quantify its uncertainty (e.g. Endo et al., 2017; Barcikowska et al., 2018). This study explores the applicability of d4PDF rainfall dataset to flood risk curve development as a case study of the Yodo River basin (8,240 km2), Japan. First, the reproducibility of the present climate data was examined in terms of basin-averaged rainfall and its spatiotemporal characteristics (duration, temporal variance, and spatial concentration). Then, we demonstrated the development of flood risk curves for 50 ensemble members in d4PDF using probabilistic rainfall modelling. Finally, future ensemble flood risk curves were estimated assuming that spatiotemporal patterns of rainfall are consistent with those in the historical storm events.
Correspondence to: Tomohiro Tanaka, Graduate School of Global Environmental Studies, Kyoto University, Kyotodaigaku-Katsura, Nishikyoku, Kyoto, Kyoto 615-8540, Japan. E-mail: tanaka.tomohiro.7c@kyoto-u. ac.jp
Received 27 August, 2018 Accepted 12 November, 2018 Published online 21 December, 2018
© The Author(s) 2018. This article is distributed under the terms of the Creative Commons Attribution 4.0 International License (http://creativecommons.org/ licenses/by/4.0/), which permits unrestricted use, distribution, and reproduction in any medium, provided you give appropriate credit to the original author(s) and the source, provide a link to the Creative Commons license, and indicate if changes were made.
—28—
ENSEMBLE FLOOD RISK CURVE DEVELOPMENT
FLOOD RISK CURVE DEVELOPMENT USING PROBABILISTIC RAINFALL MODELLING This study applied a probabilistic rainfall model proposed by Tanaka et al. (2017) which derives a flood risk curve by modelling the occurrence of a storm event on the following assumptions: 1) The number of storm events per year follows the Poisson distribution with the occurence ratio of μ (averaged annual event number is μΔt, where Δt is one year). 2) When a storm event occurs, its spatiotemporal pattern is generated from N patterns that occurred in historical storm events and i-th pattern ξi (i = 1, 2, ..., N) occurs with probability of pi = 1/N. 3) According to the rainfall duration di of the selected pattern ξi (i = 1, 2, ..., N), its basin-averaged rainfall r is generated from a conditional cumulative distribution function (CDF) GR|D (r|di). 4) For each storm pattern, the resulting flood damage m increases as its basin-averaged rainfall r increases. i-th storm pattern ξi (x, y, t) is defined as the normalized time series of rainfall intensity at time t and location (x, y). Denoting ri (x, y, t) as the rainfall intensity at time t and location (x, y) of i-th storm event, ξi (x, y, t) satisfies the following equations: r x, y, t ξ i x, y, t = i , and (1) Ri Ri =
1 d r x, y, t dxdy dt, A ∫0 ∫B i
(d4PDF, http://www.miroc-gcm.jp/~pub/d4PDF/). The simulation was performed for 50 and 90 ensembles for present and future climates, respectively. Future climate is assumed to follow a 4 K increase scenario, mostly corresponding to a Representative Concentration Pathway (RCP), RCP 8.5, which is a scenario of rising radiative forcing pathway leading to 8.5 W/m2 in 2100. Each ensemble has the length of 60 years, given different initial condition (sea surface temperature, sea ice, concentration of green house gasses, sulfuric acid aerosol, ozone, and volcanic aerosol) and small perturbation to the time series of boundary sea surface temperature and sea ice. Recent studies clarified that this dataset well reproduces frequencies of annual maximum basin-averaged rainfall for some particular river basins of Japan (e.g. Tachikawa et al., 2017; Hoshino and Yamada, 2018). This study first examined the bias of d4PDF rainfall data in terms of basin-averaged rainfall, rainfall duration, and temporal and spatial concentration of rainfall; then demonstrated the application of this huge ensemble rainfall dataset to flood risk curve development.
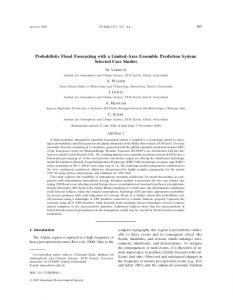
Comparison of observed and d4PDF rainfall data The study area is shown in Figure 1. Red and green dots show the rain gauge stations and the center of d4PDF grids, respectively. Rainfall is observed for 35 years from 1980 to 2014. Flood risk curves are developed for the confluence floodplains (see red area in Figure 1) among the three major tributary rivers: Katsura, Uji, and Kizu Rivers, where
(2)
where Ri is the basin-averaged rainfall depth of the i-th rainfall event, d is the rainfall duration, A and B are the area and the domain of the target basin, respectively. According to the above definition, non-exceedance probability of annual maximum flood damage mmax is derived as F M max mmax = exp − μΔt
1 N 1 − GR D ri mmax d i N i∑ =1
(3)
where ri (mmax) is the basin-averaged rainfall causing flood damage mmax for the storm pattern ξi (i = 1, 2, ..., N). The Assumption 2) is justified in this study by using a large number of storm patterns (N = 1,371 events for 35 years (1980 to 2014) in this study). The most unique feature of this method is that a storm event is seperated into basinaveraged rainfall and its spatiotemporal pattern. By preparing these components and calculating the relation between basin-averaged rainfall and flood damage for each storm pattern ξi through rainfall-runoff-inundation and damage loss simulation, a flood risk curve is derived from Equation (3) without Monte Carlo simulation.
BIAS IDENTIFICATION IN d4PDF d4PDF rainfall d4PDF stands for database for Policy Decision making for Future climate change and provides large ensemble climate data, simulated by MRI-AGCM 3.2H in 60 km resolution and downscaled by Non-Hydrostatic Regional Climate Model (NHRCM) in 20 km resolution for Japan area
Figure 1. Map of the Yodo River basin, Japan. Red dots are the rainfall gauge stations; green dots show d4PDF grid. The Katsura, Uji and Kizu River basins are shown as light red, yellow, and light blue areas. The Lake Biwa basin (upstream of the Uji River basin shown as the orange area) was excluded from the catchment area because its outlet is closed in flooding with the Seta Weir. Flood risk is assessed in the red floodplain area having several urban cities
—29—
T. TANAKA ET AL.
Figure 2. Histograms of (a) basin-averaged rainfall, (b) rainfall duration, and (c) temporal variance (see definition in Equation (4)) between d4PDF (gray) and observed rainfall (white) data of the Yodo River basin the lower parts of the historical Kyoto City area are located. This section examines the bias of d4PDF rainfall data at the present climate from the observed one in terms of basinaveraged rainfall and its spatiotemporal characteristics. Figure 2 shows the histograms of (a) basin-averaged event rainfall, (b) rainfall duration and (c) temporal variance between d4PDF and observed rainfall. A storm event in this study was defined as a rainfall event having dry periods shorter than six hours, duration over 10 hours, and basinaveraged total rainfall over 10 mm. Temporal variance is defined as Ct =
1 d η t −− η 2dt d ∫0
1 1 d η = ∫ η t dt ξ x, y, t dxdy, − A ∫B d 0
(5)
As in Figure 2, distributions of basin-average rainfall, rainfall duration and temporal variance are in good agreement between d4PDF and the observed rainfall. Spatial concentration of a storm pattern on a tributary river basin CΩ (denote its domain as Ω) is then defined by normalized tributary rainfall on Ω as: CΩ =
1 d ξ x, y, t dxdy dt 0 ≤ C Ω ≤ 1 A ∫0 ∫Ω
tains more concentrated (0.1 to 0.3) patterns, indicating that spatial distribution of d4PDF rainfal data is more spatially uniform. This bias often apprears in climate simulation results in coarser spatial resolution and/or with hydrostatic assumption, and this is likely to result in smaller flood damage than a storm event with actual spatial distribution. In summary, d4PDF data is comparable to observed data for basin-averaged rainfall, rainfall duration and its temporal variance while biased for spatial distribution.
ENSEMBLE FLOOD RISK CURVE DEVELOPMENT
(4)
where η(t) is the normalized basin-averaged rainfall at time t and − η is its mean value, and they are defined as ηt =
Figure 3. Histograms of normalized tributary rainfall (see definition in Equation (6)) on (a) Katsura River basin, (b) Uji River basin, and (c) Kizu River basin between d4PDF (gray) and observed rainfall (white) data
(6)
Equation (6) indicates the ratio of basin-averaged rainfall over the tributary river basin to that over the whole river basin; thus, a rainfall pattern is evaluated as spatially concentrated if CΩ is close to zero or 1. The histograms of the spatial concentration to the Katsura, Uji, and Kizu River basins between the observed rainfall and d4PDF rainfall are shown in Figure 3. All the results indicated that normalized tributary rainfall CΩ of d4PDF rainfall data are distributed around 0.3 to 0.5, while that of the observerd rainfall con-
Framework of deriving ensemble flood risk curve To deal with the bias of d4PDF presented above, ensemble flood risk curves for present and future climates were derived as follows (see Figure 4). The probabilistic rainfall modelling in this study seperately defines the probability of basin-averaged rainfall (as the conditional CDF of rainfall on duration) and spatiotemporal rainfall patterns; therefore, d4PDF data was applied to estimate a conditional CDF of basin-averaged rainfall on duration GR|D (r|di). The rainfall patterns were referred to ones of the observed 1,371 storm events, and the basin rainfall-damage relation for each pattern ri (mmax) (i = 1, 2, ..., N) was simulated using rainfallrunoff and inundation models by inputting storm events composed of the observed rainfall pattern and different magnitudes of basin rainfall. In addition to developing flood risk curves of each ensemble member, this study also applied a set of all the ensemble members, i.e. 3,000 years (50 members for 60 years) at the present climate and 5,400 years (90 members for 60 years) the future climate, to draw a single flood risk curve under each climatic condition of d4PDF.
—30—
ENSEMBLE FLOOD RISK CURVE DEVELOPMENT
Figure 4. Flowchart to derive ensemble flood risk curves using d4PDF data. d4PDF rainfall data for S members under present (S = 50) and future (S = 90) climates were reflected on the conditional CDF of rainfall on duration; basin-rainfall causing damage for different rainfall patterns were referred to rainfall-damage relations of observed rainfall patterns
Flood-inundation and damage modelling Flood damage is simulated through a rainfall-runoff, a flood-inundation, and a damage simulation module. Rainfall-runoff (Tanaka and Tachikawa, 2015) and floodinundation models of the target basin were constructed by Tanaka et al. (2017). Flood damage is calculated from the simulated maximum inundation depth and fragility curves for house, households, office stocks and depreciable assets, according to a manual of flood economic survey by the Ministry of Land, Infrastructure, Transportation and Tourism (2005). By simulating flood damage for each storm event pattern extending basin-averaged total rainfall from 50 mm to 1,000 mm in 50 mm increments, the relation between basin-average rainfall and flood damage for each rainfall pattern ri (m) (i = 1, 2, ..., 1,371) is obtained as Figure S1.
Estimation of rainfall probability distribution for d4PDF rainfall data The conditional probability distribution of basinaveraged rainfall on rainfall duration GR|D(r|d) is derived by the following equation: GR D r d =
1 gD d
r
∫g 0
RD
x, d d x
(7)
where gD(d) is the CDF of rainfall duration d. The joint probability density function gRD(r, d) is derived from its CDF GRD(r, d), which is estimated using the normal copula (Nelsen, 2006): 1 θ (8) GRD r, d = ΦΣ Φ−1 GR r , Φ−1 GD d , Σ = θ 1 where Φ is the one-dimensional CDF of the standardized normal distribution; ΦΣ is the two-dimensional CDF of the standardized normal distribution with the correlation matrix; θ is the only paramter of this copula function, estimated by the maximum likelihood method. The generalized pareto distribution and the gamma distribution were applied to the marginal CDF of basin-average rainfall gR(r) and rainfall duration gD(d), respectively. The conditional CDF
Figure 5. Conditional CDF of basin-averaged rainfall on duration of (a) 24 hours and (b) 96 hours for the present (blue) and future (red) climate experiments (50 and 90 ensemble members, respectively). The black line shows the observed CDF
of basin-averaged rainfall on duration of 24 and 96 hours for 50 (present climate experiment) and 90 (4 K increase experiment) ensemble members of d4PDF are shown in Figure 5. The CDF of the observed rainfall data is shown as the black line as well. The observed CDF is within the range of ensemble CDFs of d4PDF at the present climate. Therefore, this study utilizes d4PDF rainfall data for the conditional CDF of rainfall on duration. Comparing present and future climates, it is clearly indicated that basinaveraged rainfall at the same percentile is higher at the future climate for both durations.
Ensemble present/future flood risk curves Flood risk curves for 50 ensemble members of the present d4PDF, derived by estimating the conditional CDF of basin-averaged rainfall GR|D(r|d) of each member in the above process and applying Equation (3), are shown in Figure 6(a). The flood risk curve for each ensemble member largely differs from each other, especially for larger flood damage. The thick blue line shows a flood risk curve for which all the ensemble members (3,000 years) were used for estimating a conditional CDF GR|D(r|d). Figure 6(b) shows the histogram of exceedance probability for the flood damage of 800 billion Japanese yen among ensemble members. Non-exceedance probability of the flood risk curve using all the ensemble members (shown as the thick blue vertical line) is located at the mode of the histogram and its shape is heavily distorted, which indicated that the estimated flood damage corresponding to a long return period may become extreme, depending on the tail characteristics of basin-averaged rainfall. By combining the probabilistic rainfall model and large ensemble climate data, physically-based ensemble flood risk curves are derived without assuming any parametric error distribution. The validity of the probabilistic rainfall model used above was evaluated in Text S1, by comparing the derived flood risk curve with a probability plot of 3,000 flood damages caused by annual maximum 24-hour rainfall of all the 3,000 members at the present climate in d4PDF. Finally, ensemble flood risk curves for the present and future climates are shown in Figure 7. Similar to Figure 6, spatiotemporal rainfall patterns are applied from the observed 1,371 patterns. Flood risk will clearly increase and its uncertainty will become larger for the future cli-
—31—
T. TANAKA ET AL. larly in well-protected areas; thus, the proposed combined approach between large ensemble climate simulation data and probabilistic rainfall modelling is effective to derive ensemble flood risk curves.
CONCLUSIONS A flood risk curve is an effective criterion to quantify the present/future flood risk and its reduction by countermeasures. As flooding rarely occurs especially in urbanized areas, it is essential to show the uncertainty of flood risk curve estimation. This study examined the applicability of large ensemble climate simulation data d4PDF to the present/future ensemble flood risk curve development as a case study of the Yodo River basin (8,240 km2). The bias of d4PDF identified for spatial distribution of rainfall was removed by employing the observed patterns. In this combined approach, ensemble flood risk curves were successfully demonstrated for the present and future climates. The limitation of this approach is the assumption that the spatiotemporal rainfall pattern does not change in the future climate, which will be addressed by statistical/dynamical downscaling in future research.
ACKNOWLEDGMENTS Figure 6. Results of the present experiment in d4PDF: (a) 50 ensemble flood risk curves derived from Equation (3) with 60 years rainfall data of each member (thin lines) and with the whole 3,000 years rainfall data (thick line); (b) histogram of the exceedance probability of annual flood damage of 800 billion Japanese yen (the bar shows one for a flood risk curve derived with 3,000 years rainfall data)
This research was supported by the grant-in-aid for scientific research (A) 17H01294 and the Integrated Research Program for Advancing Climate Models (TOUGOU) of the Ministry of Education, Culture, Sports, Science and Technology (MEXT), Japan. This study utilized the database for Policy Decision making for Future climate change (d4PDF). Meteorological and hydrological data were provided by the Yodo River Office, Kinki Regional Development Bureau, Ministry of Land, Infrastructure, Transportation and Tourism.
SUPPLEMENTS
Figure 7. Present (blue) and future (red) ensemble flood risk curves. Thick lines show flood risk curve derived by Equation (3) using all the ensembles (50 members for present and 90 members for future climates) mate. This increase is originated from the increased frequencies of heavy rainfall as shown in Figure 5. At the future climate (4 K increase scenario for d4PDF), the exceedance probability at flood damage zero corresponds to around a 50-year return period. The length of 60 years are not enough for plotting flood damage samples particu-
Text S1. Validation of probabilistic rainfall modelling using huge rainfall samples of d4PDF Figure S1. Relation between basin-averaged rainfall and flood damage for 1,371 observed storm patterns Figure S2. Histograms of normalized tributary rainfall (see definition in Equation (6)) on (a) Katsura River basin, (b) Uji River basin, and (c) Kizu River basin between d4PDF (gray) and observed rainfall data without spatially concentrated patterns (white) (normalized tributary rainfall is less than 0.35 for Katsura River, 0.33 to 0.5 for Kizu River, and more than 0.35 for Uji River). A histogram of temporal variance between d4PDF and the selected patterns is also shown in (d) Figure S3. Validation of flood risk curve development using Equation (3). Black dots show the Weibull plots of annual maximum flood damage over 3,000 years caused by storm events of present climate with annual maximum 24-hour rainfall, which is regarded as a reference flood risk curve for validation. The black line shows the derived flood risk curve with all the members of present
—32—
ENSEMBLE FLOOD RISK CURVE DEVELOPMENT climate, excluding spatially concentrated patterns to represent rainfall pattern characteristics of d4PDF. The blue line shows the one with all the rainfall patterns (same as the thick blue line in Figure 6)
REFERENCES Apel H, Thieken AH, Merz B, Blöschl G. 2006. A probabilistic modelling system for assessing flood risks. Natural Hazards 38: 79–100. DOI: 10.1007/s11069-005-8603-7. Barcikowska MJ, Weaver SJ, Feser F, Russo S, Schenk F, Stone DA, Wehner MF, Zahn M. 2018. Euro-Atlantic winter storminess and precipitation extremes under 1.5°C vs. 2°C warming scenarios. Earth System Dynamics 9: 679. DOI: 10.5194/esd-9-679-2018. d4PDF. http://www.miroc-gcm.jp/~pub/d4PDF/. Last access August 21, 2018. Endo H, Kitoh A, Mizuta R, Ishii M. 2017. Future changes in precipitation extremes in East Asia and their uncertainty based on large ensemble simulations with a high-resolution AGCM. SOLA 13: 7–12. DOI: 10.2151/sola.2017-002. HAPPI. http://www.happimip.org/about/ Last access June 20, 2018. Hoshino T, Yamada T. 2018. Analysis of annual maximum precipitation over first-class river domains in Japan using a large-ensemble dataset (d4PDF). Journal of Japan Society of Civil Engineering, Ser. B1 (Hydraulic Engineering) 74: I_187–I_192. Mizuta R, Murata A, Ishii M, Shiogama H, Hibino K, Mori N, Arakawa O, Imada Y, Yoshida K, Aoyagi T, Kawase H, Mori M, Okada Y, Shimura T, Nagatomo T, Ikeda M, Endo H, Nosaka M, Arai M, Takahashi C, Tanaka K, Takemi T, Tachikawa Y, Temur K, Kamae Y, Watanabe M, Sasaki H,
Kitoh A, Takayabu I, Nakakita E, Kimoto M. 2017. Over 5000 years of ensemble future climate simulations by 60 km global and 20 km regional atmospheric models. Bulletin of the American Meteorological Society 98: 1383–1398. MLIT. Flood control economic survey manual (draft) (free translation), 2005. http://www.mlit.go.jp/river/basic_info/seisaku_ hyouka/gaiyou/hyouka/h1704/chisui.pdf. Last access August 21, 2018. Neal J, Keef C, Bates P, Beven K, Leedal D. 2013. Probabilistic flood risk mapping including spatial dependence. Hydrological Processes 27: 1349–1363. DOI: 10.1002/hyp.9572. Nelsen R. 2006. An Introduction to Copulas, 2nd edition, Springer, New York. Tachikawa Y, Miyawaki K, Tanaka T, Yorozu K, Kato M, Ichikawa Y, Kim S. 2017. Future change analysis of extreme floods using large Ensemble climate simulation data. Journal of Japan Society of Civil Engineering, Ser. B1 (Hydraulic Engineering) 73: 77–90 (Japanese with English abstract). Tanaka T, Tachikawa Y. 2015. Testing the applicability of a kinematic wave-based distributed hydrological model in two climatically contrasting catchments. Hydrological Sciences Journal 60: 1361–1373. DOI: 10.1080/02626667.2014. 967693. Tanaka T, Tachikawa Y, Yorozu K. 2015. A flood risk curve development for inundation disaster considering spatiotemporal rainfall distribution. Proceedings of the International Association of Hydrological Sciences 370: 57–62. Tanaka T, Tachikawa Y, Ichikawa Y, Yorozu K. 2017. Impact assessemnt of upstream flooding on extreme flood frequency analysis by incorporating a flood-inundation model for flood risk assessment. Journal of Hydrology 554: 370–382. DOI: 10.1016/j.jhydrol.2017.09.012.
—33—