SCIENCE CHINA Technological Sciences • RESEARCH PAPER •
June 2013 Vol.56 No.6: 1370–1376 doi: 10.1007/s11431-013-5215-4
Flow field optimization and design for a Spallation Neutron Source target cooling system HAO JunHong1, CHEN Qun1*, XU YunChao1, LU YouLian2 & JI Quan2 1
Key Laboratory for Thermal Science and Power Engineering of Ministry of Education, Department of Engineering Mechanics, Tsinghua University, Beijing 100084, China; 2 Institute of High Energy Physics, Chinese Academy of Sciences, Beijing 100049, China Received October 20, 2012; accepted March 26, 2013; published online April 29, 2013
Cooling water is an important part in a Spallation Neutron Source target cooling system, but the unstable vortexes at the exits of the slits between every two tungsten target slices have a negative impact on the stable running of the target system. We apply the field synergy principle for fluid flow to obtain the optimal flow field, which has a uniform velocity distribution without eddy, and then, optimize the geometrical structure of the cooling water flow channel based on the optimal flow field. The results show that when the cooling water flows in the optimized channel, the eddy sizes decrease, the time fluctuations of velocity and pressure almost vanish, and the volume flow rates of the cooling water in each parallel slit are uniform. Therefore, it effectively improves the running stability of the target system with the premise of satisfying the target heat load. spallation neutron source, target cooling system, flow channel design, field synergy equation Citation:
Hao J H, Chen Q, Xu Y C, et al. Flow field optimization and design for a Spallation Neutron Source target cooling system. Sci China Tech Sci, 2013, 56: 13701376, doi: 10.1007/s11431-013-5215-4
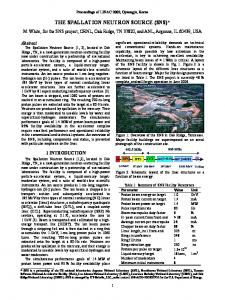
1 Introduction Spallation Neutron Source (SNS) is an important platform for basic scientific research and development of new materials. China Spallation Neutron Source (CSNS) started in 2008 is the first SNS project in the developing countries, and one of the four major SNS projects in the world [1–3]. In the CSNS system, high-energy proton bombards the tungsten target, and generates neutrons as well as some charged particles through spallation reaction, which in turn results in heat generation due to energy deposition [4]. Therefore, the cooling system is very important and critical for ensuring the normal operation of the target. As shown in Figure 1, the tungsten target is cut into several slices with different thicknesses and form several slits
between every two slices. The cooling water flows through the slits and takes away the generated heat of the target. Broome and Du [5, 6] numerically studied the influence of such facts as the temperature field of the target, the velocity field of the cooling water and the pressure field in the channel on the cooling performance. However, when the cooling water flows out of the slits, it always forms many unstable eddies in the outlet channel, which has a negative influence on the stable running of the target. For ensuring the normal operation, it is necessary to redesign and optimize the structure of the cooling water flow channel. When the fluid flows in the channel with variable cross section, the time-averaged velocity will fluctuate with time and space due to inertia and viscous forces, which will generate several vortexes with different sizes. Because of the negative influence of the random vortexes, researchers proposed various methods to optimize the flow field. Sun et al.
*Corresponding author (email:
[email protected]) © Science China Press and Springer-Verlag Berlin Heidelberg 2013
tech.scichina.com
www.springerlink.com
Hao J H, et al.
Sci China Tech Sci
[7] optimized the flow field in the turbine transition section to improve the aerodynamic performance through genetic algorithm. Hiroyuki et al. [8] applied a global optimization method to design turbine inducers. Some other researchers [9–12] added some polymer into the fluid to change the flow boundary layer, and designed some micro-rib surfaces to optimize the flow field. In the above studies, researchers used the empirical and numerical methods to obtain a better design. However, for lack of theoretical guidance in optimization, it is hard and nearly impossible to obtain the optimal solution. Chen et al. [13] introduced the concept of the synergy between the velocity and the velocity gradient fields, proposed the field synergy principle in fluid flow, deduced the corresponding field synergy equation and applied this principle to the optimization design of a fluid flow process in parallel pipes and a heavy oil transport process [14]. Thereafter, Zuo [15] optimized the geometrical structure of a vapor ejector based on the field synergy principle of fluid flow. In this paper, we apply the field synergy principle of fluid flow to the optimization of a CSNS target cooling system. The optimal velocity field in the original geometrical structure of water flow channel is obtained by numerically solving the field synergy equation. With the guide of the optimal velocity field, the channel structure and the target shape are redesigned to improve the running stability of the target system.
2 Original target system Figure 1 shows the original structure of a target system consisting of a steel container and several tungsten target slices in the container. High-energy proton bombards the target slices through the beam window and generates neutrons as well as some charged particles through spallation reaction, which in turn results in heat generation. Then, the cooling water flowing through the slits between every two slices absorbs the generated heats from the tungsten target slices and the steel container to keep them at proper temperatures.
1371
June (2013) Vol.56 No.6
Figure 2 is the cross section (z=0 mm) of the tungsten target system. The height (z direction) and the width (x direction) of the target container are 86 and 260 mm, respectively. The thicknesses of the beam window and the container plate are 3 and 12 mm, respectively. The width (x direction) of the target is 170.6 mm, and the total thickness (y direction) of all the 10 tungsten target slices is 570 mm. The thicknesses of every slice are 28, 28, 34, 40, 50, 70, 80, 80, 80 and 80 mm, respectively. The widths of the inlet and outlet channel are both 32.7 mm. Meanwhile, there are 11 cooling water slits among the slices, the height and the width of which are 66 and 1.2 mm, respectively. The governing equations of the heat convection process in the target system are as follows: continuity equation
U 0,
(1)
U U P+ t U ,
(2)
momentum equation
and energy conservation equation
t T +S , Pr t
U T
(3)
where U is the velocity, is the density, is the molecular viscosity, t is the turbulent viscosity, P is the pressure, t is the turbulent Pr, S is the heat source in both the tungsten target and the steel container [16]. The RNG k– model gives the governing equation of tturbulent viscosity in the momentum equation:
U k
t k
k + Gk ,
(4)
where k is the turbulent kinetic energy, and is the dissipation rate of turbulent kinetic energy, the governing equation of which is
U
t + c G -c . k 1 k 2
(5)
In eqs. (4) and (5), c1, c2, k and ε are constants, while Gk is calculated by
Figure 1
Schematic diagram of the tungsten target system.
Figure 2
Cross section of the original target system (unit: mm).
1372
Hao J H, et al.
Gk
t
Sci China Tech Sci
June (2013) Vol.56 No.6
2 2 2 u v w 2 x y z 2
2
2
u v u w v w . y x z x z y
The software, FLUENT, is used for simulation, where the standard wall functions are applied and the inner heat source is added into the target and the container by the User Define Function. The velocity and pressure are linked using the SIMPLEC algorithm, with the convection and diffusion terms being discretized using the QUICK scheme (the same below). The two-dimensional computation model is used in the optimization processes for simplicity. In order to confirm that the results are independent with the grid number, we simulate the flow fields with different girds. The grid shown in Figure 3 satisfies the requirement for obtaining the grid independent solution. The mesh is more condense in the near wall regions, where more steep velocity gradient is expected. The smallest sizes of girds in the x and y directions are 0.5 and 0.1 mm, respectively. The total element of the grid is about 99148 (129 grids at x direction and 781 grids at y direction). When the inlet velocity of the cooling water is 1 m s1 and the pressure at the outlet is 4 bar, Figure 4 shows the schematic diagram of the cooling water flow field and a partially enlarged detail. The velocity field is uniform in the inlet channel, whereas, there are several vortexes with different scales in the outlet channel, especially in the area near the frontal slits (a, b, c, d, e). Figures 5 and 6 show the magnitude variation of volume-averaged velocity and pressure with time in the first slit (a) exit (zone A shown in the partially enlarged drawing of Figure 4). The velocity and pressure are unstable, and the
Figure 4
Flow field and the partially enlarged detail before optimization.
Figure 5 Magnitude variation of volume-averaged velocity with time in the original target system.
Figure 3
Schematic diagram of the grid.
Figure 6 Magnitude variation of volume-averaged pressure with time in the original target system.
Hao J H, et al.
Sci China Tech Sci
magnitude fluctuation is very large. The difference between the maximum and the minimum velocities is 0.35 m s1. The maximum fluctuation of pressure is about 800 Pa.
3
Fluid flow field synergy equation
According to the flow field synergy principle [13], the optimal velocity field can be obtained by minimizing the total mechanical energy diffusion with some constraints. This is a functional extremum problem. We use the Lagrange multipliers method to construct a function for a given set of constraints such as the mass continuity
= +B U dV ,
(6)
where B is the Lagrange multiplier, is the total mechanical energy diffusion function: u 2 v 2 w 2 = t 2 +2 +2 z x y 2
2
u v u w v w + + + + + y x z x z y
1373
June (2013) Vol.56 No.6
4 Optimization process of the channel structure Solving eqs. (1)–(5) and eq. (12) gives the optimal velocity field in the target system shown in Figure 7. Comparison of the velocity fields and the partially enlarged detail shown in Figures 4 and 7 indicates that the vortexes of cooling water almost disappeared in the flow field of the outlet channel after optimization. The flow field geometry can be redesigned by connecting the points where the velocity is almost zero as the channel boundaries. Figure 8 shows the shape of the flow channel. At this time, the curve function of the outlet boundary is (units: mm, the same below) y –0.0745 x 3 23.069 x 2 2386.7 x 82425, x 118, 88 .
In order to keep the geometrical structure of the inlet channel symmetric with that of the outlet channel, the curve function of the inlet channel boundary is redesigned as y 0.0745 x 3 23.069 x 2 +2386.7 x 82425,
2
.
(7)
The differential of with respect to B leads to eq. (1) (in the variation process, the turbulent viscosity coefficient is assumed constant in the flow field, the same below). The differential of with respect to the velocity vector U leads to 1 t U + B =0 . 2
(8)
x 88, 118 .
Figure 9 shows the cooling water velocity field and partially enlarged drawing in the channel structure. There are many vortexes in the outlet channel. Figure 10 is the magnitude variations of the volume-averaged velocity and the pressure with time in the first slit (a) exit (zone A shown in the partially enlarged drawing of Figure 4). Compared with Figures 5 and 6, the fluctuations of both velocity and pressure decrease, but still exist, and need further optimization. Based on the structure shown in Figure 8, solving eqs. (1)–
Meanwhile, the fluid flow must also satisfy the momentum conservation equation
U U =-P+ t U +F .
(9)
Comparing eqs. (8) and (9) gives the following relations: B = 2 P,
(10)
F =U U .
(11)
Combining eqs. (9) and (11) leads to
U U = P+ t U +U U .
(12)
In eq. (12), the additional volume force F is equal to the Reynolds time-averaged inertia force, and counteracts the Reynolds time-averaged inertial force during the fluid flow. The Navier-Stokes equation with this additional volume force is referred to as the field synergy equation. For given conditions, we can obtain the optimal flow field by solving this field synergy equation.
Figure 7 Diagram of the optimal velocity field and the partially enlarged detail in the original target system.
1374
Hao J H, et al.
Figure 8
Sci China Tech Sci
June (2013) Vol.56 No.6
Shape of the second target system.
Figure 9 Diagram of the velocity field and the partially enlarged detail in the second target system.
Figure 11 Diagram of the optimal velocity field and the partially enlarged detail in the second target system.
11, we seek the points, where the magnitudes of the velocity are close to zero, and connect them to a line as the boundary of the flow channel. The fitting function of the line is
y 0.0469 x3 14.671x 2 1501.2 x 50491 ,
(13)
where x is in the range of 118 to 88. Symmetrically, the fitting function of the inlet channel boundary is y 0.0469 x3 14.671x 2 1501.2 x 50491,
(14)
where x is in the range of 88 to 118. In practical application, the boundary fitting function is replaced with the partition function for simple manufacture, Figure 10 Magnitude variations of the volume-averaged velocity and pressure with time in the second target system.
(5) and eq. (12), we get the optimal flow streamlines of the cooling water shown in Figure 11. In the flow field of the outlet channel shown in Figure
y = 24.87 x 2355.4, x 118, 99.3 ,
(15)
y = 14.06 x 1282.0, x 99.3, 91.4 .
(16)
The inlet channel boundary is replaced by y =14.06 x 1282.0, x 91.4, 99.3 ,
(17)
Hao J H, et al.
y =24.87 x 2355.4, x 99.3, 118 .
Sci China Tech Sci
June (2013) Vol.56 No.6
1375
(18)
When x ranges from 91.4 to 87.4 or from 87.4 to 91.4, and y ranges from 1.2 to 2.8, the boundary of the channel is two circular arcs with the radius of 4 mm, and the coordinates of the centers are (87.4, 2.8) and (87.4, 2.8), respectively. In order to maintain the thickness of target container plate almost uniform, the shape of the container is changed based on the flow channel y =21.654 x 2236.2, x 103.4, 130 ,
(19)
y = 21.654 x 2236.2, x 130, 103.4 .
(20)
When x ranges from 103.4 to 87.4 or from 87.4 to 103.4, and y ranges from 13.2 to 2.8, the boundary of the channel is two circular arcs with the radius of 16 mm, and the coordinates of centers are (87.4, 2.8) and (87.4, 2.8), respectively. Figure 12 shows the diagram of the optimized target container and the corresponding flow channel.
Figure 13
Velocity field distribution in the optimized target structure.
5 Optimized results and discussions Figure 13 presents the velocity field and partially enlargement in the flow channel after optimization. Compared with Figure 4, the vortexes near the slits exits almost vanish. Figure 14 shows the magnitude variations of the volume-averaged velocity and the pressure with time in the first slit (a) exit (zone A shown in the partially enlarged drawing of Figure 4). Compared with Figures 5, 6 and 10, the magnitudes of the velocity and the pressure are almost invariance with time. Figure 15 shows the volume flow rates in the parallel slits. For the original target structure, the volume flow rate in each slit is uniform. In the optimized target structure, the volume flow rate in the slits near the inlet is higher than that in the slits farther from the inlet, but the difference is very small. Therefore, it can be considered that the volume flow rates in every slit are still almost uniform. Table 1 gives the heat transfer performance of the original and optimized target system. The cooling water temperature rise, the maximum temperature of the target and the maximum temperature of the target container are almost
Figure 14 with time.
Magnitude variation of volume-averaged velocity and pressure
Figure 15
Figure 12
Diagram of the optimized target system.
Comparison of the volume flow rates.
invariable before and after optimization, which demonstrates that the heat transfer performance of the target system is the same. Because the cross-section area is smaller after changing
1376
Hao J H, et al.
Sci China Tech Sci
Table 1 Comparison of the heat convection performance before and after optimization Content Pressure drop (kPa)
Original structure Optimized structure 16.235
16.605
Max. velocity (m s1)
3.89
3.83
Max. temperature of target (°C)
200.7
201.1
Temperature rise (°C)
7.55
7.55
Max. temperature of water (°C)
132.1
131.4
June (2013) Vol.56 No.6
1
2
3
4
5
the flow channel shape, the pressure drop of the cooling water in the system increases by 2.28 % after optimization. In summary, the optimized flow structure improves the running stability of the target system.
6 Conclusion Field synergy principle of flow is applied to the optimization of the CSNS target cooling system. The optimal velocity field in the original geometrical structure of water flow channel is obtained by numerically solving the field synergy equation. With the guide of the optimal velocity field, the channel structure and the target shape are redesigned. In the optimized structure, the vortex sizes decrease, the time fluctuations of the velocity and the pressure almost vanish, and the volume flow rates in every slit are almost the same. Therefore, the optimization design effectively improves the running stability of the target system with the premise of satisfying the heat transfer requirement of the target system. The work was supported by the National Natural Science Foundation of China (Grant Nos. 51006060, 51036003) and the Foundation for the Author of National Excellent Doctoral Dissertation of China (Grant No. 201150).
6
7
8 9
10 11
12
13 14
15
16
Institute of High Energy Physics of the Chinese Academy of Sciences. China Spallation Neutron Source (in Chinese). CAS Bull, 2011, 26(6): 725–727 Zhang J. China Spallation Neutron Source—Multi-science application greatly scientific platform (in Chinese). National Key S&T Infrastr Proj, 2006, 21(5): 415–417 Hu X D, Chen S W, Zeng Z F et al. Neutron Scattering and Spallation Neutron Source in China (in Chinese). J Dongguan Univ Technol, 2007, 14(5): 43–46 Wang F W, Liang T J, Yin W, et al, Conceptual design of target station and neutron scattering spectrometers for the Chinese Spallation Neutron Source (in Chinese). Nuclear Tech, 2005, 28(8): 593–597 Broome T. High power targets for spallation sources. In: Process of 1996 European Accelerator Conference. Sitges, 1996 Du J H. The thermal design of tungsten target for 100 kW Neutron Spallation Source (in Chinese). Mach Des Manuf, 2008, 10(10): 85–86 Sun Z G, Huang H Y, Tan C Q, et Al. Optimization design for the turbine transition section of an aeroengine (in Chinese). J Eng Thermophys, 2008 29(6): 940–942 Kawagishi H, Kudo H. Development of global optimization method for design of turbine stages. ASMEGT2005–68290, 2005 Li P W, Kawaguchi Y, Yabe A. Transitional heat transfer and turbulent characteristics of drag-reducing flow through a contracted channel. J Enhanc Heat Transf, 2001, 8(1): 23–40 Gaudet L. Properties of riblets at supersonic speed. Appl Sci Res, 1989, 46(3): 245–254 Neumann D, Dinkelacker A. Drag measurements on v-grooved surfaces on a body of revolution in axial flow. Appl Sci Res, 1991, 48(1): 105–114 Wang J J, Lan S L, Chen G. Experimental study on the turbulent boundary layer flow over riblets surface. Fluid Dyn Res, 2000, 27(4): 217–229 Chen Q, Ren J X, Guo Z Y. Field synergy principle and its application to flow drag reduction. Chin Sci Bull, 2008, 53(4): 489–492 Chen Q, Wang M R, Pan N, et al. Optimization principle for variable viscosity fluid flow and its application to heavy oil flow drag reduction. Energy Fuels, 2009, 23(9): 4470–4478 Zuo J X. Study on the optimal design of the vapour ejector with field synergy principle (in Chinese). Dissertation for Master Degree. Dalian: Dalian University of Technology, 2012. 1–10 Hao J H, Chen Q, Lu Y L, et al. Thermal design of Spallation Neutron Source target system (in Chinese). In: Chinese Society of Engineering Thermophysics Conference. Dongguan: Chinese Society of Engineering Thermophysics, 2012