ANALYTICAL SCIENCES MAY 2004, VOL. 20 2004 © The Japan Society for Analytical Chemistry
837
Flow-Injection and Sequential-Injection Determinations of Paracetamol in Pharmaceutical Preparations Using Nitrosation Reaction Rodjana BURAKHAM,* Supunnee DUANGTHONG,* Lop PATIMAPORNLERT,* Narong LENGHOR,* Suphaphorn KASIWAD,* Lalida SRIVICHAI,* Somchai LAPANANTNOPPAKHUN,*,** Jaroon JAKMUNEE,*,** and Kate GRUDPAN*,**† *Department of Chemistry, Faculty of Science, Chiang Mai University, Chiang Mai 50200, Thailand **Institute for Science and Technology Research and Development, Chiang Mai University, Chiang Mai 50200, Thailand
A simple FI and two different SI systems have been investigated for the determination of paracetamol by employing a simple reagent for a nitrosation reaction. It is based on the on-line nitrosation of paracetamol with sodium nitrite in an acidic medium. The formed nitroso derivative species reacts further with sodium hydroxide to convert it to a more stable compound. The yellow product is continuously monitored at 430 nm. The FI system is very simple and cost effective for fast manual operation (60 injections/h; y = 0.268x + 44.314, r2 = 0.9910 for 400 – 1000 mg/l and y = 0.1687x + 145.72, r2 = 0.9970 for 1000 – 2500 mg/l). The two SI systems with different components and configurations are automated and optimized for the conditions for which no extra dilution is to be required for sample handling: one with a syringe pump and two selection valves (60 samples/h; y = 0.1488x – 4.7297, r2 = 0.9946 for 400 – 1000 mg/l and y = 0.0858x + 63.933, r2 = 0.9849 for 1000 – 2500 mg/l); the other is simpler and more cost-effective, with an autoburette and only one selection valve (15 samples/h; y = 0.0072x + 1.1467, r2 = 0.9977 for 200 – 1000 mg/l and y = 0.0028x + 5.4699, r2 = 0.9879 for 1000 – 2500 mg/l). They have all been applied to assay paracetamol in pharmaceutical preparations. The obtained results agree with those by the US Pharmacopeia method. (Received August 21, 2003; Accepted December 3, 2003)
Introduction Paracetamol is an extensive analgesic and antipyretic drug. Several batch methods have been reported for the determination of paracetamol in pharmaceutical preparations, such as spectrophotometry,1–6 reflectance near-infrared spectroscopy,7 chemiluminescence8 and liquid chromatography.2 A number of flow-injection (FI) methods have also been reported for the determination of paracetamol, such as FI-spectrophotometry, using different on-line derivatization reactions. However, the control of such reactions and/or manifolds is still complicated.9–12 Some methods, such as FI-FTIR13 and FI with a boron-doped diamond thin film electrode,14 involve relatively higher cost instruments. A further generation of FIA, SIA is a great potential technique for chemical analysis due to much less reagent consumption, its simplicity and convenience with which manipulation can be automated. So far, an SI procedure for paracetamol determination has been reported. It is based on a reaction with hexacyanoferrate(III), followed by a reaction with phenol at elevated temperature in aqueous ammonia.15 Simple and inexpensive spectrophotometric flow-injection and sequential-injection systems for the determination of paracetamol using simple reagents based on preliminary † To whom correspondence should be addressed. E-mail:
[email protected]
concepts introduced at the ICFIA 2001 Conference,16 are presented. The procedures employ the reaction of paracetamol with nitrous acid at room temperature, producing a derivative.
Experimental Chemicals and reagents All of the reagents used were of analytical reagent grade. Deionized water was used throughout the experiments. A stock solution (5000 mg/l) of 4-acetaminophenol standard (paracetamol, Fluka, Switzerland), which was assayed using the USP method,18 was prepared by dissolving 0.5146 g of the standard in water and diluting to the mark in a 100 ml volumetric flask. Working standards were freshly prepared by diluting the stock solution with water to obtain appropriate concentrations. Sample preparation Some locally commercial pharmaceutical preparations were taken as samples to be assayed. For tablet samples, 20 tablets were accurately weighed and finely powdered. An amount of the powder equivalent to a tablet was dissolved in water. After stirring for 15 min at a temperature of 60 – 70˚C, the volume was made to 250 ml. The solution was then filtered before analysis. Further appropriate dilutions for FIA procedures were made using water. For a syrup sample, an aliquot corresponding to 200 mg of paracetamol was diluted to 100 ml
838
ANALYTICAL SCIENCES MAY 2004, VOL. 20
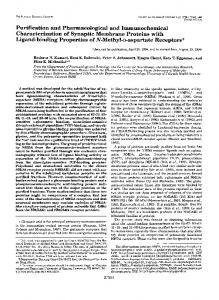
Fig. 2 Schematic paracetamol.1
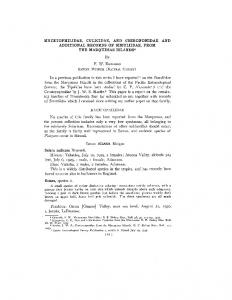
Fig. 1 Schematic diagrams of FI/SI systems for determination of paracetamol: (a) FIA, (b) SIA-I and (c) SIA-II. P, pump; C, carrier; HC, holding coil; MC, mixing coil; IV, injection valve; V, selection valve; D, detector; R, recorder; W, waste.
and then filtered. FI system The FI system, similarly to the previously reported one,16 which is more simple than that described by Knochen et al.,19 consisted of a peristaltic pump (Ismatec, Switzerland), a six-port injection valve (V-451, Upchurch), a reaction coil, a colorimeter (Cole Parmer, USA) with a flow through cell (Hellma, Germany) of 1 cm light path and a recorder (Philips PM 8251, Holland), as shown in Fig. 1(a). Through an injection valve, a solution containing paracetamol was injected into a HCl carrier and merged with NaNO2 to form the nitroso derivative, which was subsequently stabilized with NaOH. The absorbance of the formed product was continuously recorded at a wavelength of 430 nm, and the peak height was used for an evaluation. SI systems Two SI systems were investigated. Both systems were aimed for operation with minimum steps in sample handling, such as no requirement for further dilution of the sample stock solution. The first one (SIA-I) was a SI Analyser (Laboratory made, Turku Center for Biotechnology, University of Turku and Åbo Akademi University, Finland) consisting of a 2500 µl syringe pump (Cavro), two six-port selection valves (Cavro), a holding coil (200 cm × 0.6 mm i.d.), a reaction coil (100 cm × 0.6 mm i.d.) and using a Spectronic 21 (Bausch & Lomb, USA) as a detector with a flow-through cell (Hellma, Germany) of 1 cm light path, as shown in Fig. 1(b). A personal computer was used for instrumental control, data acquisition and evaluation via a Lab PC+ interface card (National Instruments) and an AnalySIA program (The Biosense Team). The second SI system (SIA-II) used is schematically depicted in Fig. 1(c). It consisted of an autoburette Dosimat 765
diagram
of
the
nitrosation
reaction
of
(Metrohm, Switzerland) equipped with a 10 ml exchange unit, for a pumping system, and connected to a personal computer via an RS232C interface, a 10-position selection valve VICI with a microelectric actuator (Valco Instruments, USA) and a Spectronic21 (Bausch & Lomb, USA) detector with a flowthrough cell (Hellma, Germany) of 1 cm light path. The autoburette was connected to the center of the selection valve by means of a holding coil (250 cm × 1.27 mm i.d. Tygon tubing). A mixing coil (30 cm × 0.79 mm i.d. PTFE tubing) was placed between the selection valve and the detector. Both instrumental control and data acquisition were manipulated via software using LabVIEW, developed in-house and using a CYDAS ULV interfacing board (CyberResearch, USA). This software provided control of the volume to be dispensed or aspirated by the autoburette, flow rate, selection of the different valve positions and performed data acquisition. The data processing was computed by using MATLAB. The SI operation steps were as follows: firstly, the manifold lines were washed with water, and all of the reagents were filled into the ports of the selection valves. Then, suitable volumes of the reagents were sequentially aspirated and stacked as zones in a holding coil. Finally, these zones were propelled through a reaction coil. A zone penetration occurred. The absorbance of a product zone was continuously monitored at a wavelength of 430 nm.
Results and Discussion The FIA The flow system and chemical variables were investigated. Optimization studies were carried out for each individual variable and optimum values were selected. The effect of the mixing coil length, which influenced both the sensitivity (i.e. slope of a plot of concentration (mg/l) of paracetamol vs. peak height) of the method and the sampling frequency, was studied. The lengths of mixing coils between 50 – 280 cm were examined. A longer mixing coil resulted in increasing the sensitivity as a result of promoting better mixing of the sample and reagent. A mixing coil of 200 cm was selected for further experiments due to the linearity and sensitivity. By fixing the flow-system variables (mixing coil length, 200 cm; flow rate, 2.0 ml/min and sample volume, 70 µl), the influence of the chemical variables was studied by varying the concentrations: NaOH (0.03 – 0.10 mol/l), HCl (0.03 – 0.15 mol/l) and NaNO2 (0.01 – 0.14 mol/l). The conditions were selected to be 0.10, 0.07 and 0.07 mol/l for NaOH, HCl and NaNO2, respectively. The SIA-I By using the SIA-I system, the sequence order of aspiration was firstly optimized to ensure good mixing of the sample zone with all of the reagents involved. Several sequence orders were examined and a suitable one that provided a good peak shape and high sensitivity (better response) was selected. The selected
ANALYTICAL SCIENCES MAY 2004, VOL. 20 Table 1 Selected conditions of the SIA-I system for the determination of paracetamol Sequence
Valve no.
Position
Volume/µl
1
2
1
200
2
1
6
75
3
1
2–5
10
4
2
1
100
5
2
3
250
6
1, 2
1, 2
2500
Description Aspirate 0.05 mol/l HCl into HC Aspirate 0.1 mol/l NaNO2 into HC Aspirate sample into HC Aspirate 0.15 mol/l NaOH into HC Aspirate 0.05 mol/l HCl into HC Pump to detector with flow rate of 9 ml/min
sequence of the sample and the reagent zones was created by first aspirating. HCl into a holding coil, then, NaNO2 and the standard/sample were inserted to the acid zone to increase mixing of the sample and the reagents. In this step, a nitroso derivative compound was formed. NaOH was finally aspirated to stabilize the product before detection of the signal. Although some reported that the reaction product was a nitro derivative,17,19 there has been a report mentioning the product being a nitroso derivative.1 A study on the formation of metal chelates of such a reaction product indicated that the formation of a nitroso derivative of acetaminophen is more probable than the nitro derivative.1 According to the nitrosation reactions1 of paracetamol, as shown in Fig. 2, the nitroso derivatization of paracetamol and NaNO2 should take place under an acidic condition. Therefore, the NaNO2 zone should overlap with the sample and the HCl zone to ensure an acidic medium for efficient forming of the nitroso compound before being stabilized by the NaOH zone to convert it into another species, to be monitored for absorbance. It was found that the best sequence was to sandwich the sample and the NaNO2 zones with two HCl zones. The concentrations of the three reagents (NaNO2, HCl and NaOH) involved in the reactions were optimized. A series of concentrations of a single reagent was varied, while the others were kept constant. The reagent concentrations giving high sensitivity and good linearity were selected by considering a regression equation (i.e. slope and r2-value) for a plot of the concentration of the paracetamol vs. peak area. The trends of the reagent concentrations were quite similar to those obtained from the FI system. However, it is not convenient to work with high concentrations of NaOH, since the Schlieren effect would have a great influence. The effects of the reagent and sample volumes were evaluated by varying the volumes of NaOH (100 – 300 µl), HCl (100 – 350 µl), NaNO2 (50 – 200 µl) and the sample (5 – 50 µl). An increase in the reagent and sample volumes resulted in increased sensitivity. However, a poor sensitivity was obtained by using a very high volume, probably due to less zone overlap. In addition, the flow rate was optimized to achieve a good analytical signal and sensitivity. The selected conditions are summarized in Table 1. SIA-II Although the SIA-I system could be successfully applied to the determination of paracetamol, another SIA set-up with more
839 Table 2 Selected conditions of the SIA-II system for the determination of paracetamol Sequence
Valve position
Mode
Volume/µl
Description
1
5
PIPa
300
2 3
6 2
DIS Cb PIP
110 110
4
3 – 4, 7 – 9
PIP
20
5
6
PIP
110
6
10
PIP
250
7
6
DIS C
5000
Aspirate 0.05 mol/l HCl into HC Dispense HCl Aspirate 0.10 mol/l NaNO2 into HC Aspirate sample into HC Re-aspirate HCl (sequence 2) Aspirate 0.20 mol/l NaOH into HC Dispense to detector with flow rate of 30 ml/min
a. Pipetting. b. Cumulative dispensing.
Table 3
Analytical characteristics of the proposed methods
Parameter Linear range (mg/l), r
FIA
SIA-I
SIA-II
2
400 – 1000, 400 – 1000, 200 – 1000, 0.9991 0.9946 0.9977 1000 – 2500, 1000 – 2500, 1000 – 2500, 0.9970 0.9849 0.9879 3a,b 4a,b %RSD (n = 11) 2a Detection limit (mg/l) 45 70 65 60 60 15 Sampling frequency (h–1)
a. At 2000 mg/l. b. Without extra dilution for sample handling.
cost effective considerations was investigated. Instead of a syringe pump, an autoburette was used, and only one 10-port selection valve was employed. Optimization was studied. The optimum conditions are described in Table 2. Analytical characteristics An evaluation of the analytical characteristics of all the proposed procedures was carried out by studying the linear range, precision, detection limit and sample frequency, as summarized in Table 3. The precision of each proposed procedure was studied. When using a standard (2000 mg/l), the RSDs for SIA procedures with no dilution for sample handling were less than 4%. RSDs of less than 1% for a particular case could be obtained by altering some conditions, which should be useful for the routine quality control of a particular formula of pharmaceutical preparation. The precision of such a procedure was tested daily for 5 days. It was found that the RSDs were also within 4%. By using the FI method, the effect of foreign compounds that can be found in phamaceutical preparations containing paracetamol was also studied. Chlorphenramine maleate with a concentration of up to 80 mg/l was tested for the determination of paracetamol (2000 mg/l). The results showed that the presence of chlorphenramine did not interfere with the determination of paracetamol. The accuracy of the proposed methods was evaluated by analyzing real samples. The results agreed with those obtained
840
ANALYTICAL SCIENCES MAY 2004, VOL. 20
Table 4 Determination of pharmaceutical preparations
paracetamol
in
some
References %Label
Sample
1 2 3 4 5 6 7 8 9 10 11
Type of preparation
FIA
SIA-I
SIA-II
Standard method18
Tablet Tablet Tablet Tablet Tablet Tablet Tablet Tablet Tablet Suspension Syrup
99 98 102 95 100 107 104 107 106 108 105
97 98 101 100 105 90 98 99 98 102 102
97 98 101 100 105 90 98 99 103 95 101
92 92 94 93 96 98 91 94 92 92 92
by the standard method (Table 4).18 Application to samples The three proposed systems (FI, SIA-I and SIA-II) were applied to the determination of paracetamol in pharmaceutical preparation samples. Each sample was prepared to obtain solutions having concentrations of ca. 700 and 2000 mg/l of paracetamol. For SIA procedures, no sample dilution was made. The obtained results are summarized in Table 4. The evaluation by a t-test at the 95% confidence level indicates that there is no significant difference in the results obtained by the proposed and standard methods.
Acknowledgements We thank the Thailand Research Fund (TRF) and the Postgraduate Education and Research Program in Chemistry (PERCH). The Ministry of University Affairs is gratefully acknowledged for a scholarship to RB. Thanks are due to the Turku Center for Biotechnology, University of Turku and Åbo Akademi University, Finland, for the on-loan SIA-I set-up.
1. S. F. Belal, M. A-H. Elsayed, A. Elwality, and H. Abdine, Analyst, 1979, 104, 919. 2. N. Erk, Y. Ozkan, E. Banoglu, S. A. Ozkan, and Z. Senturk, J. Pharm. Biomed. Anal., 2001, 24, 469. 3. E. Dinc, D. Baleanu, and F. Onur, J. Pharm. Biomed. Anal., 2001, 26, 949. 4. E. Dinc, G. Kokdil, and F. Onur, J. Pharm. Biomed. Anal., 2001, 26, 769. 5. A. R. Medina, M. L. F. Cordava, and A. Molina-Diaz, J. Pharm. Biomed. Anal., 1991, 21, 983. 6. M. J. A. Canada, M. I. P. Reguera, A. R. Medina, M. L. F. Cordova, and A. M. Diaz, J. Pharm. Biomed. Anal., 2000, 22, 59. 7. A. D. Trafford, R. D. Jee, A. C. Maffat, and P. Graham, Analyst, 1999, 124, 163. 8. A. G. Alapont, L. L. Zamora, and J. M. Calatayud, J. Pharm. Biomed. Anal., 1999, 21, 311. 9. M. L. Ramos, J. F. Tyson, and D. J. Curren, Anal. Chim. Acta, 1998, 364, 107. 10. Z. Bouhsain, S. Garrigues, A. Morales-Rubio, and M. Guardia, Anal. Chim. Acta, 1996, 330, 59. 11. K. K. Verma, A. Jain, and K. K. Stewant, Anal. Chim. Acta, 1992, 261, 261. 12. P. Ortega-Barrales, R. Padilla-Weigand, and A. MolinaDiaz, Anal. Sci., 2002, 18, 1241. 13. Z. Bouhsain, S. Garrigues, and M. Guardia, Analyst, 1996, 121, 635. 14. N. Wangfuengkanagul and O. Chailapakul, J. Pharm. Biomed. Anal., 2002, 28, 841. 15. J. F. van Staden and M. Tsanwani, Talanta, 2002, 58, 1095. 16. K. Grudpan, S. Lapanantnoppakhun, S. Duangthong, L. Srivichai, S. Kasiwad, and J. Jakmunee, in The Abstract Book and Program of the 11th International Conference on Flow Injection Analysis, Including Related Techniques, Chiang Mai, Thailand, December, 2001, 91. 17. L. Chafetz, R. E. Daly, H. Schriftman, and J. J. Lomner, J. Pharm. Sci., 1971, 60, 463. 18. The United States Pharmacopeia, 24th ed., United States Pharmacopoeial Convention, Inc., Rockville, 2000, 14 – 16. 19. M. Knochen, J. Giglio, and B. F. Reis, J. Pharm. Biomed. Anal., 2003, 33, 191.