Jan 18, 2006 - We show that colloidal particles with attractive interactions induced by a ... diffusing clusters of particles persist in steady state. ..... Matter. 16, S4877 (2004). [8] A. Yethiraj and A.V. Blaaderen, Nature (London) 421,. 513 (2003).
PRL 96, 028306 (2006)
PHYSICAL REVIEW LETTERS
week ending 20 JANUARY 2006
Fluids of Clusters in Attractive Colloids Peter J. Lu,1 Jacinta C. Conrad,1 Hans M. Wyss,2 Andrew B. Schofield,3 and David A. Weitz1,2 1
Department of Physics, Harvard University, Cambridge, Massachusetts 02138, USA 2 DEAS, Harvard University, Cambridge, Massachusetts 02138, USA 3 Department of Physics and Astronomy, University of Edinburgh, Edinburgh, Scotland EH9 3JZ, United Kingdom (Received 16 August 2005; published 18 January 2006) We show that colloidal particles with attractive interactions induced by a nonadsorbing polymer exhibit a stable phase consisting of a fluid of clusters of particles. This phase persists even in the absence of any long-range repulsion due to charge, contrary to expectations based on simulation and theory. Cluster morphology depends strongly on the range of the interparticle attraction: With a shorter range, clusters are tenuous and branched; with a longer range, they are more compact. DOI: 10.1103/PhysRevLett.96.028306
PACS numbers: 82.70.Dd, 61.43.Hv, 64.70.Ja, 82.70.Gg
Mixing a nonadsorbing polymer with a colloidal suspension can induce an effective attraction interaction between the particles, leading to very rich phase behavior [1,2]. This system also can serve as an excellent model of attractive suspensions of complex fluids encountered in technological applications such as food and personal care products, where the attractive interaction may significantly impact product stability and shelf life. Colloid-polymer mixtures are convenient for these studies: Both the range and magnitude of the attractive interaction can be precisely controlled, and the constituent colloids are large enough to be imaged with light, while still small enough to have their dynamics driven by kB T, the thermal energy. With sufficient polymer, these mixtures form nonequilibrium gels, networks of particles that percolate across the sample to form a solid [3]. Though the exact mechanism is not well understood, aggregation of particles into clusters is a precursor to gelation. Cluster formation may be driven by phase separation, where the system lowers its free energy by splitting into two phases, a colloid-poor gas and a colloid-rich liquid [4]; alternatively, clusters may grow when particles stick irreversibly upon approach in the kinetic process of diffusion-limited cluster aggregation (DLCA) [5]. Clusters are expected to be transient in both cases: In phase separation, cluster growth is thermodynamically favored and either proceeds to completion, where all clusters have merged into one liquid droplet, or kinetically arrests to form a gel [4]; in DLCA, clusters grow and merge until forming a connected cluster that spans the system [5]. In neither case should multiple freely diffusing clusters of particles persist in steady state. Nonetheless, experiments have found stable diffusing clusters in regions of phase space near the gel transition line [3]. This contradicts the expectation that colloid-polymer mixtures should either phase separate or gel. One resolution to this dilemma is that the colloidal particles are charged [6]. After clusters grow to a certain size, they accumulate enough charge to repel additional particles; this long-range repulsion introduces a second length scale, the characteristic maximum cluster size [4]. Indeed, theories for stable clusters generally require long-range repul0031-9007=06=96(2)=028306(4)$23.00
sion [7], which has been observed experimentally to have significant effects in colloid-polymer mixtures [8–10]. These results apparently resolve how an equilibrium fluid of clusters can form: the competition between short-range attraction and long-range Coulombic repulsion. In this Letter, we report the observation of fluids of colloidal clusters in which long-range Coulombic repulsion does not play a role. These buoyancy-matched clusters are stable, diffuse freely, and neither phase separate nor form a percolated gel on experimental time scales. Their morphology depends on the range of interparticle attraction: With a longer range, the clusters are compact; with a shorter range, they are more branched and fractal-like. We suspend sterically stabilized colloidal spheres of polymethylmethacrylate (PMMA) in a solvent mixture of decahydronaphthalene (DHN) and either bromocyclohexane (CXB) or bromocycloheptane. The solvent matches PMMA’s index of refraction, enabling the use of light scattering and confocal microscopy; it also matches PMMA’s density, preventing gravitational sedimentation that shears particle aggregates. The solvent has dielectric constant ! ! 7 and Bjerrum length "B ! 8 nm; "B is the distance in a dielectric medium at which the electrostatic interaction energy between two monovalent charges is equal to kB T. To screen any long-range electrostatic repulsion that can arise between colloids in these solvents [8], we add 4 mM of the organic salt tetrabutyl ammonium chloride (TBAC). We measure the solution’s conductivity to be 20 #S=m, and, assuming TBAC’s hydrodynamic radius is 1 nm, we estimate a Debye screening length of 12 nm [11]. Thus, any long-range Coulombic repulsion is completely screened. We add nonadsorbing linear polystyrene (PS) to induce a depletion attraction between PMMA spheres and vary the molecular weight Mw (amu) and free-volume concentration cp (mg PS per mL of solvent, corrected for colloid volume fraction $ [1]). Our mixture is a good solvent for PS, so increasing the number of PS coils in a fixed volume decreases their size; we therefore use static light scattering to measure the concentration-dependent polymer radius rp and report the size ratio % ! rp =a, where a is the colloid
028306-1
2006 The American Physical Society
PRL 96, 028306 (2006)
PHYSICAL REVIEW LETTERS
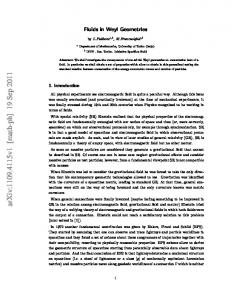
radius. Our interparticle potential has two parts, a hardcore repulsion for r < 2a and an attraction for 2a < r < 2"1 # %$a, which we calculate using the Asakura-Oosawa model: When two colloids touch, the strength of their attraction is U ! PV, where V is the volume excluded to polymers between the spheres, a geometric factor depending only on a and % [2], and U is measured in units of kB T. The polymer osmotic pressure P is determined by integrating the polymer osmotic compressibility measured with light scattering [12]. Because charge has been screened, the interparticle potential is dominated by the hard-sphere repulsion and the depletion attraction; any electrostatic repulsion is restricted to a very short range. We explore the bulk phase behavior using dynamic light scattering, where the macroscopic sample volume provides good statistics for a large number of particles. We use particles with a ! 136 nm at $ ! 0:15 and PS with Mw ! 2:0 % 106 , yielding % & 0:15. We collect the light scattered from a laser operating at a wavelength of " ! 514:5 nm in vacuo, and we measure the intensity autocorrelation function to determine the dynamic structure factor f"q; t$. We normalize the delay time as t&0 =&, where &0 and & are the viscosities of background solvent and polymer solution, respectively. The normalized scattering vector qa ! 3:52 is chosen at the peak in the static structure factor corresponding to the nearest-neighbor separation, though behavior is similar at nearby scattering vectors. For the sample with no polymer, where U ! 0, f"q; t$ follows the exponential decay of a suspension of colloids (solid line, Fig. 1), and our calculated diffusion coefficient agrees with the value expected at $ ! 0:15 when hydrodynamic interactions are included [13]. At increased polymer concentration, the decay time increases, and f"q; t$ becomes somewhat nonexponential (dotted line, Fig. 1), consistent with a broader distribution of time scales and, hence, a broader size distribution of diffusing species. Upon addition of yet more polymer, f"q; t$ decorrelates even more slowly, though still fully (dashed line, Fig. 1). That particle motion is slowed suggests they are aggregated; that particle motion is not fully arrested suggests they are not gelled. To elucidate the structure of these colloid-polymer mixtures, we use confocal microscopy to image similar samples at the single-particle level. The particles used for light scattering are too small to image; we instead use
FIG. 1 (color online). Dynamic structure factor f"q; t$ at qa ! 3:52 versus viscosity-corrected delay time t&0 =& for samples at $ ! 0:15. Solid line: cp ! 0, U ! 0; dotted line: cp ! 6:23, % ! 0:17, U ! 2:3; dashed line: cp ! 7:62, % ! 0:15, U ! 2:6.
week ending 20 JANUARY 2006
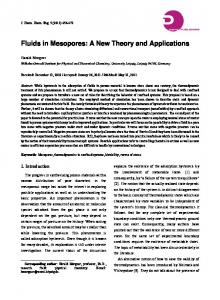
larger spheres with a ! 574 nm and labeled with fluorescent Nile Red dye in CXB/DHN. Our spinning Nipkow disk confocal system operates with a laser at " ! 532 nm and collects images fast enough to capture the threedimensional structure before the colloids diffuse significantly. A major challenge is keeping larger particles neutrally buoyant: A sphere’s Stokes velocity scales as a2 , so the colloids used in imaging may settle an order of magnitude faster than those used in light scattering. We add CXB or DHN dropwise to ensure that particles remain in suspension after centrifugation at 100g for 12 hours. Adding a &10 mg drop of CXB to a balanced &1 g sample causes the colloid to sediment after centrifugation, implying that the PMMA and solvent densities are matched to !'=' ' 1:1 % 10(3 . Because the volume thermal expansion of organic liquids (&10(3 =) C [14]) is much greater than that of solid PMMA (2:5 % 10(4 =) C [15]), a given solvent ratio will match the colloid density only over a narrow temperature range. Thus, we further improve our buoyancy match by keeping both centrifuge and microscope at 27 * 0:2) C, limiting density fluctuations from thermal expansion to !'=' ' 1:5 % 10(4 . We can thus keep single particles and small clusters of less than &100 particles from sedimenting for weeks, while larger clusters with thousands of particles do not sediment for several days. We explore structure and behavior varying $ and %. In samples at $ ! 0:15 with a ‘‘long’’ polymer (% & 0:15, Mw ! 11:4 % 106 ), corresponding to $ and % of the samples used in light scattering, we find three distinct phases. At the lowest polymer concentration, we observe a homogeneous fluid of single particles [Figs. 2(a) and 2(d)] with no large clusters. At the highest polymer concentration, we observe a connected gel [Figs. 2(c) and 2(f)] where all particles are part of a single space-spanning cluster. At an intermediate polymer concentration, we observe something qualitatively different: Interspersed throughout a fluid of predominantly single particles are compact clusters with thousands of particles each [Figs. 2(b) and 2(e)]. These clusters neither form a network structure with internal holes nor percolate, remaining geometrically distinct from a gel at all times. Confocal microscopy thus confirms that a stable phase of a fluid of clusters exists, even in the absence of a long-range repulsion due to electrostatic interactions. Cluster morphology depends strongly on % but not on $. In a long-polymer sample at a lower $ ! 0:04, we observe compact clusters with thousands of colloidal particles [Fig. 2(g)], similar morphology to that at $ ! 0:15 [Fig. 2(b)]. By contrast, while we also find the same fluid, gel, and cluster phases at shorter %, clusters in samples with smaller polymers have dramatically different morphologies. In samples at $ ! 0:04 with a ‘‘short’’ (% & 0:02, Mw ! 6:67 % 105 ) polymer, the far smaller clusters are more tenuous and branched [Fig. 2(i)]. By comparison, in samples at $ ! 0:04 with a ‘‘medium’’ (% & 0:04, Mw ! 3:07 % 106 ) polymer, the clusters have a size and degree of
028306-2
PRL 96, 028306 (2006)
PHYSICAL REVIEW LETTERS
week ending 20 JANUARY 2006
FIG. 2 (color online). (a) –(c) 2D confocal microscope images "60 #m$2 and (d)–(f) 3D reconstructions "60 #m$3 of colloidpolymer samples with $ ! 0:15 and long-polymer depletant. For 3D data, particles in clusters with + 500 particles are shown at actual size; remaining particles are shown at 1=5 actual radius. (a),(d) Homogeneous fluid of single particles (cp ! 0:34, % ! 0:17, U ! 0:9); (b),(e) fluid of clusters (cp ! 0:67, % ! 0:15, U ! 1:6); (c),(f ) percolated gel (cp ! 1:31, % ! 0:11, U ! 2:7). (g)–(i) Twodimensional confocal images of clusters at $ ! 0:04, with different polymer sizes. (g) Long polymer (cp ! 1:24, % ! 0:11, U ! 2:6). (h) Medium polymer (cp ! 4:92, % ! 0:04, U ! 10). (i) Short polymer (cp ! 9:83, % ! 0:02, U ! 12).
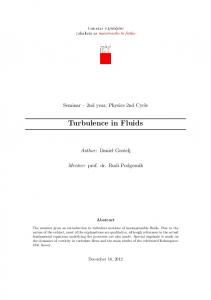
branching intermediate between the short- and longpolymer samples [Fig. 2(h)]. To quantify the differences in how these clusters fill space, so apparent in Fig. 2, we determine their fractal dimension df . We examine how the number of particles in a cluster N scales with radius of gyration Rg for all clusters d in a sample; we find a power-law dependence N ! Rgf . We also roughly estimate df within individual large clusters in each sample, by counting the number of particles enclosed within spheres of increasing radius centered at the cluster center-of-mass. Both methods yield the same estimate for df . For the compact clusters in long-polymer samples, df ! 2:4–2:6 for both $ ! 0:04 and $ ! 0:15, and the largest clusters have at most thousands of particles [Fig. 3(a)]. By contrast, all short-polymer clusters have fewer than a hundred particles; their df ! 1:7–1:8 [Fig. 3(b)], similar to clusters formed by DLCA. Medium-polymer clusters have an intermediate df ! 2:0–2:1. Thus, clusters with a longer attraction range are more compact and have a higher df . To quantify the differences in density at short length scales apparent in the images, we count the number of nearest neighbors for cluster particles. We define two particles as nearest neighbors if the distance between their centers is smaller than the minimum after the first peak in the radial distribution function g"r$ [10]. The nearestneighbor distribution for compact long-polymer clusters [Fig. 3(c)] is peaked around 10 –12 for both $ ! 0:04 and
$ ! 0:15, approaching the value expected for closepacked spheres. By contrast, the nearest-neighbor distribution for short-polymer clusters is peaked at 3–5, consistent with their chainlike appearance, while that for mediumpolymer clusters is centered at 6 –7. Longer attraction range results in more nearest neighbors, consistent with the higher df in describing greater cluster compactness. These quantitative metrics confirm that %, not $, determines cluster morphology. Morphological differences may also provide insight into how these structures form. Because long-polymer clusters form at a relatively low interaction strength of U ! 1–2kB T, their constituent particles can explore many configurations. Internal rearrangements allow cluster compactification, resulting in higher df and more nearest neighbors. We determine the cluster internal volume fraction $i in two ways: counting particles enclosed by a sphere inscribed in a cluster and total Voronoi volume for all nonsurface cluster particles [16]; both methods yield $i ! 0:46 * 0:02. These compact clusters resemble those created by the nucleation and growth of binodal decomposition. By contrast, short-polymer clusters do not form until U & 10kB T. The more tightly bound particles rearrange less before new ones add, resulting in more tenuous, branched clusters, with few nearest neighbors and a low df . These clusters resemble the fractal aggregates formed by DLCA or in the early stages of spinodal decomposition [17]; their $i is not well defined.
028306-3
PRL 96, 028306 (2006)
PHYSICAL REVIEW LETTERS
FIG. 3 (color online). Number of particles in a cluster N as a function of cluster radius of gyration Rg for all clusters. Longpolymer clusters at $ ! 0:04 [circles, best-fit dotted line; cf. Fig. 2(g)] scale (a) similarly to long-polymer clusters at $ ! 0:15 [diamonds, dashed line; Fig. 2(b)] but (b) differently from medium-polymer clusters [squares, dotted-dashed line; Fig. 2(h)] and short-polymer clusters [triangles, solid line; Fig. 2(i)] at $ ! 0:04. (c) Fraction of particles f"NN$ with NN nearest neighbors in characteristic clusters.
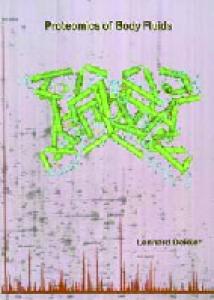
Our results illustrate how gelation depends on %; this is not inherent in a U-$ state diagram [18]. To capture this behavior, % can be represented on a third axis, shown in Fig. 4. Gels occur in the region above the upper checkered surface, while fluids are below the lower surface. Stable fluids of clusters occur in the region between the two surfaces, at lower U as % increases. While the experimental evidence for the existence of a fluid of clusters is unambiguous, these results are at odds with the expectation that attractive clusters should either phase separate completely or gel. One possibility is that the structure is limited by kinetics. However, in the case of the larger particles, typical clusters have &10 #m radius, for which the Smoluchowski doubling time (d is a few hours; we observe stable clusters persisting for days. More strikingly, for typical clusters of the smaller particles, (d is &1 s; we observe clusters persisting for >105 s. Therefore, though diffusion kinetics may slow the growth of larger clusters, it seems unlikely that this alone can explain why these clusters are stable. Instead, cluster stability may depend on the details of the attraction mechanism: When two large clusters approach and make contact, their particles do not rearrange quickly enough for the aggregates to merge before they diffuse away from each other; this prevents further cluster growth [18,19]. Moreover, in no case do we observe these clusters to break into smaller ones. Our results highlight the existence of a stable fluid of colloidal clusters in several attraction ranges, in the absence of long-range repulsion. However, this state’s origin remains a fundamental puzzle requiring further inquiry.
week ending 20 JANUARY 2006
FIG. 4 (color online). U-$-% state diagram for colloidpolymer mixtures. Symbols represent the three phases observed in microscopy: gel (sphere), fluid of clusters (cube), and monomeric fluid (cylinder). Surfaces are guides for the eye: Gels are above the checkered surface; monomeric fluids are below the plain surface; fluids of clusters are in between.
We thank J. Macarthur and H. Oki for engineering assistance. This work was supported by NASA (NAG32284), NSF (DMR-0243715), Harvard MRSEC (DMR0213805), and Marie Curie RTN for Dynamical Arrest (MRTN-CT-2003-504712).
[1] H. N. W. Lekkerkerker et al., Europhys. Lett. 20, 559 (1992). [2] S. M. Ilett et al., Phys. Rev. E 51, 1344 (1995). [3] P. N. Segre` et al., Phys. Rev. Lett. 86, 6042 (2001). [4] F. Sciortino et al., Phys. Rev. Lett. 93, 055701 (2004). [5] P. Meakin, Phys. Rev. Lett. 51, 1119 (1983). [6] J. Groenewold and W. K. Kegel, J. Phys. Chem. B 105, 11 702 (2001). [7] J. Groenewold and W. K. Kegel, J. Phys. Condens. Matter 16, S4877 (2004). [8] A. Yethiraj and A. V. Blaaderen, Nature (London) 421, 513 (2003). [9] A. Stradner et al., Nature (London) 432, 492 (2004). [10] A. I. Campbell et al., Phys. Rev. Lett. 94, 208301 (2005). [11] M. F. Hsu et al., Langmuir 21, 4881 (2005). [12] V. Prasad, Ph.D. thesis, Harvard University, 2002. [13] C. Beenaker and P. Mazur, Physica (Amsterdam) 120A, 388 (1983). [14] CRC Handbook of Chemistry and Physics, edited by D. R. Lide (CRC Press, Boca Raton, FL, 1999), 79th ed. [15] Polymer Handbook, edited by J. Brandup et al. (Wiley, New York, 1998). [16] A. Cacciuto et al., Phys. Rev. Lett. 93, 166105 (2004). [17] M. Carpineti and M. Giglio, Phys. Rev. Lett. 68, 3327 (1992). [18] K. Kroy et al., Phys. Rev. Lett. 92, 148302 (2004). [19] M. E. Cates et al., J. Phys. Condens. Matter 16, S4861 (2004).
028306-4