Fluorescence-Based Distributed Chemical Sensing for Structural Health Monitoring Elena I. Sinchenko, W.E. Keith Gibbs and Paul R. Stoddart Swinburne University of Technology, Centre for Atom Optics and Ultrafast Spectroscopy, Mail H38, PO Box 218, Hawthorn, Victoria, 3122, Australia. E-mail:
[email protected] ABSTRACT Optical fiber distributed sensors hold great promise for corrosion monitoring in large structures. Systems based on absorption losses are relatively well developed, whereas fluorescence systems have been comparatively neglected due to the low efficiency of coupling light emitted in the cladding back into the core. This paper presents a model distributed corrosion sensor based on fluorescence detection by photon counting. The model predicts sufficient sensitivity for practical application under ideal conditions. Preliminary experimental results suggest that additional factors such as scattering at the core-cladding interface and mode distribution effects can have a significant deleterious effect on the performance in practice. Keywords: distributed sensors, fluorescence, optical fiber chemical sensors, evanescent field coupling
1. INTRODUCTION Distributed measurement in optical fibers is based on the observation of processes such as scattering or absorption as a function of time for a short pulse of light launched into the fiber waveguide. A variety of processes have been investigated for distributed chemical sensing, with evanescent wave techniques receiving particular attention as a convenient transduction mechanism [1]. In order to achieve reasonable levels of sensitivity and specificity, plastic-clad silica (PCS) optical fiber has commonly been used to demonstrate extended-length sensors by direct immobilization of suitable reagents in the cladding [2-5]. Despite the number of potentially important applications, relatively few practical distributed chemical sensor (DCS) systems based on evanescent field interactions have been realized [6-8]. This is primarily due to the difficulty of protecting the optical fiber sensor while allowing sufficiently sensitive interaction between the target chemical species and the guided light in the fiber core [1]. Ongoing improvements in cladding formulations have allowed progress to be made in this regard for absorption-mediated sensors [3], but the sensitivity of fluorescence-based systems has remained problematic. Fluorescence can be an enormously sensitive transduction mechanism, allowing the detection of a wide range of chemical species down to the single molecule level. It does not consume analytes and no reference is required because detection occurs at a different wavelength to that of the excitation. However, the low percentage of total power carried by the evanescent field, together with the low efficiency of coupling fluorescent emission back into guided modes of the fiber, results in poor sensitivity in comparison with other intensity modulating processes acting on the fiber. One approach to solving this problem is based on improving the efficiency of the fluorescence recapture. Recent developments in the fabrication of micro- structured optical fibers suggest that the capture efficiency can be significantly improved in fiber designs with sub-wavelength features and high-index glasses [9]. However, the improved efficiency is likely to be accompanied by increased absorption losses, rendering this approach unsuitable for large detection ranges. Another approach may be based on increasing the sensitivity of the detection system, by analogy with distributed temperature sensors that use photon counting to detect weak anti-Stokes Raman scattering. Previous work has shown that this approach can be extremely effective when combined with appropriate background correction procedures [10]. In order to evaluate the potential benefits of this approach, a model is presented for a distributed fluorescence sensor based on photon counting detection. To the best of our knowledge, this kind of system has not been considered before in the literature, whereas the case of evanescent wave absorption has been reported previously [11]. Smart Structures, Devices, and Systems IV, edited by Said Fares Al-Sarawi, Vijay K. Varadan, Neil Weste, Kourosh Kalantar-Zadeh, Proc. of SPIE Vol. 7268, 72681K © 2008 SPIE · CCC code: 0277-786X/08/$18 · doi: 10.1117/12.814703 Proc. of SPIE Vol. 7268 72681K-1 Downloaded from SPIE Digital Library on 27 Jan 2010 to 136.186.72.210. Terms of Use: http://spiedl.org/terms
The development of a distributed system requires optimization of a number of interrelated parameters and characteristics to provide an adequate response along the tested distance. In this paper, the theoretical considerations that indicate critical design parameters for a distributed chemical sensing system based on evanescent wave interactions are presented and discussed in the light of preliminary experimental results.
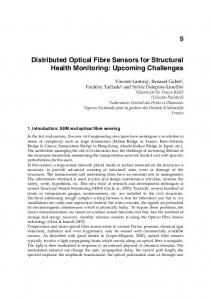
2. MODEL DESCRIPTION In designing an effective distributed sensor, it is important to consider the nature and requirements of the particular application, the physical and chemical properties of the target species and the parameters of the detection system, as these factors jointly dictate the sensitivity, selectivity and accuracy of the eventual measurement. The prime characterizing parameters include the spatial resolution, fiber path length, sensitivity, noise level and system dynamic range. A schematic of a fluorescence based OTDR is shown in Fig. 1. A pulsed laser is coupled into a section of fiber via a directional coupler, which serves also to couple the back-scattered light fraction, captured and returned via the intrinsically sensitive fiber on test, to the sensitive detection system with time resolving capability. The modified cladding region containing the fluorescent dye commences after the directional coupler at a range R0. Optical energy generated by fluorescent dye molecules in the cladding is coupled into the core by means of the evanescent field of the guided modes. The received signal must be registered at the fluorescence wavelength, which is determined by the spectral and luminescent properties of the dye used as a fluorescent probe. P0
Pu sed laser A
Filter Detector Pout 1
Processing electronics
output
Fig. 1. Detection system schematic.
The generalized laser radar equation is used as a starting point for modeling the system shown in Fig. 1 [12]. The laser radar equation allows for the received signal power to decrease as the inverse square of the range, as required for divergent scattering from a point source. This factor is not applicable in an optical fiber, due to the guided nature of the received light. In the case of a fluorescence-based distributed sensing system, the power detected at a range R is therefore: cτ Pr (ν f , R ) = P0 (ν 0 ) Kβ exp ⎡⎢- R⎛⎜ α 0 + α f ⎞⎟⎤⎥ ⎠ ⎦ 2n ⎣ ⎝
(1)
whereν 0 and ν f are the frequencies of excitation and fluorescence respectively; P0 is the power of the laser pulse at frequency ν 0; K is the efficiency of the total optical system; β is the efficiency of the interaction between light propagating in the optical fiber and the fluorescent material; the exponential term describes the transmittance for attenuation of α 0 and α f at the excitation and fluorescence wavelengths, respectively; cτ /2n is the effective length of resolution; c is the speed of light, n is the effective refractive index; τ = τp+τs+τc determines the spatial resolution of the detection system for laser pulse length (τp), response time of the optical interaction with the fluorescent species (τs) and time resolution of the detection system (τc). The range R is related to the observed time delay t by R = ct/2n.
Proc. of SPIE Vol. 7268 72681K-2 Downloaded from SPIE Digital Library on 27 Jan 2010 to 136.186.72.210. Terms of Use: http://spiedl.org/terms
2.1 Evanescent field interaction Based on the weakly guided approximation, which has an accuracy on the order of the index difference ∆ between the core and cladding, Gloge has shown that the ratio of powers propagating in the core and cladding regions depends strongly on the particular mode propagating in a fiber [13]. The average value of the ratio Pclad /P for the total propagating power (P) and power propagating in the cladding region (Pclad) is given by 4 2 / 3V for weakly guiding multimode fibers where all modes are propagating. Although in reality a sensor might not comply with the weakly guiding condition and might not be mode-filled, this expression provides an estimate of the fraction of guided power available for evanescent wave sensing. For example, for a multimode conventional fiber with core diameter 50 µm, NA = 0.2 and excitation wavelength λ 0 = 780 nm, it can be shown that V ≈ 80 and Pclad /P ≈ 2 %. 2.2 Attenuation of optical fiber Since light propagates in the core and cladding regions simultaneously, the attenuation of both should be taken into account. If the influence of modal coupling is ignored, the loss for a particular mode in a step-index waveguide is:
α = α core
Pcore P + α clad clad , P P
(2)
where αcore and αclad denote the core and cladding attenuation coefficients, respectively, and the ratios Pcore /P and Pclad /P can be estimated as in Section 2.1. This is especially important due to the fact that we are considering a cladding doped with a fluorescent material that has a significant absorption coefficient compared to conventional optical fiber materials. We assume that the main attenuation mechanism at work in the cladding is absorption by the fluorescent material, while the attenuation in the core region is defined mainly by the Rayleigh scattering mechanism. Also the attenuation of undoped optical fiber materials is small compared to the loss due to absorption by the fluorescent dye in the optical fiber cladding material (αabs). In this case:
α clad = α abs and α core ,
0 o
10
2
0.01 ppm
n '2)
E
10
162
200
400
600
800
1000
1200
1400
1600
1800 2000
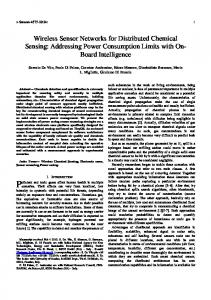
Range (m) Fig 4. Detection efficiency at low concentrations. The range may be limited by the laser repetition frequency.
30 mm
Accumulation Time
V= 12 V = 80
10
V - 300
10
50
55
60
65
70
75
80
85
Range (m) Fig. 5. Detection efficiency for a range of normalized frequencies V, where smaller V-numbers correspond to higher Pclad /P.
Proc. of SPIE Vol. 7268 72681K-6 Downloaded from SPIE Digital Library on 27 Jan 2010 to 136.186.72.210. Terms of Use: http://spiedl.org/terms
4. EXPERIMENTAL RESULTS In order to experimentally evaluate the efficiency with which fluorescence is excited in the cladding region and coupled back into guided modes of the fiber, an experimental investigation was performed under conditions comparable with those presented in the modeling section. An organic laser dye (IR-125 from Exciton) with absorption maximum close to 780 nm and fluorescence band with maximum at 850 nm was used as a model system to be excited via the evanescent field in the optical fiber sensor. The optical properties of IR-125 are shown in Fig. 6; excitation, absorption and fluorescence bands all correspond to the modeling conditions used in Section 2. 1.2
600 fluorescence
0.8
500 excitation at 780 nm 400 absorption
0.6
300
0.4
200
0.2
100
0 600
650
700
750 800 Wavelength (nm)
850
Fluorescence (counts)
Absorbance (a.u.)
1
0 900
Fig. 6. Spectral and luminescent properties of IR-125 for excitation with a laser diode at 780 nm.
4.1 Experimental setup
A pure silica fiber with plastic cladding and core diameter 200 µm (APC200/300N Low OH - Anhydroguide PCS VISIR Fiber from Fiberguide Industries) was used in the experiment. A sensitive section was prepared by two different techniques: either chemical stripping using a sulfochromic acid mixture or burning with a gas torch. The stripped fiber was tested as a sensor by coupling a 780 nm laser diode into a 100 m length of optical fiber with the 20 cm stripped section close to the far end. This configuration provides an equilibrium mode distribution at the sensing section of the fiber. The stripped section was mounted so that it could be placed into solutions simulating various environmental conditions, e.g. changing refractive index or fluorescent dye concentration. Measurements of absorption due to the presence of IR-125 in the solution surrounding the stripped fiber section were performed at the far end of the fiber using a Newport Optical Power Meter (model 1830-C) with Universal Fiber Optic Detector (model 818-IS-1). Spectral fluorescence measurements were performed with an optical spectrum analyzer (ANDO AQ-6315E) using an ultrasteep longpass filter (Iridian ZX-000448) to avoid detector overload by the excitation emission. A photomultiplier tube (Hamamatsu R928) was used to detect low level changes in fluorescence output as a function of fluorescent dye concentration. 4.2 Results
The different methods of stripping result in significant differences in sensor performance. Burning with a torch causes noticeable damage of the core surface and leads to additional scattering at the core-cladding interface. This makes the
Proc. of SPIE Vol. 7268 72681K-7 Downloaded from SPIE Digital Library on 27 Jan 2010 to 136.186.72.210. Terms of Use: http://spiedl.org/terms
sensor performance unstable for changes in environmental refractive index (see Fig. 7). The chemical stripping was found to be much less disruptive of the core-cladding interface, delivering relatively consistent transmission over the range shown. Therefore the chemically stripped sensor was used for further experiments with the solution refractive index adjusted to a value of 1.37 to meet guiding requirements and avoid losses. In-fiber measurements of the IR-125 fluorescence spectrum, background and fluorescence signal with subtracted background are presented in Fig. 8 (for a concentration of 10-4 mol/l in a 50/50 mixture of DMSO and water). The results show detectable levels of fluorescence signal coupled into propagating modes of the optical fiber. At the same time, a significant level of background is observed which can limit the sensitivity of the fiber sensor.
Transmitted Power (a.u.)
1.2 1 0.8 0.6 0.4 0.2 chemical stripping
0 1.33
1.34
1.35
burned cladding
1.36
1.37
1.38
1.39
1.40
1.41
1.42
Refractive Index Fig. 7. Dependence of fiber losses on the refractive index of the environment for different sensor preparation methods.
0.8
Signal from fibre (nW)
0.7 Background Signal+Background Fluorescence
0.6 0.5 0.4 0.3 0.2 0.1 0 750
800
850 900 Wavelength (nm)
950
1000
Fig. 8. Change in the fluorescent spectrum collected by the sensing fiber in the presence of the laser dye (IR-125). “Background” – signal recorded in pure solvent (50/50 mixture DMSO and water); “Signal+Background” – recorded signal in 10-4 mol/l IR-125 in solution; “Fluorescence” – fluorescence signal with subtracted background.
Proc. of SPIE Vol. 7268 72681K-8 Downloaded from SPIE Digital Library on 27 Jan 2010 to 136.186.72.210. Terms of Use: http://spiedl.org/terms
The experimental dependence and fitted curves of the sensor response to changes in fluorescent dye concentration are presented in Fig. 9. The solid curve and diamond points correspond to changes in transmission at the excitation wavelength caused by absorption by IR- 125. The fitting equation for the transmitted power as a function of absorbing dye concentration can be written as: P = P0κ + P0 e ( −ε l Nconc ) ,
where l is the length of propagation and the other symbols are as defined before. This fitting equation is similar to the Beer’s Law (Eq. 1), but has an additional component P0κ . The large core fiber is a significantly multimode structure (the number of modes at 780 nm ~ 104) and because different modes experience different levels of interaction with the absorbing materials surrounding the core area, some modes propagate through the fiber sensor with negligible attenuation, which is represented by the term P0κ . The square points and dashed curve represents experimental and fitting results for the fluorescence signal as a function of fluorescent dye concentration. Curve fitting gives the equation:
(
)
P = P′ + β P0 1 − e ( −ε l Nconc ) ,
where β represents the evanescent field coupling efficiency and P΄ is the background signal in the absence of the fluorescent dye. This shows that the total forward propagating fluorescent signal is proportional to the absorbed power that is available for the fluorescence excitation.
23 Transmitted power (a.u.)
21 19 17 15 13 11 9 abs. experiment fluor. experiment
7
abs. modeling fluor. modeling
5 0
100
200
300
400
Concentration (µmol/l) Fig. 9. Experimental measurements and modeling results of optical fiber sensor response to changes in IR-125 concentration. Data has been scaled for purposes of comparison.
5. CONCLUSION This paper presents a model distributed corrosion sensor based on a conventional multi-mode fiber with a modified cladding and sensitive fluorescence detection by photon counting. Under ideal conditions, the model predicts sub part per million sensitivity over distances of more than a kilometer, which is sufficient for practical application in corrosion monitoring. The preliminary experimental results presented here support the theoretical basis of the model in the modified laser radar equation (Eq. 1). However, the results also suggest that additional factors such as scattering at the core-cladding interface and mode distribution effects can have a significant deleterious effect on the performance in practice. While further development is required to address the requirements of the modified cladding, mode distribution effects can be addressed
Proc. of SPIE Vol. 7268 72681K-9 Downloaded from SPIE Digital Library on 27 Jan 2010 to 136.186.72.210. Terms of Use: http://spiedl.org/terms
with an appropriate background correction procedure, provided that the application allows a stable mode distribution to be maintained. In future work the detailed performance of the photon counting detection system will be experimentally evaluated. It will also be of significant interest to extend the model to compare the performance of microstructured optical fibers [9] with the conventional multimode fiber with a modified cladding, as described in this paper.
ACKNOWLEDGMENTS We gratefully acknowledge Defence Science and Technology Organisation for supporting this work.
REFERENCES [1]
J. Dakin and B. Culshaw, Optical Fiber Sensors Vol. 4, Artech House, Boston, 1997.
[2] 2006.
S.R. Cordero, H. Mukamal, A. Low, E.P. Locke, R.A. Lieberman, Proc. of SPIE, 6378, pp. 63780U-63783,
[3] 2006.
S.R. Cordero, H. Mukamal, A. Low, M. Beshay, D. Ruiz, R.A. Lieberman, Proc. of SPIE, 6377, pp. 63770C,
[4] 2005.
R.A. Potyrailo, A.W. Szumlas, T.L. Danielson, M. Johnson, G.M. Hieftje, Meas. Sci. Tech. 16, pp. 235-241,
[5]
R.A. Potyrailo and G.M. Hieftje, Fresenius J. Anal. Chem. 364, pp. 32-40, 1999.
[6]
R.A. Lieberman, L.L. Blyler, and L.G. Cohen, J. Lightwave Technol. 8, pp. 212 - 220, 1990.
[7]
H. Mukamal, S.R. Cordero, D. Ruiz, M. Beshay, and R.A. Lieberman, Proc. of SPIE, 6004, pp. 600406, 2005.
[8] 2005.
S.R. Cordero, M. Beshay, A. Low, H. Mukamal, D. Ruiz, R.A. Lieberman, Proc. of SPIE, 5993, pp. 599302,
[9]
S.V. Afshar, S.C. Warren-Smith, and T.M. Monro, Opt. Express, 15, pp. 17891-17901, 2007.
[10] P.R. Stoddart, P.J. Cadusch, J.B. Pearce, D. Vukovic, C.R. Nagarajah and D.J. Booth, Meas. Sci. Technol., 16, pp. 1299-1304, 2005. [11]
C. O. Egalon, E. A. Mendoza, A. N. Khalil, and R. A. Lieberman, Opt. Eng., 34, pp. 3583-3586, 1995.
[12]
E. D. Hinkley (Ed.), Laser Monitoring of the Atmosphere, Springer-Verlag, New York, 1976.
[13]
D. Gloge, Appl. Opt., 10, pp. 2225-2258, 1971.
[14]
D. Marcuse, J. Lightwave Technol., 6, pp. 1273-1279, 1988.
Proc. of SPIE Vol. 7268 72681K-10 Downloaded from SPIE Digital Library on 27 Jan 2010 to 136.186.72.210. Terms of Use: http://spiedl.org/terms