FOCUS-PLUS-CONTEXT DISPLAYS FOR AUDIO INTERACTION David Gerhard
Jarrod Ellis
University of Regina Dept. of Computer Science Dept. of Music Regina, SK Canada
[email protected]
University of Regina Dept. of Computer Science Regina, SK Canada
[email protected]
ABSTRACT We present an audio browsing and editing paradigm that incorporates the “focus plus context” visual interaction metaphor. A traditional waveform is displayed in full, and an area of focus is dynamically re-calculated to provide maximum detail in-focus and minimum detail in-context. The interaction metaphor also simultaneously re-scales a frequency-domain display, with increased detail available in both time and frequency domains by means of subsampling and window overlap. Various methods for selecting focus, identifying focus, and transitioning between the focus and context display areas are presented, and advantages for typical audio interaction applications are discussed.
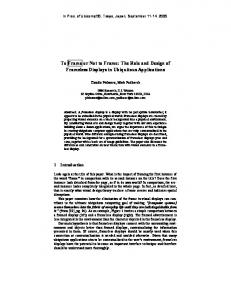
Figure 1. Audio interaction window in Amadeus. A context pane is available, but it is outside of the user’s locus of attention, and presented at a different scale with no scale markings.
1. INTRODUCTION The standard interaction metaphor for editing digital audio presents a waveform which can be resized to any scale from a single sample or sample-per-pixel representation to a display of the full waveform. Users interacting with such an interface may find that, depending on the work being performed on the waveform, a number of different scales are appropriate. For example, when correcting localized recording errors such as clicks and pops from a vinyl recording, the user may need to zoom in to the sample level, however, when mixing multiple parts, duplicating, or re-recording sections, a larger scale may be required. Regardless of the working scale, for anything longer than a single note or acoustic event, the user loses the context of the work being done when zooming in to a reasonably workable resolution. This is closely related to the problem of interactively navigating large information spaces in a limited context. Subsequently, most audio interaction software separates the global view of the raw waveform from its local view or focused portion. This involves multiple separate windows or “panes” to represent a single track of audio data, one for the local work site and one for the context or overview. This multiple-window metaphor is used in many other applications, and has been critiqued[2, 5]. Perhaps more problematic in the audio interaction realm is the loss of
context when working with multiple tracks of audio simultaneously. Most current audio interface programs require the view to be focused at a consistent point across all tracks, effectively locking all tracks together and forcing a user to zoom out to a wider context to jump from one point to another in the project. Several improvements have been made to facilitate this process, including bookmarks and labels, hot-key zooming and complex navigation controls, and some programs even allow a user to be localized at a different point in multiple tracks, but these adaptations are primarily attempts to mitigate the difficulties of working in multiple focus levels in the same document. The user has to mentally assimilate these time-based domains, creating and maintaining a large mental model of the entire project at high cognitive expense. This can be particularly difficult when a project contains several portions that are acoustically similar, as is the case when mastering music with repeating verse-plus-chorus structure. A user may think she is working on chorus 1 when she is in fact working on chorus 3, since the visualization of both choruses look identical. There is no indication in the user’s Locus of attention[6] of the overall location of the work-point in the wider piece. Figure 1 shows an audio interface window from the
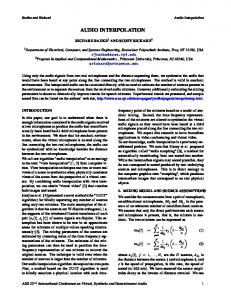
Figure 2. Spectrogram display in Amadeus. There is no context pane, as the waveform displayed is aligned with the spectrogram
program Amadeus 1 . There are two panes showing audio information. The top pane shows the complete context of the audio clip, while the bottom pane shows the focused work area. There is a rectangular selection box in the context pane that both selects and indicates the area of the focus pane. The scroll bar at the bottom of the window indicates in a minimal way the overall location and context of the focus window. The “Horizontal zoom” slider is a second way to change the amount of audio data in the focus window. Complete information about the context of the focused area is not presented, and a user must look at three separate interface elements to get a complete picture. Although the context is presented, it is not in the user’s locus of attention and the user must either consult the context pane (thus leaving the focus pane) or maintain a mental model (at cognitive cost). Figure 2 shows a spectrum window from Amadeus. In this case, any familiarity the user might have acquired interacting with the time-window is lost since the frequency window is significantly different. The contextual information is gone, replaced with a localized and aligned version of the time waveform. Context is critical in audio editing and manipulation. Most of the existing audio editing software attempts to inform the user of the overall context using cues such as numerical ranges or context windows, it remains cognitively expensive to maintain a mental model of the piece being viewed. 1.1. The Detail-In-Context Problem Alan Keahey[4] describes the detail-in-context problem thus: “How can we effectively utilize the additional space made available by any nonlinear magnification transformation to enhance the visualization of the data or objects located within that space?” 1
http://www.hairersoft.com/Amadeus.html
When a viewer uses a magnifying lens to look at an area of a photograph, the entire photograph is still within the viewer’s perception. When a user zooms in to a digital image, the context is immediately lost. The user does not know which portion of an image is being considered, unless they were present when the zoom took place, and even then the user must maintain, at cognitive expense, a mental model of the entire data space and the context of the area being considered. Most data interfaces that support zooming also present a “context” or overview as a second display, but since this information is not presented in the user’s locus of attention, the user may not incorporate this information into their mental model. Further, an additional window for context adds to “palette clutter”, taking screen-space away from the primary data. A solution to this problem is the non-liner magnification transform, which places a digital “lens” over the data, allowing the user to zoom in on one area while maintaining the overall context. “Focus plus context” (FPC) is one of many terms used to describe such zoomable display systems employing continuous nonlinear magnification transformations[3, 8, 9]. Terms such as detail-incontext, polyfocal projection, fisheye [7] and distortionoriented presentation have also been used. FPC displays present both a focus area and a context both in the same window. The user does not have to switch between looking at different panes, nor does she need to maintain a mental model of the context. In FPC displays, the metaphor of the magnifying glass is taken several steps beyond the isolated bounds of the focal lens. Nonlinear transformations provide varying levels of detail in the surrounding context or contexts, providing more focused detail for visually perceptive purposes. Using the multiwindow approach in audio display analysis, the user must judge the relative position of the focal region using limited visual cues in the global context. Using a seamless multilevel view method of magnification would eliminate the need for this difficult perceptive judgment. 1.2. Current Focus-Plus-Context Applications Aside from “dock magnification” in Mac OS X 2 (see Figure 3), there are very few mainstream examples of FPC applications. Zoomable user interfaces (ZUIs) are an attempt to provide a context-specific view of larger data spaces by allowing the user to zoom in on a subspace of a display. The most common example of a ZUI is the Virtual Desktop metaphor, where each desktop is a subset of a larger set of desktops, shown in a contextualized window. While this does constitute a FPC display, it shares the same problem of other systems, in that the context for the focus is not within the user’s locus of attention and instead is presented as a second, separate view of the full context, requiring the user to maintain a mental model of this complete context. A classic example of a “stronger” version of a zoomable user interface is the Pad++ interface[1] developed by the 2
http://www.apple.com
Figure 3. Dock magnification in Macintosh OS X.
University of Maryland Computer Science department but no longer actively being worked upon. Pad++ is like a virtual desktop environment, but it allows for multiple views and varying scales. The idea behind Pad++ is to provide the user with the ability to navigate large amounts of data using a FPC transformation method for semantic magnification. Some issues with Pad++, mentioned by the authors, are a lack of customization for sizes of objects (or nodes) with no location constraints and no animation between magnified transitions. Transitions are immediate and abrupt, giving no visual cues to the user as to what object has been magnified. One benefit of Pad++ is its ability to use multiple foci on the same data. Persons with visual disabilities have varying specific needs when it comes to presenting data at readable resolutions. Many current operating systems, for example the Macintosh OS X operating system, provide an accessibility feature which allows the user’s display to be zoomed in to varying levels of magnification. The focus window is centered on the mouse, and moves around the (virtual) user interface with the mouse movements. The advantage is that the entire display is enlarged by the same amount (rather that only increasing font size, for example), however, there is no context presented, and the user must maintain a mental model of the underlying environment. More and more, web browsers and other traditional applications are being offered on mobile devices with very small screens. Previous attempts at rendering web content on small screens usually works best with so-called “mobile content”, alternative versions of websites designed for smaller screens. There are two main difficulties with this implementation: First, the familiarity that a user develops with the normal version of a website is defeated by these smaller versions, making them difficult to navigate; and second, websites without these minimalist versions are rendered poorly by the mobile browsers. New browsers are being developed, including Apple’s mobile Safari and Microsoft’s Deepfish, which render the website as if it were on a large screen and allow the user to scroll around within a zoomed sub-view of the full rendered page. Once again, a lack of context requires the user to maintain a mental model of the page as they are maneuvering around within it. New interfaces such as Multi-touch screens may reduce the cognitive load associated with non-contextualized focus applications, but this remains to be studied. 1.3. Pseudo-Non-Linear and Multi-Level Mappings The computational cost of nonlinear transformations has been prohibitive to implementing true FPC displays in the
past, and while modern systems provide sufficient computational overhead, The need to dedicate significant processing power to implementing such transforms continues to be a barrier to mainstream usage. The transformations that are required to move from focus to context need not be non-linear, however. With piece-wise discrete interfaces such as menus and icon displays, each element can be linearly scaled to a degree relating to the distance from the center of the focus, making an apparent non-linear zoom. This is the technique employed by the dock in Apple’s Macintosh OS X described above, and it has been used in other contexts as well. Figure 4 shows an example of “text zooming”, where a large textual hierarchy, for example a menu or a document, can be navigated with the use of FPC magnification. Each menu item or word is a discrete object in the contextual space, and can be zoomed using the font size to indicate distance from the focus.
Figure 4. Text zooming for large lists.
While discrete elements can be zoomed with little computational cost, continuous information such as linear time audio data must be handled differently. Each pixel in the context image can be expanded into many pixels in the focus area, up to the maximal data resolution. Further, continuous data that does not have a natural analog must have overt indicators to describe the amount of focus and the type of transition between the focus window and the context. Because of this, a simple zoom of the data point is not possible - instead, a re-interpolation must be used to re-draw the data at higher resolutions in the focus window. Three methods of this re-interpolation are: multiple zoomed layers; linear interpolation; and non-linear transformation.
1.3.1. Multiple zoomed layers Because the metaphor of discrete elements is prevalent in modern FPC implementations, it makes sense to begin with a translation of discrete elements into the continuous arena. The “multiple zoomed layers” approach consists of defining a focus region and constructing a set of concentric levels between the focus region and the underlying context (Figure 5. Each level is at a resolution between that of the focus and the context.
2. FOCUS AND CONTEXT IN AUDIO There are a number of standard interaction paradigms for working with audio, many of which would benefit from an FPC interface of some form. We present a discussion of some of the inherent difficulties in such implementations, as well as some resolutions to these difficulties. Figure 5. One-dimensional FPC display using multiple zoomed layers.
Figure 6. One-dimensional FPC display using linear transformation.
1.3.2. Linear transformation The next obvious transition is to draw a straight line from the focus area to the context area, and linearly transform the scale function across this line (Figure 6). This implementation is more complex, requiring a linear interpolation across a significant amount of data, but computationally this will add only minimal additional burden. The result is a smooth transition and a more natural localized structure for the focus window. 1.3.3. Non-linear transformation The most flexible but most complex transform is to present a generalized nonlinear transition between the focus and the context area. In general, this means a single continuous function across the entire context space, but since the focus window display will need to be re-calculated at each shift of its location, it makes more sense to re-calculate only on the portion that is different from the initially calculated contextual backdrop. An example of a spherical transition is presented in Figure 7.
2.1. Audio Interfaces and Typical Tasks As seen in Figure 1, the standard audio interface displays a waveform at a single scale, with a vertical bar indicating the “play head” corresponding to the next sound that would be heard if the “play” button were clicked. Other standard interface elements include playback and selection controls. Users are able to select chunks of audio by indicating start and stop times or samples, or by dragging in the audio display window. Global track information is often presented in the form of muting, stereo panning and local sound characteristics. It is important to recognize that these indicators and track-level features are a holdover from the days of solid-state mixing boards, where each channel in the board corresponds to an audio input, with muting, soloing, trim, pan and other controls in a vertical stripe up the board for each channel. The audio interaction interfaces are designed to facilitate common tasks relating to recorded audio. Some of these tasks will be discussed here, along with how these tasks could be made easier with FPC displays. 2.1.1. Splitting a large file One of the more common audio tasks performed by the average user is transferring audio media from one format to another, usually from a physical audio format such as tape or vinyl to a digital format. The typical sequence for such a transfer is to attach the physical media player to the computer, start the media playing at normal speed and start recording, then walk away for half an hour. The nature of this task means that the transfer is real-time, and no time saving is available. Vinyl and Tape albums are often divided into tracks, and if these tracks are separated with silence, then some automated track segmentation can be done. This process can be easily frustrated by recording noise and live or continuous albums with no silence between tracks. The standard metaphor for splitting a large file into smaller tracks is to look at the full file, try to see where natural track splits might have occurred (by finding small low-energy areas in the waveform), zooming in to these areas, splitting the track, and zooming out to find the next one. The difficulties in this method are numerous: • not every low-energy area is a track break;
Figure 7. One-dimensional FPC display using a spherical non-linear transformation.
• not every track break is low-energy; • track breaks are best made at the sample level;
• track breaks should incorporate fading out of the new track ending and fading into the new track beginning. Further, once a track break is made, the user must zoom out to the complete context and start to search for the next track break. FPC displays can help this process in many ways. When a user mouses over an area that they suspect is a track break, they can see immediately if it is a candidate or not, without having to zoom in. A medium-level context can be selected to more easily show the potential track breaks, and false positives can be more easily discarded without having to zoom in to verify. The user can manipulate the focus window until it corresponds with the desired fade in and fade out, and then execute a single command instead of selecting a break point and creating a fade-out and a fade-in. 2.1.2. Soundtrack composition When creating a soundtrack for a movie, television show or video, there are three components that are typically employed: ambience, foley and effects. Ambience is the underlying noise of the surroundings, such as street noise, office noise, or nature noise, depending on the surroundings in the video. Foley is the addition of sound samples which correspond to actions by actors or other objects in the scene. A classic example of foley is footsteps added to a scene after it has been shot. Foley is used because it is often very difficult to record sound events live, especially in wide shots. Foley is typically recorded in a studio as the video is played. Effects are similar to foley, but are not recorded live and are often taken from existing effects libraries, such as honking horns and telephone rings. Composing a soundtrack usually consists of interacting with multiple tracks simultaneously. FPC displays would allow a user to accurately manipulate the location of a foley sound within the context of the entire soundtrack without having to zoom in and out. Manipulating the location of a series of footsteps would be considerably easier. Further, a more natural correspondence between the audio and video representations can be maintained if the user does not have to continually zoom in and out to alter the location of an effect. 2.1.3. Filtering and processing Filtering and effects processing are common sound manipulation activities. Here, manipulations are applied to the entire file or to larger chunks of the piece being considered. Reverb, compression and equalization are examples of this type of task. In existing systems, the typical procedure is to apply the filter to a small subset of the sound file (often called a preview) to verify that the filter parameters are appropriate, then apply the filter to the entire piece. Application of a filter to a large sound file can take time, and normally the only feedback is a progress bar. Once the filtering is done, information is sometimes presented
to the user to indicate whether there were any problems with the filtering, but the user usually must listen to the entire work to verify that the desired acoustic effect was achieved. An FPC display can help in this instance as well, to give an indication of the progress of the application of a filter. The full context of the file is displayed, and as the filter is applied to each local section, a focus window is traced across the file showing the application of the filter and the result, and the user can identify problems as they arise, or stop the filter if there is a problem. Traditional displays can follow along with the progress of the filter, but it is difficult and cognitively expensive to integrate the progress of the filter into a the context of the full file.
2.1.4. Simple playback Every sound editor is also a sound player, and in traditional interfaces the user has the option of watching the playhead slowly traverse the entire file or watching the zoomed-in waveform pass under a stationary playhead. FPC displays can enhance this process in much the same way as the following of filter progress described above. By following a focus window as it traverses an overall context, the user can see both what is happing at a low level and where the sounds are occurring at a higher level.
2.1.5. Breathers and other vocal editing One of the classic vocal editing problems is the removal of “breathers” or audible inhalations just before a sung or played musical phrase. Although the presence of breathers can be stylistically desirable (for example in the piano recordings of Glen Gould), many professional studios do what they can to remove breathers. The typical procedure is to examine the onset of each phrase in the vocal (or instrumental) line, detect breathers by observation of the waveform, or more typically the spectrogram, and then delete or filter out the breath noise using a fade in, noise removal or other technique depending on the surrounding noise. FPC techniques can make this process easier and more accurate by showing the spectral context of the breather, thereby confirming that the sound to be removed is the desired target. As before, finding events of interest within the timeline can be augmented with the incorporation of FPC methods, which allow a user to examine the low level details of the editing without losing the context. Regardless of the task, there are two classic forms of information that are used to analyze and interact with audio: the time waveform and the spectrum. Several methods exist for converting from the time domain to the frequency domain, the most popular of which continues to be the Fourier transform. In the following sections, we will discuss FPC display issues surrounding both time-domain and frequency-domain displays.
3. ZOOMING ISSUES In the early days of focus-plus-context research, investigators employed tricks to make a two-dimensional visual area appear to be warped in three-space. Computing power was at a premium, so simple graphical transformations were employed to simulate the expansion of an area of focus. It might be tempting to look back on these methods and expect that with the rise of integrated 3-D graphics processing, all one needs to do is map the visual area onto a 3-D surface and stretch the surface to provide a closer view of one area. The problem with this is that in order to provide sufficient focus detail, the surface would have to be stretched by a large proportion, leading to distorted contextual information. Orthogonal 3-d graphics views are typically optimized for a high degree of detail in the foreground with a less-detailed background, or in some cases a static image as a background. Rarely are the background and foreground connected in the way that a FPC display would required. In audio applications, there are two primary displays: the time waveform and the spectrogram. Both displays can benefit from FPC integration, and the following sections will describe the theoretical basis for zooming in time and in frequency. 3.1. Time Zooming The time display of the waveform is perhaps the most prevalent audio display, being found in oscilloscopes and used in many movies and TV shows when it is required to show that someone is interacting with audio. There are typically two classical implementations of time waveform presentation, depending on the viewing range. When viewing large sections of audio, each pixel on the screen represents a range of time and the average energy in the waveform at that time. For smaller ranges, each pixel represents the waveform value at that time, either interpolated or sub-sampled to fill the range. The difficulty with perceiving a time waveform in isolation is that there are no perceptual cues to indicate the current scale. When viewing information that has familiar visual characteristics, such as a photograph, humans achieve a sense of scale by making use of perspective and falling back on familiar metaphors. We are familiar with, for example, the average size of a person, so when a visual field is ambiguous (as in an architectural model, for example) person-shaped objects are often added to give a sense of scale. If a person is very familiar with audio processing and has looked at many waveforms, they may be able to pick up cues as to the scale of the waveform, for example, if they know they are looking at music and they know the approximate tempo, they can infer the scale from the distance between prominent peaks. This method and other “landmark finding” methods are not reliable, however, because landmarks in audio waveforms are typically ambiguous and can be very difficult to interpret. Tempo doubling errors are common, for example, because much music has sub-beats between the primary peaks. Speech
is another interaction area where landmarks can be used to give a sense of scale, since humans tend to speak at a rate of around 4 syllables per second. Again, this method proves useful only when a user has considerable experience on which to draw. Applying FPC to a time waveform can give a sense of scale, since the entire waveform is present and can be viewed at once. The user must still be aware of the time duration of the sample in order to disambiguate the display, but this is easier than maintaining a complete mental model of the waveform itself. The amount of zoom utilized in such an application must also be indicated, since the user may make scale errors if the amount of zoom is unknown. There are a number of ways to indicate the amount of scale, including the size and steepness of the non-linear transform, the thickness of the waveform trace itself, or an external iconic or numeric scale display. Regardless, the difficulties with scale perception in audio must be considered when designing such interfaces. 3.2. Frequency Zooming The frequency display of an audio file normally corresponds to the short-time Fourier transform (STFT) of the waveform, although other techniques are employed for specific purposes. The STFT is calculated by breaking the waveform into overlapping fixed-size windows and calculating the spectrum of each window. The display is typically collocated in time with the waveform itself, to make corresponding analysis easier. STFTs and other spectral transforms suffer from an uncertainty principle: the more accurately you measure the frequency of a signal, the less accurately you can know the time at which that frequency occurred. This is evident in two extremes: If the STFT window is taken to be the entire length of the waveform, the complete frequency information can be calculated but it corresponds only to the entire waveform and not to any specific part within it. Similarly, the smallest unit of time in a waveform is the sample, corresponding to a single measure of air pressure. In itself, a sample has no frequency information but is located as accurately as possible in time. As a consequence of this spectral uncertainty, audio interfaces typically allow a number of parameters to be manipulated when displaying the spectrogram. If the user is more interested in time-accuracy of the spectrogram, a compactly-supported window is employed. If frequencyaccuracy is demanded, a larger window is used. Wavelets and other multi-resolution techniques have been employed to allow better time-resolution at higher frequencies, but low frequencies cannot be extracted using a compactlysupported window. Despite the problems, the STFT remains the frequency analysis method of choice because it represents frequency information visually in a way that people can learn to interpret. The spectrogram representation is fundamentally an image, and as such, it is reasonable to expect that focus-pluscontext zooming paradigms designed for images would also be appropriate for spectrograms. This is not the case
for two reasons. The first is that image zooming metaphors assume that the image is available at full resolution, and the context area is created by down-sampling the image. Spectrogram data is fundamentally different at different frequency and time resolutions, so it is not sufficient to simply calculate the best possible spectrogram and zoom in. As has been stated, there is no “full resolution” spectrogram, and zooming must incorporate re-calculation. The second reason is related to the difficulty of zooming in the time waveform. General images often have landmarks or contextual information that provide a hint of the scale at which it is being viewed. Spectrograms have no such cues, and two spectra can look the same when viewed at different resolutions if they are harmonically related. For these reasons, a re-calculating metaphor is required.
3.3. Spectrogram Re-calculation It is worthwhile to re-visit the classic formulation of the short-time Fourier transform to see where our modifications take place. Equation 1 shows the discrete STFT. X(m, ω) =
∞ X
x[n]w[n − m]e−jωn
(1)
3.3.1. Time bounds The upper and lower time bounds can be manipulated by adjusting the beginning and ending of the waveform to be analyzed. In order to fill the pixel range, the window size and the window overlap can both be manipulated. As we will see, the window size has an effect on the frequency bounds, so it cannot be considered an independent variable in this case. 3.3.2. Upper frequency bound Since the maximum frequency that can be displayed is dependent on the sampling frequency fs of the signal, we can reduce the sampling frequency in order to bring down the upper frequency bound. Down-sampling can be achieved by interpolating between the waveform samples and re-sampling at a lower sampling frequency. Initially, it might seem like this would reduce the amount of information available to the viewer, and while this is strictly the case, it is necessary to keep in mind that the goal of this transformation is only to increase the viewing resolution for a small portion of the frequency display, and contextualizing this focused portion with the complete spectrum.
n=−∞
3.3.3. Lower frequency bound The windowing function w[·] is a function which establishes a finite range for the window, and typically tapers to zero at both ends of the range to reduce discontinuities. The windowing function provides time-localization to the STFT, and windows are often overlapped to compensate for the discarded information in the tapering of the windowing function. The size of the window dictates the maximum frequency that can be represented, and the relationship between the amount of overlap and the window size determines the time-resolution of the resulting spectrogram image, although it should be noted that no additional information is presented when the overlap is greater than what is required to compensate for the tapering. There are three inter-related parameters, then, in the construction of a spectrogram based on the STFT: The window size and overlap, discussed above, and the sampling frequency of the sound, which determines the actual range of frequencies that are presented. If an audio waveform is sampled at 44,100 Hz (the standard CD sampling rate), and a 1024-sample window is used in the STFT, the longest sinusoid that can be detected is 1024 samples which is equivalent to 0.023 seconds or 43 Hz. The shortest sinusoid that can be detected is half the sampling frequency, in this case 22,050 Hz. The key to frequency zooming is in adjusting the time and frequency bounds of the spectrogram. A full spectrogram can be calculated with a reasonable balance between time and frequency to create the background context. A zoomed window over top of the spectrum provides detail. How can the three parameters we have control over be manipulated to alter the frequency and time bounds of the resulting spectrogram?
Since the minimum frequency that can be displayed is dependent on the window size, we would like to re-sample within the window in order to modify the displayed frequency. A window size could be selected which corresponds directly to the minimum frequency desired, and this window would then be up-sampled (through the same interpolation and re-sampling procedure discussed above) to make a window of standard size (for example 1024 samples). The difficulty with this method is that in modifying the window size, the calculation of the entire spectrum is altered, rather than just the low frequency bound. In this case, the easiest and least intrusive method to assign the lower frequency bound is simply to discard the information below that frequency. The complete focus-generation sequence is then: 1. Select the upper frequency limit fl desired for the window. 2. Select the time range for the focus window, and copy 12 fs /fl times that number of samples from the original waveform. 3. Re-sample using a sampling ratio defined by fl / 12 fs . 4. Calculate the STFT on this new waveform, using a window overlap appropriate for the number of pixels required in the image 5. Discard the result below the lower frequency limit. 1 2 fs
is the maximum frequency that can be represented in a signal sampled at fs .
years and that although learning is required, the current systems are capable of performing the tasks required, it is worthwhile to recall that most of the people who work with these programs have extensive experience and strong familiarity with the paradigm, the result of which can be overestimating the ease of use of the familiar interface. FPC audio displays have the potential to remove considerable cognitive burden for people who work with audio, regardless of whether they consider themselves burdened. 5. REFERENCES Figure 8. Two-dimensional FPC display using a single layer of focus on top of a cohesive context.
3.3.4. Parametrization Because one of the goals of such a system would be usability, a user should not be required to interface with the algorithm-level parameters if they are not familiar to her. A “zoom amount” parameter could equally well define the maximal frequency, resample factor and overlap, given the appropriate mathematical mapping. If a user wanted to double the scale of the spectrogram, the maximal frequency would correspond to the location and size of the focus area. Imagine the focus area was at the center of the display, and was one-third the size of the full spectrum display. The maximal frequency of the focus area would then be two-thirds of the maximal frequency of the overall spectrogram, or fs /3. 3.3.5. Limitations Re-sampling and window overlapping will work best when using whole-number ratios of the original values. This has the potential to impart an undue restriction on the usability of the system. The spectrogram zooming will also have limits imposed by time-frequency tradeoffs. 4. CONCLUSIONS We have presented a discussion of the issues involved in focus-plus-context displays for audio interaction. While it may be true that these displays will add a computational burden to what has traditionally been a relatively simple task, it is perhaps more appropriate to think of this as a shift in cognitive burden from the human to the computer. In traditional audio editing displays, users are forced to maintain and update a mental model of the entire file being considered, and difficulties can arise when there are repeated segments in a file. FPC interfaces can alleviate many of the current task-related difficulties of audio interaction. We have presented theoretical aspects of generating FPC displays of waveform and spectral information, and discussed implementation issues. While it may be tempting to suggest that audio interaction programs have been successfully used for many
[1] B. B. Bederson and J. D. Hollan. Pad++: a zooming graphical interface for exploring alternate interface physics. In UIST ’94: Proceedings of the 7th annual ACM symposium on User interface software and technology, pages 17–26, New York, NY, USA, 1994. ACM Press. [2] K. Hornbæk, B. B. Bederson, and C. Plaisant. Navigation patterns and usability of zoomable user interfaces with and without an overview. ACM Trans. Comput.Hum. Interact., 9(4):362–389, 2002. [3] A. Keahey. Nonlinear magnification infocenter. online: http://alan.keahey.org/research/ nlm/nlm.html [accessed April 14, 2007]. [4] A. Keahey. The generalized detail-in-context problem. In INFOVIS ’98: Proceedings of the 1998 IEEE Symposium on Information Visualization, pages 44– 51, Washington, DC, USA, 1998. IEEE Computer Society. [5] M. D. Plumlee and C. Ware. Zooming versus multiple window interfaces: Cognitive costs of visual comparisons. ACM Trans. Comput.-Hum. Interact., 13(2):179–209, 2006. [6] J. Raskin. The Humane Interface: New Directions for Designing Interactive Systems. Addison-Wesley Professional, March 2000. [7] U. Rauschenbach. The rectangular fish eye view as an efficient method for the transmission and display of images. In ICIP ’99: Proceedings of the 1999 IEEE conference on Image Processing, Washington, DC, USA, 1999. IEEE Computer Society. [8] U. Rauschenbach, T. Weinkauf, and H. Schumann. Interactive focus and context display of large raster images. In WSCG ’00: The 8-th International Conference in Central Europe on Computer Graphics, Visualization and Interactive Digital Media, 2000. [9] A. Woodruff, J. Landay, and M. Stonebraker. Constant information density in zoomable interfaces. In AVI ’98: Proceedings of the working conference on Advanced visual interfaces, pages 57–65, New York, NY, USA, 1998. ACM Press.