Food Detection and Recognition Using Convolutional Neural Network Hokuto Kagaya
Kiyoharu Aizawa
Makoto Ogawa
Graduate School of Interdisciplinary Information Studies The University of Tokyo
Dept. Information and Communication Eng. The University of Tokyo
[email protected]
[email protected]
foo.log Inc.
[email protected]
ABSTRACT In this paper, we apply a convolutional neural network (CNN) to the tasks of detecting and recognizing food images. Because of the wide diversity of types of food, image recognition of food items is generally very difficult. However, deep learning has been shown recently to be a very powerful image recognition technique, and CNN is a state-of-the-art approach to deep learning. We applied CNN to the tasks of food detection and recognition through parameter optimization. We constructed a dataset of the most frequent food items in a publicly available food-logging system, and used it to evaluate recognition performance. CNN showed significantly higher accuracy than did traditional support-vectormachine-based methods with handcrafted features. In addition, we found that the convolution kernels show that color dominates the feature extraction process. For food image detection, CNN also showed significantly higher accuracy than a conventional method did.
Categories and Subject Descriptors I.5.4 [Computing Methodologies]: Pattern recognition— Computer Vision; I.2.6 [Artificial Intelligence]: Learning—Connectionism and neural nets
General Terms Experimentation
Keywords deep learning; food recognition; food detection; convolutional neural network
1. INTRODUCTION Diet is very important in human life. Obtaining adequate nutrition from everyday meals is essential for our health. Permission to make digital or hard copies of all or part of this work for personal or classroom use is granted without fee provided that copies are not made or distributed for profit or commercial advantage and that copies bear this notice and the full citation on the first page. Copyrights for components of this work owned by others than ACM must be honored. Abstracting with credit is permitted. To copy otherwise, or republish, to post on servers or to redistribute to lists, requires prior specific permission and/or a fee. Request permissions from
[email protected]. MM’14, November 3–7, 2014, Orlando, Florida, USA. Copyright 2014 ACM 978-1-4503-3063-3/14/11 ...$15.00. http://dx.doi.org/10.1145/2647868.2654970.
To know what we eat, we often make a record of everyday meals. Such food recording is usually a manual exercise using textual description, but manual recording is tedious and time consuming. To overcome this difficulty, there have been attempts to assist food recording by using information technology. Image recognition of food items would be a good solution to food recording. Taking a picture would then be a sufficient record. However, we know that there is a wide diversity of types of food. Even within the same food category, there is considerable diversity. Therefore, despite the attempts at food item recognition, recognition performance is not yet satisfactory. Regarding food image recognition, Zhu et al. [12] described food recognition using a small dataset, which was intended to be used in a smartphone-based food-logging system as part of their Technology Assisted Dietary Assessment project. Hoashi et al. [5] examined 85 food items, achieving 62.5% accuracy for the recognition of Japanese food images collected from the Web. They used multiple kernel learning for feature fusion as their machine learning method. The Pittsburgh Fast-Food Image Dataset [4] is a dataset of American fast-food images, which was used to evaluate a food-recognition method in [11, 6]. Food balance, an aspect of nutritional content, was estimated by image processing [2]. Image retrieval was applied to food recording [1]. Deep learning has recently been used in image recognition [8]. Deep learning is a collective term for algorithms having a deep architecture that solves complex problems. The most distinctive characteristic is that better image features for recognition are automatically extracted via training. The convolutional neural network (CNN) [9] is one of the methods that satisfy the requirements of the deep learning approach. CNN is now a state-of-the-art technique for image recognition challenges such as the Large Scale Visual Recognition Challenge [7]. In this paper, we apply CNN to the recognition and detection of food images and evaluate its performance. Our contributions are as follows: (1) we built a dataset for food recognition experiments by using food-domain images obtained from a food logging system available for public use; (2) we optimized CNN’s hyper parameters, showing that CNN significantly improved the food recognition accuracy compared with a conventional method using a support vector machine (SVM) with hand-crafted features; (3) through observation of our trained CNN, we found that color features dominate the food recognition process; (4) we showed that CNN has significantly better performance for the task
of food detection when compared with a baseline method [2].
2. CONVOLUTIONAL NEURAL NETWORKS The CNN [9] offers a state-of-the-art technique for image recognition. It is a multilayer neural network, whose neurons take small patches of the previous layer as input. It is robust against small shifts and rotations. A CNN system comprises a convolution layer and a pooling (or subsampling) layer. In the convolution layer, unlike for general fully connected neural networks, weights can be considered as n × n (n < input size) filters. Each input convolves these filters. Each layer has many filters that generate different outputs. For the image recognition task, the different features are extracted by these filters. The filters are often called (convolution) kernels. The pooling layer produces the outputs by activation over rectangular regions. There are several activation methods, such as maximum activation and average activation. This makes the CNN’s outputs more invariant with respect to position. A typical CNN comprises multiple convolution and pooling layers, with a fully connected layer to produce the final result of the task. In image classification, each unit of the final layer indicates the class probability. A CNN has hyper parameters that include the number of middle layers, the size of the convolution kernels, and the active functions. In this paper, we compare the optimization of some of these parameters. In our research, we use cudaconvnet1 , which is a GPU implementation of a CNN in C++ and Python, for the CNN library.
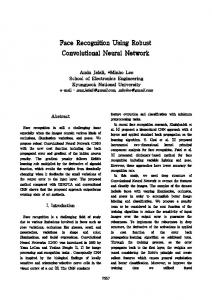
3. BUILDING A DATASET OF ORDINARY FOOD IMAGES A number of images of ordinary meals are required for the evaluation of food item recognition. A meal image typically involves several food items. In the evaluation of food item recognition, each food item region of the image need to be identified and isolated for the dataset. Food-logging apps available for smartphones can produce very good data for this purpose: we made use of the data produced by FoodLog (FL) [1]. The general public can use FL for their own food recording using both photos and text. The user takes a photo of a meal, and specifies each region involving a food item via the touch panel display of the smartphone by inputting the name of the food item. The food item name is usually chosen from a standard food database. As a result, very clean data about image regions of named food items are produced. In our experiments with food recognition, the domains that users specified were slightly enlarged because users tend to specify undersized regions for the food items. FL is a publicly available app, and, with the number of users growing, the food item dataset is increasing. We collected approximately two months of recorded data from FL, following its launch in 2013. We used approximately 170,000 images. This data is from everyday meals logged by general public FL users. The diversity of the types of food was large and there was heavy bias towards some items. We chose the 10 most frequent food items from this data, as shown in Figure 1 and Table 1. From the table, note that 1
http://code.google.com/p/cuda-convnet/
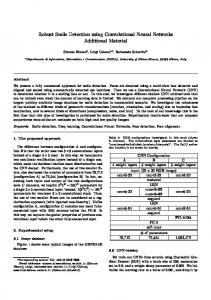
Figure 1: Examples of images used in the dataset. Table 1: The 10 most-frequent food items on FL for two months. Item Rice Miso soup Green salad Natto Yogurt Cold tofu Ramen Curry and rice Grilled salmon Deep-fried chicken
Quantity 11560 5786 3603 2338 1724 1434 1070 979 951 910
there are more than 10,000 references to the most-frequent item, but only 900 to the least-frequent item. Training a CNN needs a number of data items, and we used these top 10 items for this purpose.
4.
FOOD RECOGNITION
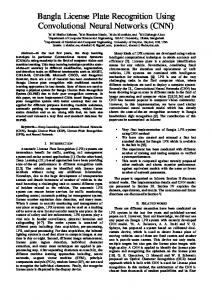
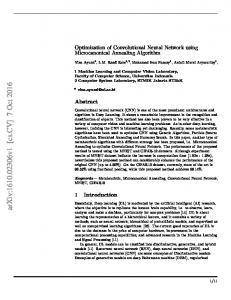
As mentioned in Section 2, CNN has hyper parameters related to the number of layers, training, preprocessing, and initialization. In this section, we describe the calibration of the number of layers and the number and size of kernels in each layer. In accordance with Krizhevsky’s CNN [7], we use local response normalization (LRN) for the normalization after pooling layers. There are two types of LRN, involving either one map or across the maps. We scaled the dataset images to 80 × 80. When training and testing, cuda-convnet’s python module randomly cropped them to 64 × 64. We divided the dataset into six sets: four sets were used for training, one for validation, and one for testing. We conducted a 6-fold cross validation. For a comparison between CNN and existing techniques, we prepared three methods using SVM-based recognition using handcrafted features: (1) spatial pyramid matching (SPM) using a color histogram + SVM; (2) GIST features + SVM; (3) The ScSPM package [10], which is a SIFT–BoW-based method. Table 2 shows the experimental results. The top line shows the average of the 10 trials with the same dataset and hyper parameters. The existing techniques used as baseline methods had about 50–60% accuracy, whereas the CNNs achieved more than 70%. The two-layer CNN performed better than did the three-layer and four-layer CNNs. With respect to kernel size, 5 × 5 was the best. Use of the two LRN types (same map or across maps) made almost no difference for this dataset. Figure 3 shows confusion matrices. Comparing color features, the accuracy with CNNs was im-
Table 2: Accuracy of CNNs for various hyper-parameter values compared with three existing techniques. Layers 2 *2 2 2 3 4 2 2 2 2
Number of kernels Size of kernels 32-32 9-7 32-32 9x9, 7x7 32-64 9x9, 7x7 64-64 9x9, 7x7 32-32-64 5x5, 5x5, 5x5 32-32-32-64 7x7, 7x7, 5x5, 2x2 32-32 7x7, 5x5 32-32 5x5, 3x33 32-32 5x5, 5x5 32-32 5x5, 5x5 SPM + Color + SVM GIST + SVM ScSPM
Normalization (LRN) 1 time 1 time 1 time 1 time 2 times 3 times 1 time 1 time 1 time 1 time
Dataset Same dataset and parameters 6-fold cross validation 6-fold cross validation 6-fold cross validation 6-fold cross validation 6-fold cross validation 6-fold cross validation 6-fold cross validation 6-fold cross validation 6-fold cross validation 6-fold cross validation 6-fold cross validation 6-fold cross validation
Avg. 72.39% 71.17% 72.94% 70.07% 69.82% 66.57% 72.86% 72.88% 73.69% 73.70% 54.63% 52.53% 60.47%
SD 1.48% 0.83% 0.68% 2.98% 0.73% 0.91% 1.35% 1.68% 1.28% 0.81% N.A. N.A. N.A.
(a)
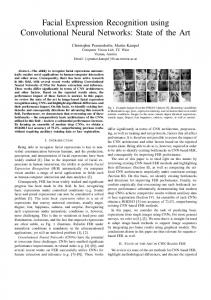
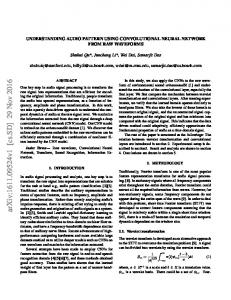
(a) CNN (b) Figure 2: Convolution kernels trained using general images: (a) ImageNet [7]) and (b) food images.
proved for all items. The blue cells in the results for Color SPM + SVM show high confusion for some combinations of food items of similar colors such as “curry and rice” and “deep-fried chicken.” For CNN, the confusion of these items is much reduced. We obtained additional insights from these results. Figure 2 shows examples of the convolution kernels after the training. The convolution kernels for CNN show the features that are extracted. In the kernels for general images such as ImageNet’s images [7], we find edge-specific kernels. However, for food images, almost all the kernels are colorspecific. This observation suggests that color features are dominant in food image recognition. This is in agreement with Bosch’s report [3], where color features were the best of the handcrafted features for food recognition.
5. FOOD DETECTION In this section, we consider the food detection task. This is different from food item recognition in that food detection is a binary classification of food and non-food images. Given a whole image that may contain food and background, food detection classifies the image as food or non-food. We conducted an experiment to evaluate CNN’s performance. For this detection task, we used a different dataset because of having to include non-food images. We used 1,234 general food images and 1,980 non-food images, including human faces and landscapes, as the experimental dataset.
(b) Color SPM + SVM Figure 3: Confusion matrices for CNN and one of the traditional techniques. Red cells show the class of high probability. Blue cells show confusion probabilities exceeds 10%.
They were collected from social media. The input images were scaled down to 80 × 80 and cropped to 64 × 64 pixels randomly by the cuda-convnet python module. For comparison, the baseline was the food detection system used by FL [2]. This method uses an SVM as the classifier and employs color features, circular boundary features, and SIFT–BoW features as image features. In our experiment using CNN, we divided all food and non-food images in the dataset into 10 groups. Eight groups were used for training, one for validation and one for testing. Training ended when the validation error ceased to evolve. We used the hyper parameters marked with “*” in Table 2. We conducted 10-fold cross
(a)
(b)
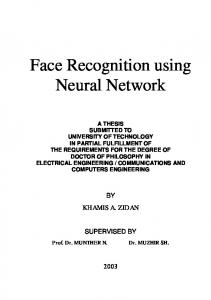
Figure 4: Examples of images for the detection task: (a) food images and (b) non-food images. Table 3: Comparison between CNN and the baseline method for the detection task. Method Baseline CNN
Accuracy 89.7 ± 0.73% 93.8 ± 1.39%
validation. For the experiment using the baseline method, we randomly selected the same number (1,200) of food images and non-food images, with 1,000 being used for training the SVM and the remaining 200 being used for testing. We computed the average result over 15 trials. Table 3 compares the accuracy of the baseline method and CNN, with CNN achieving 93.8% accuracy, which is significantly higher than that for the baseline method. Figure 5 shows some examples of images incorrectly detected by CNN. These images would seem to be hard to detect, even by human observation.
6. CONCLUSIONS In this paper, we have addressed the effectiveness of CNNs for food image recognition and detection. First, we built a food image dataset from images uploaded by a large number of real users. Second, we applied CNN to the recognition of 10 food items and evaluated its performance. We found that CNN performed much better than did traditional methods using handcrafted features. Third, through observation of trained convolution kernels, we confirmed that color features are essential to food image recognition. Fourth, we applied CNN to food detection, finding that CNN significantly outperformed a baseline method.
7. ACKNOWLEDGMENTS This work was partially supported by JST CREST and JSPS Grant-in-Aid for Scientific Research (B).
8. REFERENCES [1] K. Aizawa, K. Maeda, M. Ogawa, Y. Sato, M. Kasamatsu, K. Waki, and H. Takimoto. Comparative study of the routine daily usability of foodlog: A smartphone-based food recording tool assisted by image retrieval. Journal of Diabetes Science and Technology, 8(2):203–208, 2014. [2] K. Aizawa, Y. Maruyama, H. Li, and G. de Silva. Food balance estimation by using personal dietary tendencies in a multimedia food log. IEEE Trans. Multimedia, 15(8):2176–2185, 2013. [3] M. Bosch, F. Zhu, N. Khanna, C. J. Boushey, and E. J. Delp. Combining global and local features for food identification in dietary assessment. In IEEE ICIP, pages 1789–1792, 2011. [4] M. Chen, K. Dhingra, W. Wu, L. Yang, R. Sukthankar, and J. Yang. Pfid: Pittsburgh fast-food image dataset. In IEEE ICIP, 2009.
Figure 5: Examples of detection errors. Bar graphs show the class probability, with “F” meaning food, and “N” meaning non-food. Red bars indicate correct class probability, and blue bars indicate predicted (mistaken) class probability. [5] H. Hoashi, T. Joutou, and K. Yanai. Image recognition of 85 food categories by feature fusion. In IEEE ISM, pages 296–301, 2010. [6] F. Kong and J. Tan. Dietcam: Regular shape food recognition with a camera phone. In IEEE BSN, pages 127–132, 2011. [7] A. Krizhevsky, I. Sutskever, and G. Hinton. Imagenet classification with deep convolutional neural networks. In NIPS, pages 1106–1114, 2012. [8] Q. Le, M. Ranzato, R. Monga, M. Devin, K. Chen, G. Corrado, J. Dean, and A. Ng. Building high-level features using large scale unsupervised learning. In ICML, 2012. [9] Y. LeCun, L. Bottou, Y. Bengio, and P. Haffner. Gradient-based learning applied to document recognition. Proceedings of the IEEE, 86(11):2278–2324, 1998. [10] J. Yang, K. Yu, Y. Gong, and T. Huang. Linear spatial pyramid matching using sparse coding for image classification. In IEEE CVPR, pages 1794–1801. IEEE, 2009. [11] S. Yang, M. Chen, D. Pomerleau, and R. Sukthankar. Food recognition using statistics of pairwise local features. In IEEE CVPR, pages 2249–2256, 2010. [12] F. Zhu, M. Bosch, I. Woo, S. Kim, C. J. Boushey, D. S. Ebert, and E. J. Delp. The use of mobile devices in aiding dietary assessment and evaluation. IEEE Journal of Selected Topics in Signal Processing, 4(4):756–766, 2010.