Jul 4, 2007 - Restructuring of colloidal cakes during dewatering. J.B. Madeline1, M. ..... integral of equation /4/, resulting in a depression of S(Q). The depth of ...
Author manuscript, published in "Langmuir 23 (2007) 1645"
hal-00160022, version 1 - 4 Jul 2007
For Table of contents use only
Restructuring of colloidal cakes during dewatering
J.B. Madeline1, M. Meireles1, C. Bourgerette2, R. Botet3, R. Schweins4, B. Cabane5
1
Restructuring of colloidal cakes during dewatering J.B. Madeline1, M. Meireles1*, C. Bourgerette2, R. Botet3, R. Schweins4, B. Cabane5*
1
Laboratoire de Génie Chimique, CNRS UMR 5503, 118 route de Narbonne, 31062
hal-00160022, version 1 - 4 Jul 2007
Toulouse cedex 4, France 2
CEMES/CNRS, 29 rue Jeanne Marvig, BP 4347, 31055 Toulouse cedex 4, France
3
Laboratoire de Physique des Solides, CNRS UMR 8502, Université Paris-Sud, 91405 Orsay, France
4
LSS group, ILL, BP 156, 38042 Grenoble Cedex 9, France
5
PMMH, CNRS UMR 7636, ESPCI, 10 rue Vauquelin, 75231 Paris cedex 05, France
2
Abstract Aqueous suspensions of aggregated silica particles have been dewatered to the point where the colloidal aggregates connect to each other and build a macroscopic network. These wet cakes have been compressed through application of osmotic pressure. Some cakes offer a strong resistance to osmotic pressure, and remain at a low volume fraction of solids; other cakes yield at low applied pressures, achieving nearly complete solid/liquid separation. We used Small Angle Neutron Scattering and Transmission Electron Microscopy to determine the processes by which the particles move and reorganize during cake collapse. We found that these restructuring
hal-00160022, version 1 - 4 Jul 2007
processes follow a general course made of three stages: (1) at all scales voids are compressed, with large voids compressed more extensively than smaller ones; the local order remains unchanged; (2) all voids with diameters in the range 2-20 particle diameters collapse, and a few dense regions (lumps) are formed; (3) the dense lumps build a rigid skeleton that resists further compression. Depending on the nature of interparticle bonds, some cakes jump spontaneously into stage 3, while others remain stuck in stage 1. In order to elucidate the relation between bond strength and compression resistance, we have constructed a numerical model of the colloidal network. In this model, particles interact through non-central forces that are produced by springs attached to their surfaces. Networks made of bonds that break upon stretching evolve through a plastic deformation that reproduces the 3 stages of restructuring evidenced by the experiments. Networks made of bonds that are fragile jump into stage 3. Networks made of bonds that can be stretched without breaking evolve through elastic compression and restructure only according to stage 1.
3
Introduction Dispersions of fine solid particles in a liquid are used to manufacture coatings (paints, inks, paper coatings), composite materials (reinforced elastomers) and ceramics. They are also found in food (milk, cheese), pharmaceuticals, and biotechnology processes (fermentation broths). Lastly, they form the bulk of industrial and city effluents. In most cases, it is at some point necessary to separate the particles from the liquid: ceramic pastes must be consolidated, clays and sludge must be dewatered, and paper coatings must be drained and dried. At this point major technical problems occur.
hal-00160022, version 1 - 4 Jul 2007
The solid/liquid separation may be achieved through a variety of processes including mechanical compression [1], drying [2], membrane filtration[3], and centrifugation[4]. In all these processes, the particles are pre-aggregated to form a flocculated suspension, and the liquid phase that separates the aggregates is removed until the aggregates connect to each other and form a wet cake. Some stress is then applied to the cake in order to remove more of the liquid phase and achieve an optimal solid/liquid separation. This stress is an osmotic pressure (it moves the liquid with respect to the particles), which is applied through the processes listed above. The efficiency of the separation depends on the way in which the wet cake responds to osmotic pressure. Some cakes are not very compressible. This is the case for cakes in which strong bonds connect the particles. Such bonds can be created by flocculating aqueous dispersions of mineral particles through a pH shift [1, 5-7] (at the isoelectric point, the particle surfaces lose their ionic layers, and they can come in direct contact with each other). The structures of these cakes are determined by the sizes and structures of the original aggregates of the flocculated suspension. Indeed, Waite and coworkers have shown that the size distribution of aggregates in the original suspension has a strong effect on the permeability of the resulting cake [8]. At low applied pressures, the structures of these cakes change little; however, at very high pressures, they can still be compressed to relatively high densities. Other cakes are highly compressible. This is the case for cakes in which weak bonds connect the particles. Such bonds are created when aqueous dispersions of mineral particles are flocculated by addition of monovalent ions (this causes a compression of ionic layers that protect the surfaces, and a reduction of the repulsions that keep the particles apart. In these conditions, the 4
particles actually attract each other through Van der Waals forces, and they aggregate; however, their surfaces remain separated by the layers of hydrated counterions that compensate their surface charges [9]. Lange and coworkers [10, 11] discovered that dispersions flocculated by addition of large counterions such as Cs+ or TMA+ had a weak mechanical resistance and could be consolidated to a high final volume fraction; with counterions that have a small bare diameter, such as Li+ or Na+, the mechanical resistance was higher, and it was highest in dispersions made at the isoelectric point, where the surfaces had lost their counterions. These findings raise a number of interesting questions, concerning the structural processes by which cakes yield to applied pressure, and the final state that they reach at the end of
hal-00160022, version 1 - 4 Jul 2007
compression. The first question is whether all cakes evolve through the same structural processes, with different thresholds corresponding to the respective strengths of interparticle bonds, or whether cakes made of different particles, or with different bonds, evolve through different structural processes. A related question concerns the effect of the initial structures: do cakes with different initial volume fractions or different initial structures end up, after compression, on the same structural pathway, or do they evolve through different structures. Indeed, the processes through which the cakes evolve are non-ergodic. Hence, cakes that start from different initial structures or have different interparticle bonds may not end up in the same final state, even when the applied pressure is strong enough to break all interparticle bonds. The next question deals with the nature of these processes, i.e. whether the deformation is the same everywhere and at all scales (this is called an affine deformation) or whether deformations occur exclusively in some places but not in other places, or at some scales but not at other scales. The former type occurs in elastomers, where the density is uniform and the polymer chains can be stretched in response to applied forces; however, this cannot be the case for the colloidal networks, since the colloidal aggregates are inhomogeneous, their bonds may break rather than bend or rotate, and the particles are non-deformable. The latter type of deformation occurs in pastes that are made of rigid aggregates with no bonds between them: in this case the deformation takes place in the liquid phase that separates the aggregates. However, in most cakes, there is a continuous network of bonds that extends throughout the cake, with the consequence that the deformation must propagate through this network. 5
In order to provide some answers to these questions, we have studied the compression behaviors of model systems in which the relative positions of particles may be determined. Specifically, we have chosen aqueous dispersions of nanometric silica particles, which have globular shapes and a narrow size distribution. We have aggregated these particles in various ways, filtered the aggregated suspensions at increasing applied pressures, and recovered the resulting cakes. We have measured the silica volume fraction in the cakes, in order to determine the extent of cake collapse, and we have examined the structures of these cakes through small angle neutron scattering (SANS) and transmission electron microscopy (TEM), in order to identify the structural processes by which the cakes have collapsed and the porosity has been lost. SANS experiments measure the distribution of interparticle distances. Three ranges of distances
hal-00160022, version 1 - 4 Jul 2007
can be identified: (1) distances between nearest neighbors, which measure the structure of the coordination shell of a particle; (2) distances between particles that are more remote, in the range 2-20 particle diameters, which measure the spatial distribution of lumps and voids at those scales; (3) large scale heterogeneities, which may be lumps or pores with sizes larger than 20 diameters. We have measured the changes that occur in these three ranges of distances, for cakes made with two types of particles and two types of bonds. We found that these cakes start with different initial states but converge toward similar final states, suggesting a common mechanism for the resistance to compression. In order to understand the nature of this mechanism, we built a numerical model that describes the formation of a cake through the aggregation of spherical particles and the collapse of this cake under the effect of applied pressure. This model makes it possible to identify the deformation processes that were observed through the experiments and to calculate the characteristics of interparticle bonds that oppose them.
Methods Small angle neutron scattering (SANS) Scattering methods use interference experiments to measure distributions of distances within the sample. These experiments may be described on the basis of interactions of incident radiation with individual scatterers, and interferences between scattered rays [12].
6
In neutron scattering, incident neutrons are scattered by nuclei located in the irradiated volume; a nuclear scattering length characterizes the strength of the interaction between a neutron and each nucleus [13]. These scattering lengths vary according to the type of nuclei. In particular, there is a large difference between the scattering lengths of H nuclei and those of other nuclei such as O and Si. This yields a strong contrast between the silica particles and the solvent, H2O: the density of scattering length of the silica particles is ρp = + 3.47 x 10¹⁴ m–2, in the middle of the scale of scattering densities, and that of H2O is ρs = – 0.56 x 10¹⁴ m–2, at the lower end of that range. The scattering pattern results from interferences between rays scattered by nuclei located at different positions [12]. The phase differences that control these interferences are determined by
hal-00160022, version 1 - 4 Jul 2007
the scalar product Q.r, where r is the vector joining 2 nuclei, and Q is the scattering vector. If the sample is isotropic as a whole, then the scattered intensity only depends on the magnitude of the scattering vector, which varies with the neutron wavelength and scattering angle according to: Q=
%$ ( 4" sin' * & 2) #
/1/
If the sample is made of identical particles dispersed in a homogenous solvent, then the intensity !
can be decomposed as a product of the intensity scattered by a single particle and a structure factor that describes the interferences between rays scattered by different particles [12-15]: 2
I (Q) = K (" p # " s ) V p2 N p P(Q) S(Q)
/2/
where K is an instrument calibration factor, Vp the volume of a particle, Np the number of
!
particles per unit volume, P(Q) the form factor of particle and S(Q) the structure factor that describes the pair correlations between the positions of all particles. For spherical particles of radius R, the form factor is simply determined by the particle radius R:
[
P (Q) = 3 (sinQR " QR cosQR) (QR)
3
]
2
/3/
Since P(Q) is known, and I(Q) is measured, equation /2/ makes it possible calculate S(Q). This !
structure factor is related to the pair correlation function of the particles, g(r), through: S(Q) = 1+ 4 " N p
!
%
$ 0
[g(r) #1]r 2
sinQr dr Qr
/4/
7
In all real particle dispersions the particles are polydisperse in sizes, and therefore equations /2//4/ are not strictly valid. Nevertheless, the study of colloidal dispersions in which the distribution of particle sizes is not too broad has shown that a very good approximation consists in taking into account the polydispersity of particle sizes through the form factor P(Q) only [16]. In practice, P(Q) is measured on dilute dispersions, and it is fitted by inserting a suitable distribution of particle diameters into equation /3/. This effective form factor is then used within equation /4/ to extract an effective structure factor S(Q), from which the pair correlations can be determined. The structure factor has a simple behavior in a few limiting cases, depending on the types of interparticle correlations: No correlations. For a perfect gas of non-interacting “phantom” particles, g(r) = 1 and S(Q) = 1
hal-00160022, version 1 - 4 Jul 2007
(no correlation) at all Q values. Associative correlations. If the particles are associated, forming large aggregates, then g(r) has a long positive tail at large r, which yields a large contribution to the integral of equation /4/ for low Q values, where the contributions from all particles in the aggregate are in phase. At higher Q values, interferences between particles located at different positions within the aggregate cause oscillations in sinQr and a decay in S(Q). If the aggregate is selfsimilar with a fractal dimension df, then the number of particles n(r) located at a distance r from a reference particle decays as d
n ( r) " r f , and the pair correlation function g(r) must decay as g( r) " r
d f #3
, therefore the #d f
structure factor S(Q), which is a Fourier Transform of g(r) , must decay as S (Q) " Q !
[17].
Repulsive correlations. If the particles repel each other as in!the equilibrium hard sphere liquid, then g(r) can be related to the pair potential through the Percus-Yevick approximation [18, 19], ! and calculated through the analytical expression given by Wertheim [19, 20]. This pair correlation function has an oscillation at large r, due to the pseudoperiodic correlations caused by repulsions of the particles. At low Q values, this oscillation of g(r) causes a compensation in the integral of equation /4/, resulting in a depression of S(Q). The depth of this depression is a measure of the strength of correlations between the positions of particles. Conversely, at Q = 2π/D, where D is the particle diameter, the oscillations of g(r) are in phase with those of sinQr, which gives a peak in S(Q). The magnitude of this peak is a measure of the organization of the first coordination shell of a particle: a sizable peak is obtained if the coordination shell contains 8 to 10 neighbors, as in equilibrium liquids, whereas this peak vanishes if each particle has only 3 8
to 4 neighbors. The extreme case of complete correlation occurs in colloidal crystals, where g(r) is reduced to a set of peaks corresponding to repeat distances within the crystal, and S(Q) = 0 at all Q excepted for peaks at Q values corresponding to the Bragg vectors of the crystal. For SANS experiments, wet fragments were cut out of the cakes and inserted into thin (1 mm) quartz cells. Care was taken to avoid any evaporation of water during this transfer. The cells were placed on the neutron beam of the instrument D11 at ILL. Intensities were collected at each detector cell, radially averaged and arranged as a function of the scattering vector Q [21]. Spectra were obtained using different detector positions and wavelengths, and then combined together to yield scattering curves that extended from Q = 6.10–4 Å–1 (real space distances on the order of
hal-00160022, version 1 - 4 Jul 2007
1000 nm) to Q = 6.10–2 Å–1 (distances on the order of 10 nm).
TEM Solidified cakes were produced for observation through TEM, according to the following protocol. (a) Solvent exchange. The aqueous cake was immersed in methanol until all water was exchanged; then methanol was replaced with a degassed acrylic resin (LR white). Many successive exchange steps were performed. (b) Polymerization. The resin inside the cake was polymerized for 24 h at 60 °C. At each stage, we compared SANS spectra of the aqueous cakes and those of the processed cakes, and found them to be identical. Thin slices (50 nm) were cut from the solidified cakes using an ultramicrotome in a direction parallel to the axis of compression of the cakes. These slices were observed through TEM, using a CM 30 Phillips electron microscope equipped with a Gatan numerical camera. Since the slice thickness (50 nm) was larger than the particle diameter (15 nm for Ludox particles), each image was a projection onto a plane of the shadows of all the silica particles that were located at different depths within the slice. Consequently, the organization of the cake at scales larger than the slice thickness is well reproduced in the images; at smaller scales, the projection images appear denser than the 3-dimensional structure.
9
Materials Silica dispersions Aqueous dispersions of nanometric silica particles were used as starting materials for the production of all suspensions and cakes. The choice of nanometric particles was important for two reasons. Firstly, they formed cakes at low volume fractions, which were highly compressible. Secondly, the relative positions of particles in a cake could be determined through small angle neutron scattering (SANS). Therefore they were suitable for the study of the mechanisms by
hal-00160022, version 1 - 4 Jul 2007
which cakes may rearrange their structures and collapse. Two types of aqueous silica dispersions were used. The main source was Ludox HS40, bought from Grace-Davison. These dispersions contain nanometric silica particles (volume fraction 20 %) in an aqueous phase that also contains Na+, OH– (pH = 10) and silicate ions. At this pH, the silica surfaces carry a very high density of SiO– groups, which are compensated by Na+ counterions in the aqueous phase [22, 23]. The layers of counterions that surround neighboring particles overlap, producing strong interparticle repulsions. SANS experiments were performed on a concentrated dispersion, and on a dispersion that had been diluted to a volume fraction φ = 0.5 % (Figure 1). The spectrum of the concentrated dispersion shows a strong peak, corresponding to the regular spacing of repelling silica particles. The average interparticle distance, determined from the peak position, is 19 nm. From this distance and the silica volume fraction, the average volume of silica per particle was calculated: we found v = 1790 nm3, which corresponds to a number-averaged diameter a = 15 nm, assuming a globular shape and a dense (fcc) packing. The spectrum of the diluted dispersion is typical of globular non-interacting particles (Figure 1). At high Q, it has a monotonic decay instead of the sharp oscillations of monodisperse spheres, indicating that there is a distribution of diameters. Accordingly, the spectrum was fitted with the scattering curve of polydisperse spheres; this curve was then used subsequently as an effective single particle scattering curve in order to calculate the structure factors of suspensions and cakes, as shown in the previous section.
10
hal-00160022, version 1 - 4 Jul 2007
Figure 1. Scattering curves of silica dispersions. Horizontal scale: scattering vector Q, in Å-1. Vertical scale: scattered intensities, normalized by the scattering of a 1 mm thick water sample. Symbols as follows. (+), dilute dispersion (φ = 0.5 %). The intensity at low Q corresponds to the mass per particle, and the curvature to the particle radius. The fit (full line) corresponds to polydisperse non-interacting spheres. (), concentrated dispersion (φ = 20 %). (O), structure factor S(Q) of the concentrated dispersion. The depression of I(Q) and S(Q) at low Q results from the suppression of concentration fluctuations, caused by interparticle repulsions. The peak originates from the regular spacing of particles. The other source of silica dispersions was Klebosol 30N50PHN, bought from Clariant. These dispersions contain larger silica particles (volume fraction 15 %) in an aqueous phase that also contains NH4+ and OH– (pH = 10) ions. The overlap of the layers of NH4+ counterions that surround the particles causes neighboring particles to repel each other. According to SANS spectra, the number average diameter of these particles was a = 72 nm, and the distribution of diameters was quite narrow.
11
Agregation of silica particles Aggregated suspensions were made from silica dispersions that were diluted to φ = 1 % (in order to make cakes with a substantial porosity) and also adjusted to pH = 8 (in order to control metastability). Indeed, at this pH, the dispersions are metastable, but they can be flocculated by small amounts of polycations (see below). At higher pH ( > 9), flocculation would require the addition of high concentrations of polycations, because the silica surfaces carry a high density of SiO– groups; at lower pH (< 6) the dispersions are unstable, because the particles spontaneously aggregate through the reaction of SiOH and SiO– surface groups [22]. Aggregation was performed by adding an aqueous “flocculant” solution to a dilute silica
hal-00160022, version 1 - 4 Jul 2007
dispersion. The volumes of both solutions were equal. The mixing was done according to the standard industrial procedure called the “Jar test”, in which the flocculant solution is added under fast stirring (300 rpm for 3 minutes), followed by slow stirring (60 rpm for 30 minutes). The shear rates were 200 s-1 in the first stage and 40 s-1 in the second one. Rapid mixing provides a good dispersion of the flocculant and destabilization of the colloidal particles, whereas slow mixing is believed to optimize floc growth by limiting the breakdown of aggregates [24]. In fact, visual observation of the stirred suspensions showed only slight turbidity, indicating that the aggregates were still microscopic (< 100 nm). At this scale, diffusional motions were faster than advective motions. Growth of the aggregates to macroscopic sizes occurred later, during the rest period that preceded compression. The main flocculant solution was made by slow (5h) addition of NaOH to a AlCl3 solution (0.1 M). The final ratio OH/Al was 2.2, and the final pH was 4 ± 0.25. In these conditions, it is known that the Al3+ cations react with the added OH– to form polycations, of which the dominant ones are the [Al13 O4 (OH)24]7+ (hereafter abbreviated Al137+) [25]. The flocculant solution was equilibrated over 24h, and then added to the silica suspension; the final silica volume fraction was 0.5 % and the final Al concentration was 0.05M. The addition of Al137+ polycations caused changes in the surface charges of silica particles [25]. These changes were followed through measurements of electrophoretic mobilities of particles or aggregates of particles. These mobilities were low, in the range where they vary linearly with the zeta potential. Accordingly, zeta potential values were calculated according to the Hückel and 12
Smoluchowski equations. For Ludox, the addition of Al137+ caused a reversal of the sign of the zeta potential; the isoelectric point occurred at a composition corresponding to the adsorption of 350 positive charges per particle (Figure 2a). This number may be compared with the expected number of ionized SiO– groups on a particle of diameter 15 nm at pH = 8. Indeed, in similar dispersions (particle diameter 10 nm, pH = 9 and salinity 1 x 10⁻² M) the number of ionized groups per silica particle was found to be 200 [16]. Based on the difference in diameters and the variation of surface charge with pH [23], it may be concluded that the measured isoelectric point corresponds to a compensation of negative surface charges by positive charges from Al137+. A more precise view of this process has been obtained through NMR studies of silica dispersions in water at pH 8, flocculated by addition of Al137+. It has been found that the first Al137+ react with
hal-00160022, version 1 - 4 Jul 2007
the silica surfaces to yield negatively charged aluminosilicates; then the other Al137+ bind to these aluminosilicate surface sites and compensate their charges [25]. For Klebosol, the isoelectric point occurred at a lower Al concentration, due to the smaller surface area of the Klebosol particles. The addition of Al137+ polycations also caused the dispersion to become turbid, indicating that large aggregates had formed. Aggregation started right at the beginning of flocculant addition, even though the average surface potential of the particles was still negative. This was caused by heterocoagulation of silica particles that had acquired a positive surface charge with particles that still had a negative surface charge. Indeed, the flocculant was not added homogenously to the silica dispersion; at the point of mixing, there was an excess of polycations compared with the available silica surface area. This inhomogeneity was significant because the adsorption of Al137+ on silica surfaces is very fast at pH = 8, due to the high surface charge density of silica at this pH [26]. In these conditions, particles that happened to be at the point of mixing acquired a positive surface charge, while others still had a negative surface charge. Encounters between positive and negative particles caused the fast growth of aggregates.
13
hal-00160022, version 1 - 4 Jul 2007
Figure 2. Zeta potentials of colloidal aggregates. (2a) Aggregates made by addition of Al137+ polycations to silica dispersions at pH = 8. Filled diamonds: Ludox. Open squares: Klebosol. The reversal of the zeta potential results from the accumulation of Al137+ on the silica surfaces. (2b) Aggregates made by addition of Ca2+ cations to silica dispersions at pH = 8. Filled diamonds: Ludox. The reduction in zeta potential results from screening of surface charges by Ca2+. Open squares: Klebosol. The reversal in zeta potential results from accumulation Ca2+ on silica surfaces. At high levels of flocculant addition, beyond the isoelectric point of the suspension, adsorption of Al137+ polycations continued and the apparent surface charge of the silica aggregates became 14
positive. This overcompensation of the surface charge results from the strong electrostatic attraction of multivalent counterions for highly charged surfaces [27]. Ludox aggregates did not redisperse, even though the particles had a net apparent surface charge. This can be a consequence of correlations between multivalent counterions adsorbed on neighboring surfaces [27]. It may also be a consequence of chemical bridges, formed through reactions between silanol groups or through reactions between silanols and aluminates. The other flocculant was made by the dissolution of CaCl2 (concentration 0.2 M) in water (pH = 6). The addition of Ca2+ cations to the silica dispersion had two effects: the apparent surface charge of the particles was reduced, and the dispersion became slowly aggregated. The changes in surface charge of the aggregates were followed through measurements of their electrophoretic
hal-00160022, version 1 - 4 Jul 2007
mobilities (Figure 2b). In the case of Ludox suspensions, the zeta potential of the particles was reduced, but only at extremely high concentrations of Ca2+, and it was never reversed, indicating that Ca2+ do not accumulate in the Stern layer of the particles. This failure to accumulate at the surfaces is caused by the competition of Na+ counterions that are strongly bound to the silica surfaces [28-30]. In the case of Klebosol particles the zeta potential is reversed, but only at very high Ca2+ concentrations. The reversal is related to the fact that the Ca2+ can displace the original NH4+ counterions. Still, the accumulation of Ca2+ in the Stern layer is weak compared with that of Al137+ because of the smaller electrostatic interaction of Ca2+ with the silica surfaces. The aggregation of the silica particles was a consequence of the compression of the layers of counterions that surround the particles. Indeed the final concentration of Ca2+ in the suspension was 0.1 M, which gives a screening length κ–1 = 0.6 nm. This screening is enough to suppress the repulsions originating from the overlap of the ionic layers of silica particles. Still, in the case of Ludox particles, aggregation was extremely slow (turbidity was seen after 2-3 days), indicating that only a very small fraction of the collisions was successful. This is an effect of the strongly bound Na+ counterions in the Stern layer of the Ludox particles. In the case of Klebosol particles, which do not have these Na+ counterions, aggregation induced by Ca2+ was fast.
Osmotic compression The suspensions were dewatered by the application of osmotic pressure, either through mechanical compression [1] or through hydrodynamic compression [3]. This operation caused 15
the colloidal aggregates to connect and form a continuous network, called a cake. The extraction of water was continued until the cake was compressed to the desired volume fraction. For mechanical compression, the aggregated suspension was placed in a pressure cell (a long steel cylinder of diameter 50 mm) equipped with pistons that were permeable to the liquid phase. This device is sometimes called an oedometer, and sometimes a filter press. Pressure was applied to the pistons and the liquid phase was forced out. At some point, the aggregates formed a network, which progressively collapsed under the effect of applied pressure. The pressure was applied in 5 steps, each representing 20 % of the final pressure; at each step, constant pressure was maintained until the compressive yield stress of the network matched the applied pressure, and a steady state was reached. The full collapse took 2-10 days depending on the magnitude of
hal-00160022, version 1 - 4 Jul 2007
the final pressure. The range of pressures that could be reached was 50 - 600 kPa. At lower pressures, the resistance to compression had a significant contribution from friction of the pistons, or from friction of the dispersion against the walls. This method produces a homogenous pressure throughout the cake, provided that the application of pressure is slow enough. Therefore, at the end of compression, pieces of the cake could be recovered and used for analysis. The volume fraction of silica in the cake was determined by comparing the weights of the wet cake (recovered from the cell) and of the dry cake (evaporated at 120 °C). Other pieces of the cake were kept in closed boxes and used later for SANS. For hydrodynamic compression, a suspension was placed in a filtration cell (diameter 50 mm), and gas pressure (10 - 500 kPa) was applied to the liquid. The flow of continuous phase (water and ions) pushed the aggregates towards the membrane where they built a cake. Additional volumes of continuous phase were added as needed, so that the hydrostatic pressure was always applied to a liquid phase sitting on top of the cake. In the cake, each particle was submitted to a hydrodynamic force from the permeating liquid. These forces were transmitted through the network of interparticle contacts. As a result, the total force exerted on aggregates located at the bottom of the cake was the sum of hydrodynamic forces exerted at higher levels in the cake. Conversely, the force exerted on particles located at the top of the cake was the local hydrodynamic force only. This method produces a gradient of osmotic pressure through the cake, with the highest pressure (and volume fraction) near the membrane and the lowest at the top [31]. It was used to produce 16
cakes for observation through TEM: these cakes were sliced along the axis of compression, so that a single slice contained regions that were near the membrane (maximum pressure) and regions that were near the top of the cake (lowest pressure). This made it possible to visualize in a single experiment the gradient of porosity that was produced by the full range of pressures.
Results In this section we first present TEM images of slices cut through filtration cakes. These images show that the colloidal aggregates within the cakes build a network, which undergoes extensive reorganization under the effect of applied pressure. Then we present quantitative determinations
hal-00160022, version 1 - 4 Jul 2007
through SANS of the structures of the colloidal aggregates, first as they are in the original suspensions, and then as they are in the cakes, after dewatering and compression. For each cake, we compare the SANS structure factors obtained at successive stages of compression, and in this way we characterize how the network has been deformed during the compression.
Transmission Electron Microscopy TEM was used to obtain images from slices that had been cut through cakes made by hydrodynamic compression of aggregated silica suspensions at a pressure of 100 kPa. The thickness of these cakes was 1200 µm. As explained in Methods, the filtration cell produces a gradient in osmotic pressure, which results in a gradient in the volume fraction of silica particles. The slice were cut along this gradient. An image taken from the middle of the slice of a Ludox - Al137+ cake shows the network of aggregates (Figure 3). At large scales (1 µm), the volume fraction is nearly uniform (the gradient is very small at this scale). At small scales, the aggregates appear rather dense, but this is because the TEM image is a 2-dimensional projection of a 3-dimensional slice (slice thickness 50 nm, particle diameter 15 nm). Still, substantial porosity is apparent between the aggregates; the sizes of the larges voids are on the order of 20 particle diameters. There is no preferred orientation of the aggregates in this or any of the other TEM images, despite the fact that the cakes were made through application of uniaxal pressure.
17
Figure 3. TEM image taken from the middle of a slice cut through a Ludox - Al137+ cake. This is a projection image of the slice (thickness 50 nm) in which the shadows of the particles (diameter
hal-00160022, version 1 - 4 Jul 2007
15 nm) may overlap. The scale bar is 200 nm and the side of the image measures 1 µm. A row of 4 images from the same slice is shown in Figure 4 (a to d). The uppermost image (4d) was taken at the top end of the slice, near the interface between the cake and the permeating solution, where the pressure exerted on the aggregates is the lowest. At this location the network formed by the aggregates appears tenuous and the porosity is large. The next two images (4c and 4b) correspond to parts of the same slice that are located at increasing depths within the cake. They show increasing numbers of silica nanoparticles. The lowest image (4a) corresponds to the lower edge of the slice, where interface between the cake and the membrane is located. At this depth, the mechanical pressure exerted on the aggregates was highest, since each aggregate supports the sum of hydrodynamic drag forces exerted on all aggregates located at higher levels in the cake. The image shows a much denser packing of the silica aggregates, with apparent overlap of the particles, caused by the fact that the image is a projection of a thick slice. The variation of the number density of particles from top to the bottom of the cake demonstrates that the Ludox - Al137+ cakes are compressible in this range of pressures. A row of 4 images taken from a Ludox - Ca2+ cake is shown in Figure 4 (e to f). This row also shows a gradient of the number density of particles, from the top to the bottom of the cake. However, near the top of the cake (4h), the aggregates are much more dense than in the corresponding location of the Ludox - Al137+ cake, and at the next depth in the cake the packing has already reached a high density. These images show the effects of a higher initial density (4h) and from a lower resistance to compression (4g to 4e).
18
hal-00160022, version 1 - 4 Jul 2007
Figure 4. TEM images of two slices cut through filtration cakes. (a to d) Cake made by hydrodynamic compression of a Ludox - Al137+ suspension; the pressure applied to the liquid phase was 100 kPa. The row of 4 images corresponds to locations near the top of the cake (1100 µm above the membrane), in the middle of the cake (800 and 600 µm), and near the membrane, where the lower limit of the cake can be seen. (e to h) Cake made by compression of a Ludox – Ca2+ suspension. The row of 4 images corresponds to locations near the top of the cake (750 µm above the membrane), in the middle of the cake (600 and 500 µm), and near the membrane. Figure 5 presents a similar image taken from the middle of a slice cut through a Klebosol - Al137+ cake. In this case the slice has about the same thickness as the particle diameter (70 nm), hence it is a 2-dimensional section through the aggregates. As in the case of the Ludox - Al137+ cake, there is no preferred orientation of the aggregates, nor any anisotropy of the voids, despite the fact that the cake was made through application of uniaxal pressure.
19
Figure 5. TEM image taken from the middle of a slice cut through a Klebosol - Al137+ cake. The
hal-00160022, version 1 - 4 Jul 2007
slice has about the same thickness as the particle diameter (70 nm), hence it is a 2-dimensional section through the aggregates. The scale bar is 500 nm. Note that there is no preferred orientation of the aggregates despite the fact that the cake was made through application of uniaxal pressure. These observations provide a qualitative view of the structural processes that occur during compression: the larger voids collapse, the dense regions collect more particles and the cake becomes more like a two-phase material. However, these observations are qualitative rather than quantitative. Quantitative measures of some structural parameters are provided by the neutron scattering spectra, which are presented next.
Small Angle Neutron Scattering of the suspensions SANS was used to determine the structures of isolated aggregates in the flocculated suspensions, before the dewatering and compression processes. Many suspensions were made from Ludox dispersions flocculated by Al137+, and their structure factors S(Q) were measured through SANS. Figure 6a shows two spectra taken at different flocculation times for such suspensions; they are identical. They follow a power-law decay over most of the Q range ( interparticle distances ranging between 100 and 2 particle diameters). Such power laws are typical of bushy, selfsimilar structures in which the distribution of matter and voids is repeated at all scales, as discussed in the Methods section. The exponent which characterizes this scale invariance is df = 2.1. It is characteristic of aggregates that were created 20
through Brownian collisions, in conditions where clusters must collide many times before they manage to bind to each other (Reaction Limited Cluster Aggregation [17]). A possible cause for this low efficiency of collisions is that silica surfaces are strongly hydrated, and cannot react with each other unless their hydration water is displaced [32, 33]. Remarkably, the decay continues all the way to Q values corresponding to distances between nearest neighbors (Q = 4 x 10⁻² Å–1). At that distance, S(Q) could have been expected to show a peak, due to the accumulation of neighbors at the same distance (one particle diameter). In fact, the structure factors of Ludox suspensions only show a slight depression and then go straight to unity (as they must) for Q values corresponding to distances within a particle. The absence of a
hal-00160022, version 1 - 4 Jul 2007
peak at a Q value corresponding to the particle diameter indicates that there is no accumulation of neighbors in the coordination shell of a particle. Accordingly, each particle is in contact with a small number of neighbors (typically 3 - 4, as in colloidal aggregates made through Brownian aggregation processes rather than 8 to 12, as in dense structures) [34].
21
hal-00160022, version 1 - 4 Jul 2007
Figure 6. Structure factors of aggregated Ludox suspensions. (a): Silica particles aggregated by addition of Al137+, flocculation times () 1/2 hour, (+) 2 days and () 3 days. The power-law decay is characteristic of colloidal aggregates with a self-similar structure; the fractal exponent, deduced from the slope of the plots, is df = 2.1. The absence of a peak at a distance equal to the particle diameter indicates that each silica particle has a small number of nearest neighbors (3 to 4). (b): Silica particles aggregated by addition of Ca2+ cations, flocculation times () 1/2 hour, (+) 2 days and () 3 days. Other suspensions were made using Ca2+ as a flocculating agent. The addition of Ca2+ to Ludox dispersions was not nearly as efficient in bringing about flocculation. At short times, the structure factors were characteristic of very small aggregates (Figure 6b). The geometrical parameters of these aggregates were determined by fitting the structure factors with the curves calculated for aggregates with a fractal dimension df and a size R, according to the Fisher-Burford approximation [35]: 2 %( d f S (Q) " QR ( ) ' = $$1 + S (0) # 3 d f 2 '&
2
/5/
In the case of suspensions examined 1/2 hour after flocculation, the average radius was R = 42
!
nm; after 2 days it rose to 320 nm. After 3 days the structure factor was a power-law decay over 22
the whole range of Q values, indicating that the aggregates were larger than the largest length scale probed by SANS. The exponent was df = 2.1, as in the case of the Ludox - Al137+ aggregates. Moreover, the absence of a peak at the nearest neighbor distance indicates that each particle was in contact with few neighbors, as in the case of Ludox - Al137+ aggregates. Finally, some suspensions were made with Klebosol particles. Flocculation was always fast, using Al137+ as a flocculating agent (as in the case of Ludox), but also when using Ca2+ (in contrast to to the Ludox – Ca2+ suspensions). As shown in Figure 7, the structure factors are characteristic of large selfsimilar aggregates, as in the case of Ludox suspensions. However there are significant differences. The fractal dimensions are higher for Klebosol suspensions (df = 2.5 in the case of Al137+ and df = 2.7 in the case of Ca2+). These exponents are characteristic of
hal-00160022, version 1 - 4 Jul 2007
aggregates that have become denser as a result of spontaneous restructuring after collisions [3638]. Also there is a significant depression at Q values corresponding to distances about two diameters. Finally, in the case of Klebosol- Ca2+ aggregates, there is a peak at the nearest neighbor distance, as in a liquid with strong short-range order. All these features indicate that the Klebosol aggregates are held together by weak bonds, and reorganize spontaneously to maximize the number of bonds per particle; this restructuring is easier in the case of Klebosol- Ca2+ aggregates.
23
Figure 7. Structure factors of aggregated Klebosol and Ludox suspensions. (Δ): Klebosol aggregated by Al137+ polycations. The slope of the plot yields a fractal exponent df = 2.5, corresponding to a denser structure than in the case of Ludox suspensions. (): Klebosol aggregated by addition of Ca2+ cations. The fractal exponent is df = 2.7, corresponding to a nearly dense structure. The depression and the peak observed at Q = 1 x 10⁻² Å–1 indicate that this dense structure has a strong short-range order. For comparison, the structure factor of Ludox suspensions aggregated by Al137+ is also shown (+). It has a fractal exponent is df = 2.1, corresponding to a bushy selfsimilar structure (see Figure 3).
hal-00160022, version 1 - 4 Jul 2007
Small Angle Neutron Scattering of the cakes Cakes were made by dewatering these suspensions through mechanical compression, as described in the Methods section. Each cake, submitted to a set osmotic pressure, reached a volume fraction that was determined by its compression law. Two pieces were recovered from each cake, one for measuring the silica volume fraction and the other one for examination through SANS. Figure 8a presents the macroscopic compression laws of the different cakes. The Ludox - Al137+ cake started at a low volume fraction (φ = 0.07) and was initially highly compressible (the rise of pressure with volume fraction was slower than φ1.5). Beyond φ = 0.21 the compression became much more difficult. The Klebosol cakes started at a much higher volume fraction and were practically incompressible. These compression laws can be used to relate the compression resistances of cakes to the characteristics of their interparticle bonds. Consider a slice of the cake, of area A, containing a few particles of diameter a; the volume fraction of particles in the slice is φ, and the total pressure applied to the slice is Π. The number of particles in the slice is Aφ /a2, and the force applied to the slice is ΠA, hence the interparticle force is:
F=
" a2 #
/6/
Figure 8b displays the variation of this interparticle force with the volume fraction of each cake.
!
Remarkably, all suspensions have similar compression laws for this interparticle force. 24
hal-00160022, version 1 - 4 Jul 2007
Figure 8. Macroscopic compression laws of cakes. (a): Applied osmotic pressure as a function of the volume fraction of solids in the cake. The symbols refer to the original suspensions: , Ludox-Al137+; , fresh Ludox-Ca2+; , aged Ludox-Ca2+; O, Klebosol - Al137+; Δ, Klebosol - Ca2+. (b): Same plot for the average interparticle force (osmotic pressure multiplied by the square of the particle diameter and divided by the volume fraction - see equation /6/). The structures of the cakes also reflect these two regimes of compression, i.e. a first regime in which the cakes are highly compressible, and a second regime in which they become practically incompressible. In both regimes the scattering patterns were completely isotropic, despite the 25
application of uniaxial pressure. Consequently, the scattering patterns were radially averaged and divided by the particle form factor P(Q) to yield the cake structure factors S(Q). The structure factors of Ludox - Al137+ cakes that were brought to successive stages of compression are compared in Figure 9. It is obvious from this comparison that different phenomena take place at different Q values, i.e. different spatial scales. For convenience, three ranges of Q values are identified in Figure 9, labeled A, B and C. Range A comprises Q values corresponding to nearest neighbor distances, and even larger Q values corresponding to intraparticle distances. In this range the experimental structure factors of Ludox cakes are identical to that of the suspension. The absence of a peak at a Q value
hal-00160022, version 1 - 4 Jul 2007
corresponding to the particle diameter indicates that there is still no accumulation of neighbors in the coordination shell of a particle. Accordingly, each particle remains in contact with the same neighbors that it had in the suspension, and there is no major reordering at that scale. Range B corresponds to distances that are between 2 and 20 particle diameters. In this range, the structure factors of the cakes are depressed with respect to that of the original suspension. This depression means that the spatial distribution of the particles has become more homogeneous [1416]; indeed, a perfectly ordered distribution would give S(Q) = 0. In general, dispersions may become more homogenous either through dissociation of lumps or through compression of voids. Since the cakes have been compressed, only the latter process is relevant. Hence, the depression of S(Q) reflects the loss of porosity in the cake.
26
hal-00160022, version 1 - 4 Jul 2007
Figure 9. Structure factors S(Q) from Ludox cakes made by dewatering and compression of the suspension aggregated by Al137+. Symbols: (), original suspension; (), cake made at 100 kPa; (), 200 kPa; (+), 300 kPa; (), 400 kPa. At intermediate Q values (region B), the structure factors of the cakes are depressed with respect to that of the suspension. This is caused by stronger interparticle interferences, due to the higher particle concentration. At higher Q values (region A), corresponding to distances of nearest neighbors (0.04 Å-1), S(Q) is unchanged, indicating that the structure retains the low coordination of the original aggregates. The depth of the depression in region B varies with the applied pressure, and the variation reflects the changes in volume fraction. At the lower pressures the variation is quite fast: at a pressure Π = 100 kPa, the structure factor S(Q = 0.002 Å-1) is depressed by a factor of 5 with respect to that of the suspension, and at Π = 200 kPa by a factor of 20. This is the range of pressures where the cakes are highly compressible, according to the experimental macroscopic compression laws displayed in Figure 8. On the other hand, at the higher pressures (300, 400 and 600 kPa) the depression saturates and the structure factor does not change any more: according to scattering, the structure has become resistant to compression. This is the range of pressures where the cakes become practically incompressible, according to the experimental compression laws. 27
Range C corresponds to distances that are larger than 20 particle diameters. In this range there is also a striking effect of the pressure on the structure factors of the cakes. At the lowest pressure (Π = 100 kPa), the structure factor has a slow decay (Q-1.5) over ranges C and B. This is indicative of a tenuous structure that has a self-similar distribution of lumps and voids at all scales. At higher pressures, there is a switch to a very steep decay (Q-4) over range C, which is followed by the depression in range B. The Q-4 power-law is characteristic of scattering by a two-phase material, containing regions of high scattering density separated by regions of low scattering density. In general, this could mean lumps dispersed in a homogeneous matrix, or voids dispersed in a homogeneous matrix. This is the reverse feature of that observed in region B: the increase of S(Q) with respect to that at lower pressures could be caused either by the growth of lumps or by
hal-00160022, version 1 - 4 Jul 2007
the formation of voids. Since the cakes have been compressed, only the former process is relevant. Hence, the increase of S(Q) at very low Q reflects the growth of large lumps in the cake. Combining the phenomena observed in ranges B and C, it is straightforward to conclude that voids are getting smaller while lumps are getting larger. It is interesting to compare these phenomena with the two regimes observed in the macroscopic compression law (Figure 8). The onset of a stiff compression resistance occurs at the same pressure where the structure factor demonstrates the formation of a two-phase structure. This means that the dense lumps connect to each other and build a skeleton that resists further compression. Ludox-Ca2+ cakes have very similar structure factors (Figure 10). In this case we investigated the effect of flocculation time. Freshly prepared suspensions contain small aggregates (see Figure 6) with weak interparticle bonds; they yield cakes that pack to a higher volume fraction than LudoxAl137+ cakes prepared at the same pressure. Aged suspensions contain large aggregates, with stronger bonds that result from chemical reactions between silica surfaces. They yield cakes that are more resistant (see Figure 8). Remarkably, the Ludox-Ca2+ cake prepared from a fresh suspension and compressed to 100 kPa has the same structure factor as the cake prepared from the aged suspension and compressed to 300 kPa (Figure 10). It is also identical with the structure factor of the Ludox-Al137+ cake made at 200 kPa. Accordingly, cakes that start with different initial states and have different bond strengths go though the same restructuring processes.
28
hal-00160022, version 1 - 4 Jul 2007
Figure 10. Structure factors from Ludox cakes made by dewatering and compression of suspensions aggregated by Ca2+. Symbols: (), original suspension; (Δ), cake made from the fresh suspension and compressed to 100 kPa; (), cake made from the fresh suspension and compressed to 300 kPa; (+), cake made from the aged suspension and compressed to 300 kPa. Identical structure factors are obtained with a shift in pressure scales for cakes made from fresh suspensions (smaller aggregates) and aged suspensions (larger aggregates). The Klebosol - Al137+ cakes are compressed much more readily than the corresponding Ludox cakes. The measured volume fractions (see Figure 8) indicate that, for the lowest applied pressure (50 kPa), the cakes have already jumped to the final stage of the compression. Figure 11a shows the structure factors of cakes made by dewatering Klebosol suspensions that had been flocculated by Al137+. Already at the lowest applied pressure (50 kPa) the structure factor shows a steep Q–4 decay, followed by a very deep depression and a peak at the nearest neighbor distance. Accordingly, the network of bushy aggregates was replaced by a two-phase material made of dense lumps immersed in a matrix of lower scattering density. Application of higher pressures caused little further changes in the structure factor.
29
hal-00160022, version 1 - 4 Jul 2007
Figure 11. Structure factors S(Q) from Klebosol cakes. (a): suspension aggregated by Al137+ () and cakes made by compression of this suspension (, 50 kPa; +, 100 kPa; O, 200 kPa; , 300 kPa). (b): suspension aggregated by Ca2+ () and cakes made by compression of this suspension (, 50 kPa; +, 100 kPa; O, 200 kPa). Figure 11b shows the structure factors of cakes made by dewatering Klebosol suspensions that had been flocculated by Ca2+. Here the effects of applied pressure are more progressive, as in 30
Ludox cakes. At the lowest applied pressure (50 kPa) the structure factor is somewhat depressed compared with that of the suspension, with a weaker power law decay. At higher pressures, the depression of S(Q) is deeper, intermediate between those of Ludox cakes and those of Klebosol Al137+ cakes. The macroscopic compression ratios (Figure 8) also indicate that, for pressures in the range 50 – 200 kPa, the cakes are still at an intermediate stage of the compression.
Summary of results These results can be sorted out according to the first question raised in the introduction: do all cakes evolve through the same structural processes, with different thresholds corresponding to the
hal-00160022, version 1 - 4 Jul 2007
respective strengths of interparticle bonds, or do cakes with different bonds evolve through different structural processes? In order to examine this question, we have compared different cakes, made with different particles and different interparticle bonds. In the results detailed above, we found a “typical behavior”, in the case of Ludox-Al137+ colloidal aggregates, and variations around this typical behavior for systems with different colloidal particles. The typical behavior was that of Ludox-Al137+ colloidal aggregates, in which compression takes place in 3 stages. Stage 1: The overall compression raises the volume fraction from φ < 0.05 to φ = 0.12. In neutron scattering, this produces a modest decrease of S(Q) at all Q values in ranges C and B of Figure 9. The decrease is strongest at the lowest Q values, corresponding to the largest scales. Accordingly, the structure becomes more homogeneous through void compression, with large voids being compressed more extensively than smaller ones. The local order (range A) remains unchanged. These interpretations are confirmed by the TEM images. Stage 2: The volume fraction rises from φ = 0.12 to φ = 0.23. In neutron scattering, this produces a dramatic depression of S(Q) at intermediate Q values (range B in Figure 9). Accordingly, the structure becomes still more homogeneous through the collapse of voids with diameters in the range 2-20 particle diameters. The local order (range A) remains unchanged. Simultaneously, there is a rise of S(Q) at the lowest Q values, and the decay of S(Q) throughout range C becomes quite steep (Q–4). Accordingly, large dense regions (lumps) have been formed.
31
Stage 3: The volume fraction remains stuck at φ = 0.23, and likewise the structure factor S(Q) no longer changes. Accordingly, the dense lumps have formed a rigid skeleton that resists further compression. Two different compression behaviors have been found in other colloidal systems. In suspensions containing Klebosol aggregates (Figure 11), before compression, the structure factors already have the steep decay and depression that are characteristic of dense aggregates. Accordingly, colloidal aggregates with weak bonds may increase their number of bonds by jumping directly to stage 3. On the other hand, cakes made of particles that have been flocculated through a pH shift [1] are much less compressible than all silica cakes: the pressures measured at low volume
hal-00160022, version 1 - 4 Jul 2007
fractions (φ = 0.1) are quite high already (about 100 kPa), and they rise rapidly with volume fraction (Π ≈ φ4). Accordingly, colloidal aggregates with stronger bonds may remain in stage 1. The structural results also provide an answer to the second question raised in the introduction, concerning the geometrical nature of the deformation process. The simplest type of deformation (from a geometrical point of view) would be an affine deformation where all distances are compressed in the same ratio as macroscopic dimensions. For a cake submitted to uniaxial pressure, this would yield an anisotropic scattering pattern. However, all TEM images and all experimental scattering patterns have been completely isotropic. Even in the case of isotropic compression, an affine deformation would give structure factors that would be quite different from those observed here. Indeed, a uniform compression of all distances by the same ratio would produce a simple shift of the structure factor in the log scales used in Figures 9 and 10. In fact, the experimental structure factors of cakes reveal a much more complex deformation, in which the structure factors are unchanged at short distances, depressed at intermediate distances (compression of voids) and increased at very large distances (formation of lumps). The reason for this non-affine deformation may be that some regions in the cake are stiffer than others, i.e. the denser regions are stiff and the less dense ones are more easily deformable. Qualitatively, it is easy to imagine that the largest voids will collapse, making the cake more homogeneous as a whole; meanwhile, the denser regions (“cores” of the aggregates) will be pushed into the less dense ones, accumulate more particles, turn into 3-dimensional lumps and get closer to each other until they form a continuous skeleton. However, quantitative models of the compression processes are needed to assess the value of this qualitative interpretation. 32
Models Beyond the description of the compression processes for colloidal silica cakes (stages 1, 2, 3 above), it would also be useful to make predictions for the compression behavior of any colloidal aggregates, knowing the strength of interparticle bonds and the initial volume fraction. For this purpose, we need to make a model of the colloidal network. In the following, we present 2 models. The first model does not attempt to describe each interparticle bond explicitly. Instead, it focuses on space filling constraints originating from the finite volume of the particles. This model provides a good approximation to the structure of the compressed cake at high volume fractions, where excluded volume effects become dominant. On the other hand, it cannot make
hal-00160022, version 1 - 4 Jul 2007
any predictions concerning the compression law. The other model takes into account explicitly each interparticle bond. This model produces a compression law that is related to the characteristics of these bonds. On the other hand, since it can only handle a small number of particles and bonds, it cannot provide an accurate picture of the structure.
Inhomogeneous hard sphere liquid In this model we describe the cake as a 2-phase material. The low-density phase is a colloidal liquid made of particles dispersed in a solvent. These particles interact as hard spheres, i.e. the interaction energy is infinitely repulsive if they overlap, and it vanishes when they are not in contact. The high-density phase is made of aggregated particles. The lumps that contain these aggregated particles are space-filling (df = 3), and they have a uniform volume fraction of particles. They form the skeleton that produces the resistance to compression. The scattering from the low-density phase is calculated using the known analytical expression for the structure factor of a hard sphere liquid [20]. This has a depression in ranges B and C and a very small peak in range A (Figure 1). The volume fraction of the low-density phase is chosen so that the depth of the depression matches the depression of the experimental S(Q). The contribution from the dense lumps dispersed in the low-density phase is calculated in the limit where these lumps are very large. In this case their contribution to the scattering originates from the interfaces that separate both phases. If the interfaces are sharp, this contribution must
33
follow Porod’s law, i.e. a Q-4 decay. The prefactor of this power-law decay is proportional to the area of interface between the lumps and the low-density phase. Figure 12 presents the fit of a Ludox-Al137+ cake spectrum by the model. The depth of the depression is reproduced if the volume fraction of silica in the low-density phase is φ1 = 0.16, below the experimental volume fraction of silica in the cake, φ = 0.24. Assuming that this discrepancy originates entirely from the contribution of the denser phase and assuming that this denser phase has a volume fraction φ2 = 0.54 that corresponds to the glass transition of the hard sphere system [39], we estimate that the lumps occupy at most 20 % of the cake volume. Note that a higher volume fraction of the dense phase would show up through a peak at the nearest
hal-00160022, version 1 - 4 Jul 2007
neighbor distance, which is not the case.
!
In order to calculate an average dimension of the lumps, we use the normalized form of Porod’s law: Qmax
d Porod =
V =" A
#
Q 2 I(Q) dQ
0
/7/
4 Lim Q I(Q) Q
%$At small Qmax values, corresponding to scattering by the aggregates, this length has a value that is 100 times larger than its value at high Qmax, corresponding to scattering by the individual particles. Hence, the average diameter of the lumps in the most compressed Ludox-Al137+ cake is 50 times that of a particle. This diameter presumably does not change with pressure, since the spectra no longer change after the dense lumps have connected to form a skeleton. The quality of the fits indicates that the description of cake structures as 2-phase materials is accurate at high volume fractions (φ > 0.2). For the low-density phase, the agreement with the hard sphere liquid indicates that all voids have been filled up, so that the organization of particles is determined by space filling constraints only. For the high-density phase, the fit with Porod’s law indicates that it is indeed made of space-filling domains (df = 3), created by a process in which the cores of the colloidal aggregates collect particles as they are pushed through less dense regions.
34
On the other hand, this model is unable to make predictions concerning the compression law of
hal-00160022, version 1 - 4 Jul 2007
the cakes, since it does not describe the bonds explicitly.
Figure 12. Two-phase model of the cakes. The data are the structure factors of the Ludox-Al137+ cake compressed at 400 kPa (O), and that of the original suspension (+). The full line is the structure factor of the low-density phase, calculated using a liquid structure model with a volume fraction of particles φ = 0.14. The dashed line is the structure factor calculated for a two-phase material, including an additional Q-4 contribution from the high-density phase.
Bond network In this model we describe the cake as a system of hard spheres that are connected to each other by surface-to-surface bonds [40]. The bonds are harmonic springs attached to pins located at the surfaces of the spheres. The number of pins on the surface of a sphere is large enough that two neighboring spheres are connected by many springs, producing non-central forces that give a resistance to bending to the colloidal aggregates. Springs are automatically created if two pins from distinct spheres come within a minimal distance la; they are automatically destroyed if this distance is stretched beyond a maximal length ld; their length at rest is l0, which is conveniently set at l0 = la (the aggregates are created with the spheres at their equilibrium distance). In order to 35
simulate aggregated colloidal particles, l0 and la are taken as a small fraction of the particle diameter a (l0 = la = 0.05a), and ld is varied from values that are barely larger (ld = 0.06a for fragile bonds) to values that are much larger (ld = a for resilient bonds). We consider a set of N such particles, all having the same diameter (typically N = 512 or 1024). A cluster will be a connected set of particles, or an isolated particle. In order to generate a colloidal network, a Reaction Limited Cluster Aggregation process is used to create clusters of these spheres, with fractal dimension df = 2: aggregates are created through Brownian collisions, in a process where clusters must collide many times before they manage to bind to each other [17]. At each iteration step, two clusters are chosen randomly and are combined together to form a larger cluster, after choosing randomly a sticking configuration among all the possible joined
hal-00160022, version 1 - 4 Jul 2007
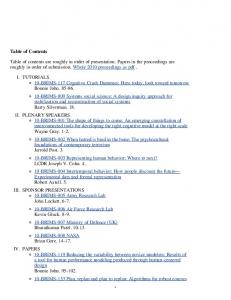
configurations of the two initial clusters, which do not result in particle overlaps. The aggregation is irreversible. This process is iterated and stopped when the desired average number of particles per cluster is obtained here: 8 particles per cluster in average is required. These clusters are then sedimented in a box where they connect to each other, forming the network. The box has periodic boundary conditions in the y and z directions, so that when a particle leaves the box in one of these directions it reenters on the opposite side. In the x direction, however, the boundaries are impenetrable walls. Pressure is applied to the upper x boundary, as a force applied to the highest particles. Since the resistance against this force originates from the springs, the unit of force is the spring constant multiplied by the length of a spring at rest. A compression step is performed as follows: when the external force Fext is applied to the top particles, they are displaced by an amount ∂x = α Fext. The rest of the system is then relaxed according to the forces and torques transmitted by the springs, i.e. the other particles are displaced by ∂x = α Fint and rotated according to the torques. This relaxation step is repeated many times in order to ensure proper propagation of stresses throughout the aggregates. This process insures the tendency to restore dynamically the force balance in the system. The final volume of the box at the end of a compression step is taken as measure of the volume fraction of the dispersion in a quasi-static mechanical equilibrium. Another compression step is then performed, and in this way the whole compression curve is recovered as a succession of quasistatic steps at mechanical equilibrium. Some pictures of the box at intermediate stages of compression are shown in Figure 13. Note that these pictures are projection images of the box
36
onto a plane that is parallel to the compression direction; hence, the projection images of many particles overlap, and the aggregates appear denser than they really are. Nevertheless, these
hal-00160022, version 1 - 4 Jul 2007
pictures are useful to verify that the aggregated dispersion has been uniformly compressed.
Figure 13. Projection images of the colloidal network, taken at various stages of compression. The original locations of the impenetrable walls are indicated as dashed vertical lines. The volume fractions of particles in the box are respectively 0.06 (left), 0.3 (middle) and 0.63 (right, full compression). Compare with the TEM images of the real cakes, shown in Figures 3 and 4. Many aggregated dispersions have been generated, and for each one a compression experiment has been performed as a succession of quasi-static equilibria at increasing applied pressures (Figure 14). It was noted that the system remains fairly homogeneous and isotropic in any compression process that is made of such quasi-static equilibria, in agreement with the remarkable result of the oedometer experiments (see also Figures 3 and 5). Remarkably, the compression curves obtained for aggregates generated with different initial conditions but identical spring parameters are the same. Consequently, the compression behavior of these aggregated dispersions is uniquely determined by interparticle forces, as was found in the real systems. When interparticle forces (spring parameters) are changed, the compression curves are changed as well. The parameters that characterize a spring are the spring constant, equilibrium length and maximum stretching length. The first two parameters determine the unit of force, so that their values can be used to match the scale of applied pressures to those of the real system.
37
hal-00160022, version 1 - 4 Jul 2007
Figure 14. Compression curves of model aggregates, obtained through numerical simulation. The steep rise of pressure (Π ≈ φ4.4) in the upper set of data (Δ, bond rupture energy Ed> 360) corresponds to an elastic response of the particle network; the slower power law (Π ≈ φ1.7) in the intermediate sets of data (♦, Ed = 9, and O, Ed = 4) to a plastic response where bonds are continuously broken and created; the lower sets (full lines, Ed = 0.04) to a fragile network that is unable to withstand any applied pressure. The compression behavior of these aggregates at large φ can be compared with the experimental results shown in figure 8. The maximum stretching length ld/l0, or the reduced stretching energy Ed = [(ld /l0) - 1]2, determine how the network of springs responds to stress. At very high values of (ld /l0) (or Ed), the springs do not break at all, and the network has a purely elastic response to the applied stress. In this regime, the pressure rises as a power law of the volume fraction with a high exponent (4.4). This power law matches theoretical predictions [41] and also experimental compression data obtained on dispersions of mineral particles [1, 42]. At intermediate values of ld /l0, the springs do break when the pressure exceeds a certain threshold, and the network has a plastic response to the applied stress. In this regime, the pressure also rises as a power law of the volume fraction, but with a much lower exponent (1.7). This power law is close to the behavior observed at low 38
volume fractions in the Ludox - Al137+ networks (Figure 8a). Finally, for ld/l0 close to unity (or low values of Ed), the springs break quite readily, and the network is very fragile: as soon as pressure is applied, many springs are broken and the system is unable to create a network that would support the applied pressure; hence it collapses to maximum density. This behavior matches that of the Klebosol aggregates (Figure 8a). In practice, these compression laws can be used to relate the compression resistances of cakes to the characteristics of their bonds. In equation /6/ we have estimated the average interparticle force as F = Πa2/φ. This force will break bonds when they reach a length ld; consequently the bond breaking energy per particle is:
hal-00160022, version 1 - 4 Jul 2007
U d = F (l d " l 0 )
!
/8/
For Ludox-Al137+ cakes, the lowest interparticle force (F = 0.2 nN) is enough to enter the plastic regime where many bonds are broken and the pressure rises as φ 1.7 (Figure 8). Taking (ld – l0) = 0.1 nm yields Ud = 2 x 10–20 J = 5 kT. This is an upper estimate, since the full force is applied to only some of the particles. This estimate explains why aggregates of globular colloidal particles that are held together by ionic bonds may evolve through plastic deformation. For the zirconia cakes studied by Zukoski et al. [1], the highest interparticle force (F = 16 nN, calculated with a = 57 nm and φ = 0.2) is not enough to get out of the elastic regime, where the bonds do not break and the pressure rises as φ 4.4. The bond rupture energy is Ud = 1.6 x 10⁻¹⁸ J = 400 kT. This is indeed such a large energy that the bonds cannot be broken at ordinary pressures. Hence, aggregates of colloidal particles that are aggregated by direct surface-surface bonds may not enter the plastic regime. The opposite behavior is that of Klebosol-Al137+ aggregates, which reorganize spontaneously in the suspension (Figure 7) and go to the densest packing at the lowest applied pressures (Figure 8). Accordingly, the energy of these fragile bonds must be on the order of kT. Finally, the fact that there are only three types of compression laws provides a clear answer to the first question raised in the introduction: do all cakes evolve through the same structural processes, with different thresholds corresponding to the respective strengths of interparticle bonds, or do cakes with different initial structures, or made of different particles, or with different bonds, evolve through different structural processes?
39
(a) We may ignore the effect of the initial structures; numerical simulations performed with different initial aggregates show differences in the very first stages of compression, but identical compression laws when the volume has been reduced by a factor of 2. This is also supported by experimental observations, since cakes made from different suspensions but with the same flocculating agent have always given the same compression behavior. (b) According to the numerical model, a variation in particle sizes changes the number of particles and the number of particles. This will change the pressure scales of the system, but not the generic nature of the compression behaviors. (c) Aggregates, cakes or networks made with different bonds can evolve through different processes, but there appears to be only three compression regimes, i.e. the elastic, plastic
hal-00160022, version 1 - 4 Jul 2007
and fragile compression regimes found in the numerical model and also in the experiments on colloidal aggregates.
Conclusions Cakes or pastes that are made of aggregated colloidal particles can hold a large amount of liquid phase: with nanometric silica particles dispersed in water, the volume fraction of solids in the cake can be less than 5 % of the total volume. Solid / liquid separation (e.g. dewatering) is opposed by the resistance of bonds that connect the particle surfaces to each other and maintain the structures of the colloidal aggregates. When sufficient osmotic pressure is applied, these cakes yield and shrink to a new volume fraction such that the yield stress of the colloidal network balances the applied osmotic pressure. The structural processes by which these cakes yield to applied osmotic pressure follow a general course, made of three stages: Stage 1: Very few interparticle bonds are broken. Displacements of colloidal aggregates within the cake lead to the collapse of the largest voids. The smaller voids and the local structure remain unchanged. Stage 2: The compression causes the rupture of bonds everywhere in the cake and the collapse of voids with diameters in the range 2-20 particle diameters. As a result, the less dense outer regions of the aggregates are compressed and they form a homogenous colloidal dispersion. Meanwhile, the denser cores of the aggregates are pushed through this soft material, collect more particles, 40
and turn into dense space-filling lumps. In this plastic deformation regime, the compressive yield stress rises relatively slowly according to the power law Π = φ1.7. Stage 3: The dense lumps have been pushed in contact with each other, and they build a rigid skeleton that resists further compression. As a result, the compressive yield stress rises quite rapidly while the volume fraction remains at the value set by the skeleton. Two different compression behaviors have been found in other colloidal systems. On the one hand, colloidal aggregates with weak bonds may jump directly to stage 3, in order to increase their number of inter particle bonds. On the other hand, cakes with much stronger bonds respond with elastic deformation, and their compressive yield stress rises much more rapidly with volume
hal-00160022, version 1 - 4 Jul 2007
fraction, according to the power law Π ≈ φ4 [1, 42]. A common feature of these compression processes is that the microscopic deformation is not at all affine to the macroscopic deformation. For instance, the microscopic structures are isotropic even when the macroscopic compression was uniaxial. This originates from the fact that colloidal cakes are extremely heterogeneous in density and in mechanical resilience (see Figure 3): the dense regions, originating from the cores of the aggregates, must be quite stiff, whereas the less dense regions, originating from the outer parts of the aggregates, are much weaker. Consequently the compression does not proceed through a uniform compression of the network, but rather through the sequential collapse of all weaker regions of the cake. Remarkably, this mechanical heterogeneity persists all the way to the final stages of compression, even though the structures of the cakes tend to become more homogeneous. Indeed, the plastic compression regime (stage 2) ends when the dense lumps connect to each other and form a continuous skeleton. In this “jammed” regime (stage 3), most of the stress is supported by a small fraction of the network (the skeleton), while the rest of the material (the less dense regions) fills the space between the columns of this skeleton and contributes to their lateral stability, as is often the case in granular media.
References 1
Miller, K.T.; Melant, R.; Zukoski, C.F. J. Am. Ceram. Soc. 1996, 79, 2545
2
Brown, L.A.; Zukoski, C.F.; White, L.R. AICHe J. 2002, 48, 492 41
3
Antelmi, D., Cabane, B., Meireles, M., Aimar P. Langmuir 2001, 17, 7137
4
Bergström, L.; Schilling, C.H.; Aksay, I.A. J. Amer. Ceram. Soc. 1992, 75, 3305
5
Desset, S.; Spalla, O.; Cabane, B. Langmuir 2000, 16, 10495
6
Green, M.D.; Boger, D.V. Ind. Eng. Chem. Res. 1997, 36, 4984
7
Aksay, I.A.; Schilling, C.H. in Ultrastructure processing of ceramics, glasses and
hal-00160022, version 1 - 4 Jul 2007
composites; chapter 34 p 439, L.L. Hench and D. R. Ulric Eds., Wiley 1984 8
Waite, T.D.; Schäfer, A.I.; Fane, A.G.; Heuer, A. J. Colloid Interface Sci. 1999, 212, 264
9
Evans, D.F.; Wennerström, H. The colloidal domain; Wiley-VCH, New York 1994
10
Velamakanni, B.V.; Chang, J.C.; Lange, F.F.; Pearson, D.S. Langmuir 1990, 6, 1323
11
Colic, M.; Franks, G.V.; Fisher, M.L.; Lange, F.F. Langmuir 1997, 13, 3129
12
Champeney, D.C. Fourier transform and their physical applications; Academic Press 1973
13
Lindner, P. in Neutrons, X-rays and light: scattering methods applied to soft condensed matter; chapter 2, P. Lindner and T. Zemb Eds., North Holland 2002
14
Hayter, J.B., Faraday Discuss. Chem. Soc. 1983, 76, 7
15
Cebula, D.J.; Goodwin, J.W.; Jeffrey, G.C.; Ottewill, R.H.; Parentich, A.; Richardson. R.A. Faraday Discuss. Chem. Soc. 1983, 76, 37
16
Chang, J.; Lesieur, P.; Delsanti, M.; Belloni, L.; Bonnet-Gonnet, C.; Cabane, B. J. Phys. Chem. 1995, 99, 15993
17
Jullien, R.; Botet, R. Aggregates and fractal aggregates; World Scientific, Singapore 1987
18
Hansen, J.P.; Mac Donald, I. Theory of simple liquids; Academic Press 1986
19
Egelstaff, P.A. An introduction to the liquid state; Oxford 1994
20
Ashcroft, N.W.; Leckner, J. Phys. Rev. 1966, 145, 83
21
Ghosh, R.E.; Egelhaaf, S.U.; Rennie, A. R. A computing guide for small-angle scattering experiments; ILL98GH14T, ILL, Grenoble 1988
22
Iler, R.K. The chemistry of silica; Wiley 1979
42
23
Foissy, A.; Persello, J. in The surface properties of silicas; chapter 4B p 365, A.P. Legrand Ed.., Wiley 1998
24
Montgomery, J.M. Water treatment, principles and design; Wiley 1985
25
Lartiges, B.S.; Bottero, J.Y.; Derrendinger, L.S.; Humbert, B.; Tekely, P.; Suty, H. Langmuir 1997, 13, 147
26
Parneix, C. Agrégats colloidaux destnés au renforcement des élastomères; Thèse,
hal-00160022, version 1 - 4 Jul 2007
Université de Franche Comté, Besançon 2006 27
Jönsson, Bo; Wennerström, H.; Nonat, A. ; Cabane, B. Langmuir 2004, 20 6702
28
Depasse, J.; Watillon, A. J. Colloid Interface Sci. 1970, 33, 430
29
Depasse, J. J. Colloid Interface Sci. 1997, 194, 260
30
Routh, A.F., Vincent, B. J. Colloid Interface Sci. 2004, 273, 435
31
Sorensen, P.B.; Moldrup, P.; Hansen, J.AA. Chem. Eng. Sci. 1996, 51, 967
32
Allen, L.H.; Matijevic, E. J. Colloid Interface Sci. 1969, 31, 287
33
Pashley, R.M. J. Colloid Interface Sci. 1981, 83, 531
34
Diez Orrite, S.; Stoll, S.; Schurtenberger, P. Soft Matter 2005, 1, 364
35
Kallala, M.; Sanchez, C.; Cabane, B. Phys. Rev. E 1993, 48, 3692
36
Amal, R.; Coury, J.R.; Raper, J.A.; Walsh, W.P.; Waite, T.D. Colloids Surfaces 1990, 46, 1
37
Amal, R.; Raper, J.A.; Waite, T.D. J. Colloid Interface Sci. 1990, 140, 158
38
Amal, R.; Raper, J.A.; Waite, T.D. J. Colloid Interface Sci. 1992, 151, 244
39
Rintoul, M.D., Torquato, S. Phys. Rev. Lett. . 1996, 77, 4198
40
Botet, R.; Cabane, B. Phys. Rev. E. 2004, 70, 031403
41
Brown, W.D.; Ball, R.C. J. Phys. A 1985, 18, L517
42
Buscall, R.; Mills, P.D.A.; Goodwin, J.W.; Lawson, D.W. J. Chem. Soc. Faraday Trans. I 1998, 84, 4249
43