Department of Architecture and Civil Engineering, University of Bath, Bath ... Vulnerability assessment for historic buildings is usually carried out using capacity.
Bulletin of Earthquake Engineering (2005) 3:235–265 DOI 10.1007/s10518-005-1239-x
© Springer 2005
Force and Displacement Based Vulnerability Assessment for Traditional Buildings DINA F. D’AYALA Department of Architecture and Civil Engineering, University of Bath, Bath BA2 7AY, United Kingdom (Tel.: +44-1225-386537; Fax: +44-1225-386691; E-mail: D.F.DAyala@ bath.ac.uk) Received 21 July 2004; accepted 11 May 2005 Abstract. Vulnerability assessment for historic buildings is usually carried out using capacity based approaches and prediction of losses is obtained by using normal or lognormal distributions for expected levels of macro seismic intensity or peak ground accelerations. Several authors have outlined the limitations of such approach. The paper presents a method to correlate analysis of seismic vulnerability using a failure mechanisms approach to observed in situ damage. The various aspects of the procedure are highlighted with application to a real case. It is shown how once the typologies within a sample have been identified, fragility curves for each of them can be derived and predictive cumulative damage curve obtained for samples for which direct survey of damage data is lacking. Finally the paper shows how the failure mechanism approach can be used to derive damage scenarios both in terms of spectral acceleration and spectral displacement. Key words: damage scenarios, fragility curves, historic buildings, oriel fac¸ades
1. Introduction The definition of a holistic procedure for the seismic assessment of existing building stock and prediction of losses relies on the following steps: classification of buildings, by typology and seismic design; definition of damage states; assignment of capacity curves; definition of demand spectra (with performance related level); evaluation of building response; and provides as output fragility curves and damage scenarios. As outlined by Kircher et al. (1997) this is the approach recently included in the HAZUS methodology (HAZUS, 1999). The damage levels are directly related to the demand parameter, which is expressed in terms of displacement, or drift. As the fragility curves are developed on the basis of lognormal distributions, once the typologies have been defined, it is not necessary to have a detailed knowledge of the building stock. All is required are the parameters defining the capacity curve for each typology, the various damage thresholds and the number of buildings belonging to each typology. If the building stock is built according to previous or current seismic codes, then the structural behaviour and hence the
236
DINA F. D’AYALA
capacity curve can relatively easily be defined, taking into account possible over strength and lack of ductility of real cases. Damage thresholds are of more difficult definitions, especially in displacement terms as there is little data of the progression of damage and deformation for built structures. However for recent structures, whose design is based on drift then this can be converted to spectral displacement relatively easily. Various theoretical formulation for existing buildings belonging to these categories have been proposed, for instance by Calvi (1999). Finally the distribution of the building stock by typology can be obtained through census data or other forms of survey. The approach outlined above has been extensively applied to the assessment of concrete frame buildings, implementing variations that reflect regional aspects characterising both hazard and exposure (Gulkan and Sozen, 1999). In some cases it has also been possible to calibrate the vulnerability functions on observed damage data collected in the aftermath of earthquakes (Rossetto and Elnashai, 2003). Those applications have proven the general validity of the approach. Notwithstanding such validity, the possibility of analysing the vulnerability of existing historic masonry building using the displacement demand method is not at all straightforward. So far the approach most commonly adopted in Europe is the derivation of damage probability matrix based mainly on observed damage, limited structural assessment and expert judgement (Giovinazzi and Lagomarsino, 2003; Goretti and Di Pasquale, 2002). This is due to the difficulty of using a generic structural model, to the absence of codification of structural behaviour, owing to perceived substantial differences in construction materials and methods with geographical variation. An alternative to this approach is the study of existing damage data for given building stock population and the correlation of this to the level of shaking, perhaps express in terms of spectral displacement. Among successful attempts are worth considering Lang and Bachmann (2004) and the application included in Erdik (2003), a study for the earthquake risk assessment of Istanbul Metropolitan Area. The relevance of the first example, a study of buildings in Basel, is due to the interest for existing historic masonry buildings. Here it is assumed that the prevalent behaviour of the building is as a set of shear walls, and that out of plane failure is prevented by construction. A capacity curve is a priori defined based on existing literature and the inelastic displacement demand is related to the elastic spectral displacement, as function of the natural period, the participation factor and a factor representing the ductility demand and the strength reduction factor. A vulnerability function is then obtained by introducing the damage state of the EMS’98 as points along the displacement demand/spectral displacement relationship.
VULNERABILITY ASSESSMENT FOR TRADITIONAL BUILDINGS
237
The relationship between damage and displacement, however, is not explicit and the out of plane behaviour is not analysed. The work contained in Erdik (2003) is an application of the HAZUS (1999) procedure, with some of the coefficients modified to take into account local building characteristics and available local damage data. Fragility curves and displacement based cumulative damage distributions for masonry buildings are proposed, and will be used as term of reference for the curves obtained with the present study. In the following sections first a derivation of vulnerability functions based on limit state analysis and failure mechanisms, is presented and validated with respect to observed damage data. From the vulnerability functions fragility curves are then derived and their general applicability to samples without damage data is discussed. Next a consistent procedure for the derivation of fragility curves based on displacement is outlined. The possibility and reliability of damage scenarios obtained through this procedure is finally discussed by application to a sample of buildings in the historic districts of Fener and Balat in Istanbul, Turkey.
2. Force-based vulnerability analysis The possibility of building competent seismic structures relies, not only on a certain common level of technical knowledge, which can be traced and identified through observation of the current surviving and strengthened building stock, but also, on the necessary economic resources needed to acquire the correct materials. Therefore, the seismic performance of masonry buildings is directly related to the mechanical quality of the masonry fabric. Layout of regular stones, of similar size well staggered from one course to the next, with sufficient through thickness connections, if the wall is made out of more than one leaf, will clearly ensure a better structural integrity. In the field, it will be possible to find different levels of regularity of the fabric from rubble masonry made of fieldstone, to regularly dressed well squared and graded ashlars stones. The comparison of failure mechanisms associated with rubble, as opposed to regular dressed stone masonry, eloquently illustrate this point. Experimental work carried out in the past decades (Tomazevic and Anicic 1989; Ceradini, 1992; Giuffr`e, 1993) has shown that both the masonry fabric and the level of connection among orthogonal walls play an essential role in the seismic response of these buildings. Given the observed correlation, it is feasible to identify recurring structural details which characterize the seismic behaviour and to correlate the presence of these with specific capacity, damage patterns and collapse mechanisms.
238
DINA F. D’AYALA
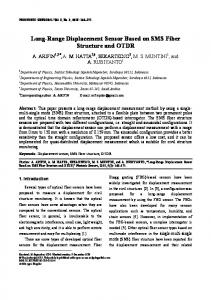
2.1. The famive procedure Following an approach first proposed by Giuffr`e (1991) the FaMIVE procedure (D’Ayala and Speranza, 2002) models the masonry fabric as an ideal opus quadratum, characterized by a perfectly regular layout of the units, leading to the highest possible level of contact among them, and hence integrity of the whole. The results obtained (D’Ayala and Speranza, 2003) are in good agreement with experiments aimed at assessing the collapse load factor for in plane failure of blockwork walls without bonding agents (Ceradini, 1992). Specifically the formulation proposed is able to correlate the overall capacity of the wall to three fundamental parameters, the angle of friction, the relative dimensions of blocks and wall, and the block staggering ratio. Figure 1 shows the ratio of lateral capacity to gravity loads over a crack of variable inclination for different values of staggering ratio (s/h, where s is the staggering between two consecutive courses of masonry and h is the height of the masonry course) and different shape ratios of walls (L/H , where L is the in plane width and H is the in plane height of the wall). The results are compared with the monolithic continuum model for the same shape ratios. It can be seen that this underestimates the actual capacity of the wall, especially in the case of slender walls and for small angles of crack (measured from the vertical), representing therefore a lower bound of actual solutions. The two assumptions of the model, relating to perfect regular staggering and to the contact surface perfectly coinciding with the geometric surface are clearly abstractions from reality, especially in cases in which the masonry units are only roughly squared and of variable size. The FaMIVE procedure takes this into account by a proportional reduction of the staggering ratio, as a function of the irregularity of the units. The calibration of these coefficients has been carried out through direct comparison of different masonry fabrics and of results of experimental work published by Baggio and Carocci. (2000). The programme FaMIVE, using the concepts of limit state analysis for non-conforming materials, correlates collapse mechanisms to specific constructional features of the external bearing walls forming a masonry building (D’Ayala et al., 1997; D’Ayala, 1999). The analysis is static equivalent and quantifies the collapse load factor (as a percentage of gravity acceleration, g) associated with each mechanism so as to determine a lower bound of the level of shaking which will trigger the onset of a specific failure mechanism. On this basis, it is possible to produce a prediction of most probable damage modes and levels of vulnerability for individual or groups of buildings, in relation to expected levels of shaking at a site. It is also possible to analyse the reduction in vulnerability obtainable by introducing selected types of strengthening.
VULNERABILITY ASSESSMENT FOR TRADITIONAL BUILDINGS
239
Figure 1. Adimensionalised ratio of total lateral load capacity (Ctot ) to total weight of panel (Wtot ) for coefficient of friction µ = 0.4, as function of angle of crack from vertical (αc ).
The methodology can be applied to medium size samples of buildings without forfeiting a sufficiently detailed analysis of the geometric, typological and structural parameters that characterised the analysed buildings. This specific feature of FaMIVE is strictly related to the way in which the data collection is organised: the on site inspection concentrates on those parameters which can directly influence the seismic performance of masonry buildings and can be satisfactorily surveyed from the street. In this way, the method minimises the surveying time and the need for pre-existing information (plans, etc. . .) while providing an analytically based vulnerability assessment. During the survey, the operator is required to identify, within the urban centre under study, recurring typological layouts, masonry fabrics, quality of materials and workmanship. Each of the identified typologies are further analysed by a detailed survey of a few specimens. This set of data directly relates to the local construction techniques and availability of materials, as usually only a limited number of architectural, structural and material typologies are present in a given urban centre. Once these are classified, for each building fac¸ade, the surveying activity from the street consists in recognising the pertinence to a given class for a specific feature (masonry type, floor type, connection, etc), and then the associated set of data is directly applied. FaMIVE is implemented as a number of macros directly linked to an electronic database filled in on site by use of an electronic form. It
240
DINA F. D’AYALA
calculates the seismic vulnerability of each fac¸ade as a function of the collapse load factor, the type of mechanisms and the extent of structure collapsing, according to the following formula: � � dc de V = max (1) ESC i where ESC, the collapse load factor, is a function of the slenderness, the connection with other walls and floor structures, the masonry fabric and the friction coefficient; de and dc are two coefficients measuring the extension of the fac¸ade and floor structures involved in the collapse and the catastrophic character of the collapse, respectively. The index i refers to the fact that for each fac¸ade a number of feasible mechanisms are considered, depending on constraint conditions and connections with other walls and floors. The term in parenthesis in Equation (1) is calculated for each of the feasible mechanisms and the one yielding the maximum product V is taken as the measure of that fac¸ade vulnerability. Depending on the value of Equation (1), four classes of seismic vulnerability are defined: low, medium, high and extreme. These classes have proved to have good correlation with damage levels (D’Ayala, 2000) observed in occasion of earthquakes in area of macroseismic intensity VIII, for both MMI and EMS’98 scales. Figure 2 shows the mean regression curves obtained for each class of vulnerability as a function of the two parameters Is = 1/ESC measuring the structural performance, and If = di∗ de , measuring the extent and type of failure, as explained with reference to Eq. (1). These have been normalised to a base of 1. The database contains four sets of data, two for stone masonry and two for brickwork for a total of about 400 data points. It should be noted that, apart for the class low vulnerability, the correlation factors are greater than 0.7, showing good consistency among the different samples. The low correlation factor of the first class is to be attributed to the paucity of data in the range of high structural index and low failure index. This is because even if mechanisms producing this combination occur, the procedure would automatically choose other mechanisms with perhaps lower structural index and higher extent of damage, as a measure of greater vulnerability. 2.2. Derivation of fragility curves The procedure introduced above provides the level of seismic capacity of a fac¸ade in terms of equivalent static forces, or base shear, expressed as a proportion of the gravity loads, and some information on the mode of failure. As this value has been obtained by using a limit state approach it can be assumed that it represents either the first cracking limit state (elastic limit) or the beginning of the plastic phase (without further increase in
VULNERABILITY ASSESSMENT FOR TRADITIONAL BUILDINGS
241
Figure 2. Database vulnerability distribution with boundary and lognormal regression curve for each class of vulnerability.
force), after a sufficient number of hinges has formed to trigger a mechanism. The second will be the case if the masonry system, as it usually happens, is highly hyperstatic. Hence the value of the collapse load factor can be associated with damage D3, with reference to the 6-point scale of ¨ EMS’98 (Grunthal, 1998). This is equivalent to assuming certain ductility in the mechanical behaviour of masonry walls, which means that whatever the succession of cracks to completely define the mechanism, no fragile local failure will occur before the mechanism itself has fully developed. This assumption is admissible for sufficiently bonded masonry and usually confirmed by both in situ observation and experimental results (Benedetti et al., 1998). Further levels of damage might be associated to an increase either in displacement or acceleration. As the measure of vulnerability provided by FaMIVE represents an intrinsic feature of the building, which associates a given level of response acceleration to a specific level of damage, the extension of these results to different levels of seismic input and hence different levels of damage is not immediate. However taking into account that Figure 2 proves that for each vulnerability class there is substantial correlation between collapse load factors, type of mechanisms and extension of collapsed portion, it is possible to derive for each vulnerability class a specific fragility curve, by considering the increase or decrease of damage for corresponding increase or decrease of seismic input.
242
DINA F. D’AYALA
A first possible way of deriving such fragility curves relates to the availability of actual damage survey. The correlation between damage and earthquake severity can be addressed by defining an appropriate probability model (Bernardini and Modena, 1986), or using large data sets from many different earthquakes to produce damage probability matrix (Braga et al., 1982; Cobourn et al., 1992) and correlated damage scenarios (Faccioli et al., 1999; Dolce, 2000). When large amounts of data are not available, an approach based on the identification of deterministic fragility curves (earthquake severity/damage levels) can be pursued. This method can be considered sufficiently reliable only when each building sample is described by appropriate functions representing the structural features of the building types (Guagenti and Petrini, 1989), as it is the case with the samples analysed by FaMIVE. One major issue is the choice of the most appropriate parameter of description of the seismic event to be related to the damage parameter. An obvious choice is the macroseismic intensity as this is an indirect measure of observed structural damage itself. However, it is rather difficult to relate the macroseismic intensity to a physical parameter descriptive of the performance of the building, in terms of force capacity or displacement, as derived from structural analysis. To this end most often the peak ground acceleration (PGA) is used, as this is homogeneous to the capacity of the structure and it is a descriptor of most earthquakes for which instrumental records exist. However it is also widely recognised (Wald et al., 1999) that the PGA is not a good descriptor of the destructive potential of the earthquake and that it correlates only limitedly to observed damage, especially for events of higher magnitude. In the following therefore, the earthquake severity is measured in terms of Mean Response Spectral Acceleration (MRSA), while in the next section acceleration/displacement spectra will be introduced. According to the assumptions made, a building with a given collapse load factor ESC, as quantified by FaMIVE, undergoes damage of level D3 when subjected to an earthquake of severity MRSA/g = ESC. The fragility curves obtained by optimising the correlation between observed and predicted damage have the following analytical format: for i ≤ D2
MRSAi = MRSA(i+1)
for i = D3
MRSA3 = ESC
for i > D3
MRSAi = MRSA(i−1)
i ·α i +1
(2) (3)
i ·β i −1
(4)
where the different format of Eqs. (2) and (4) takes into account that the damage scale is not linear.
VULNERABILITY ASSESSMENT FOR TRADITIONAL BUILDINGS
243
The present formulation, derived from an initial regression proposed by Speranza (2003) is applied to a sample of building in Umbria, Italy for which damage data had been collected in 1999 (D’Ayala and Speranza, 2001). An optimization procedure, with target the best correlation between surveyed and forecast damage distributions shown in Figure 3, is used to obtain the values of α and β. A correlation coefficient of 0.98 is obtained with α = 0.985 and β = 1.33. These remain constant for the four vulnerability functions, each representing a vulnerability class, shown in Figure 4. The analogy between the analytical form of the curves in Figure 3 and the format of common relationships correlating PGA and macro intensity is apparent. However, as it can be seen in Figure 3, the observed damage has a larger scatter of ESC values than the forecast. This is to be attributed to inconsistency between the calculated value of the load factor and the damage observed on site and relates to the reliability of the surveyed data (for instance constraint conditions). Furthermore for the forecast damage a lognormal regression with correlation coefficient of R 2 = 0.89 has been obtained (continuous line in Figure 3) again comparing favourably with similar regressions developed to correlate PGA and intensity (Guagenti and Petrini, 1989; Wald et al., 1999). In absence of damage data a different approach is pursued to derive fragility curves. This second approach relies directly on the division in classes of vulnerability of a given analysed sample and on the distribution of collapse load factors. For each class a central value of the collapse load factor and a standard deviation are calculated. As it has been assumed that the collapse load factor correlates to damage value D3 the fragility
Figure 3. Correlation between collapse load factor and damage levels as observed and predicted with fragility curves.
244
DINA F. D’AYALA
Figure 4. Vulnerability functions for the four classes of vulnerability obtained by using equations (2) to (4).
Figure 5. Fragility curves obtained for each class of vulnerability using mean value and standard deviation of collapse load factor ESC.
curve for each vulnerability class can be formed for this value of damage. In Figure 5 these curves are shown for value of mean spectral acceleration and cumulative percentage of damage. The different shape of the three curves highlights the greater fragility of high vulnerable building as a group to respect to the other two groups. In this particular case as there were few
VULNERABILITY ASSESSMENT FOR TRADITIONAL BUILDINGS
245
Figure 6. Correlation of observed and calculated damage as predicted with vulnerability functions and fragility curves.
buildings in the class of extreme vulnerability this has been cumulated with the class high. In Figure 6 the damage distribution obtained with these curves is compared with the observed damage distribution and the one derived using the vulnerability functions, for the same sample and MRSA previously presented in Figure 3. The results in terms of damage scenarios and their correlation to EMS ’98 curves (Grunthal, 1998) are presented in Section 5.1 and Figure 14. 3. Displacement based vulnerability analysis From the discussion in the previous section it appears evident how the seismic capacity of masonry walls is highly reliant on the possibility of considering post-elastic behaviour, and specifically extensive cracking under stable loading conditions. The frictional model introduced to describe the structural behaviour, indeed assumes that any mechanism is stable until the “plastic hinges” needed to define the kinematism are fully developed, i.e for in plane mechanisms, for instance, failure will not occur until the width of the crack is greater than the staggering of the units. Hence for levels of damage greater than the onset of cracks, it appears appropriate to derive a damage function relating directly to the displacement response of the structure. In order to do so it is necessary to define limit displacement condition that corresponds to damage states and to compare these values with the displacement demands obtained through non-linear displacement spectra.
246
DINA F. D’AYALA
Figure 7. Normalised capacity curve for pushover analysis of masonry facades with assumed damage states.
A normalised capacity curve with damage states is shown in Figure 7. Static equivalent push over analysis of masonry buildings is not a novelty (as it was introduced as an assessment method for in plane actions, in the Italian seismic code, since 1981, following the Friuli earthquake of 1976). However the use in connection with the vulnerability assessment of classes of buildings and the extension to out-of-plane actions and failure modes is novel, as it is the correlation with displacement demand spectra. In the following, first a discussion on the definition of an appropriate displacement spectra for the sample analysed is presented highlighting the relevant level of ductility chosen and the most appropriate relationship for the reduction factor R, representing the reduction in acceleration demand due to hysteretic energy dissipation. Then, the criteria for the definition of the limit displacement are introduced and appropriate capacity curves derived. A comparison between capacity and demand in spectral displacement terms concludes this section. 3.1. Definition of displacement spectra The definition of a non-linear displacement spectrum requires knowledge of the hazard of the region and of the behaviour of the exposed building stock for which the vulnerability is to be assessed. For these two reasons the following developments are carried out with reference to displacement spectra derived for Istanbul, and specifically for the district of Fatih, where a survey of some 70 historic masonry buildings was carried
VULNERABILITY ASSESSMENT FOR TRADITIONAL BUILDINGS
247
Figure 8. Linear and non-linear acceleration – displacement response spectra for two values of ductility and two formulations of the displacement amplification factor. Also included are the points representatives of the equivalent elastic response (Sae ) for each fac¸ade of the sample presented in Section 4.
out using the FaMIVE method. The choice is dictated by the availability of spectral displacement based vulnerability curves for mid-rise masonry buildings in Istanbul published by Erdik and Ayd´ynoglu (2003). The reference elastic displacement spectrum used is derived by using as hazard the Credible Worst Case scenario expected for Istanbul, and the correspondent deterministic PGA and spectral displacement as given in Erdik (2003). In the choice of the value of PGA reference has been made to the Golden Horn site soil classification presented by Togrol (2001) and correlated to the NHERP classes. The resultant value of PGA is 0.3 g. The elastic acceleration – displacement response spectrum (ADRS), is shown in Figure 8. The lines representative of the transition period Tg = 0.6 s and of the period T = 1 s are also shown for reference, and to provide an idea of the range of effective stiffness associated to the building sample. To derive the correspondent non-linear displacement spectra the bilinear R-factor model proposed by Vidic et al. (1994) in the simplified version presented by Fajfar (2000) and adopted by both FEMA 356 (BSSC, 2000) and the draft Eurocode 8 Standard (ECS, 2002) has been used in the following: � R=
c1 (µ − 1) TTg + 1 c1 (µ − 1) + 1
T Tg T Tg
≤1 >1
(5)
248
DINA F. D’AYALA
The formulation shown here is the one proposed by Cuesta et al. (2003). They have shown that the reduction factor R depends not only on ductility µ, period T and the transition period Tg but also on the type of non-linear material constitutive model chosen for the simulation with SDOF, which is accounted for by the constant c1 . In the case of elastic perfectly plastic material, as the masonry has been idealised in the limit analysis conducted in this study (see Figure 7), the value of c1 = 1.3 should be applied. However as it is clear that in reality material degradation will occur and the ductility of the masonry walls is limited without loss of integrity, a value c1 = 1 is assumed. Although the constitutive material is not specified in Fajfar (2000) the underlying assumptions and validating applications are limited to concrete frame structures and hence the extension of assumptions regarding energy dissipation to the application to unreinforced masonry buildings is not immediate. With the previous consideration, the displacement amplification factor Sdar assumes the following expression: � �� 1 + (R − 1)Tg /T /R T < Tg Sdar = . (6) 1 T > Tg This expression coincides with the formulation of the C1 coefficient used in FEMA 356 (BSSC, 2000). An alternative expression for Sdar is proposed by Ayd´ynoglu and Kac¸maz (2002), based on a constant strength reduction analysis of a large statistical sample of earthquake records, rather than the ductility target approach at the basis of Eqs. (5) and (6). This constant strength reduction approach might be better suited to materials such as unreinforced masonry, where the post-elastic behaviour is limited and the observed ductility is due to crack opening and sliding rather than material yielding. The factor Sdar proposed by Ayd´ynoglu and Kac¸maz has the form: � �2 √ Ry − 1 1 −20 RyT2 + e (7) Sdar = 1 + 300 10T 2 The non-linear ADRS obtained with Eqs. (6) and (7) respectively, are plotted in Figure 8. It should be noted that for values of the natural period smaller than 0.6 and for small values of µ and hence Ry , the demand in terms of non-linear displacement is slightly smaller with the Ayd´ynoglu and Kac¸maz formula than with the FEMA 356 formula. For greater values of the natural period there is virtually no difference. 3.2. Definition of capacity curves For the purpose of the discussion presented in this paper, the capacity curves are defined for each fac¸ade on the basis of three parameters. The strength capacity, ay , is identified on the basis of the limit state analysis and hence coincides for each fac¸ade with the collapse load factor ESC
VULNERABILITY ASSESSMENT FOR TRADITIONAL BUILDINGS
249
obtained with FaMIVE, as illustrated in Section 2 of this paper. This quantity has the dimensions of a spectral acceleration (a/g). The elastic limit displacement, at the top of each fac¸ade, is estimated with the following simple relationship: ay �y = 2 T 2 4π
with T =
Keff meff
(8)
where T , natural period of the fac¸ade, is calculated on the basis of the mass meff of the fac¸ade activated by the failure mechanism, and Keff the elastic stiffness relevant to the specific mechanism (i.e. in plane or out of plane stiffness of the fac¸ade with specific constraint conditions and cracked cross section). In this way, each fac¸ade is reduced to an equivalent SDOF system. Finally the ultimate displacement �u needs to be defined. In literature this is usually estimated either on the basis of an assumed level of ductility or on the basis of limit lateral drift defined by expert opinion, in the absence of actual experimental or analytical values. In the present context, however, it seems more coherent to follow the mechanism approach at the basis of the FaMIVE procedure, and calculate as ultimate displacement the displacement that determines the geometric instability of the facade and hence its collapse. Hence for each wall, in relation to its slenderness and its constraint conditions a different value of maximum out-of-plane or in plane lateral displacement can be calculated beyond which equilibrium is not recoverable. Following this method the capacity curve for each fac¸ade can be obtained and the available ductility µc = �u /�y for each one can be calculated. The value of ductility obtained for each fac¸ade is µc ≥ 2.95. The ultimate lateral displacement can also be used to define the ultimate drift ratio for each fac¸ade. In analysing the variation by vulnerability class it is noticeable that the ultimate drift capacity reduces little with increased vulnerability, the average values (and standard deviations) being 1.9% (0.76), 1.4% (0.38) and 1.3% (0.39), respectively, for low, medium and high vulnerability. In order to choose the most appropriate non-linear spectrum for each class to compare capacity and demand displacements, first the value of Ry for each building is calculated as the ratio of the yielding capacity to the elastic equivalent, as plotted in Figure 9. It can be seen that Ry increases with the vulnerability of the fac¸ade and hence accordingly the high vulnerability class will face a higher ductility demand µd . Such demand is also shown in Figure 9, and while the trend is similar to Ry it can be noted that there is a greater scatter, correlating with the different deformability of the various fac¸ades in relation to the failure mechanisms. The average value of
250
DINA F. D’AYALA
Figure 9. Distribution of strength reduction factor Ry and corresponding ductility demand in the sample.
Figure 10. Superposition of displacement spectra and capacity curves for class of vulnerability.
ductility demand is 5.14, with the value range between 2 and 3 the most common. In order to visualise the general behaviour of the three classes of vulnerability with respect to the non-linear demand spectra in Figure 10 the capacity
VULNERABILITY ASSESSMENT FOR TRADITIONAL BUILDINGS
251
curves, defining the range for each class, are compared with the elastic spectrum and with spectra based on the Ayd´ynoglu and Kac¸maz (2002) displacement amplification factor for three values of ductility demand. It is worth noting that while the range of strength capacity and stiffness corresponds to the classification, the available ductility for each class is more or less constant. The first evident results that can be drawn from Figure 10 is that fac¸ades belonging to the low vulnerability class do not require strengthening as their performance for the event of choice will require limited ductility, lower than the value shown by the capacity curve. For fac¸ades in the range of medium vulnerability will be essential to identify whether they are able to develop the required ductility, or hence introduce adequate measures, while for the fac¸ades in the high vulnerability class it is evident that their strength capacity is very modest even when compared to spectra with medium level of ductility. Substantial strengthening will need to be implemented, possibly aimed at altering the mode of collapse. Further discussion will be presented in Section 5, after a description of the case study and the results obtained with the FaMIVE analysis. 4. Application to the Fener–Balat sample in Istanbul, Turkey Both districts of Fener and Balat in Istanbul have been inhabited since Byzantine times, and saw their highest expansion and prosperity during the 16th and 17th centuries. The current urban structure dates to around the second half of 19th century, with most of the building stock belonging to the period of reconstruction following the earthquake and fire of 1894 (Ambraseys & Finkel, 1991). Although the study is limited to the two districts, the typologies described are common to other historic areas of Istanbul, such as Galata and Fatih, so that the conclusions can be extended beyond the boundaries of the area of study. The fire prevention policy introduced after the great fires of 1856–1870 influenced greatly the building typologies and the urban lay out of the area. A regular urban grid was laid out resulting in rectangular and squared blocks, subdivided in similar plots with relatively narrow fronts and depth equal to half the depth of the block leaving little or none internal space. Brickwork construction almost totally replaced timber framing and cladding, and each house was built with independent party walls, usually supporting the floor structures. The sample chosen for the analysis is made up of 45 buildings, and a total of 80 fac¸ades have been surveyed. The study has been carried out within the framework of an EU funding rehabilitation project.1 The sample has been chosen so as to be representative of the original typologies of the 1
EU-Fatih Municipality Programme DELTUR/MEDTQ/53-02: “Rehabilitation of Fener and Balat Districts”.
252
DINA F. D’AYALA
Figure 11. (a) example of cumba window; (b) example of wall to wall anchor and extruded cumba brickwork; (c) example of floor to wall arrays of anchors at each floor level.
VULNERABILITY ASSESSMENT FOR TRADITIONAL BUILDINGS
253
two districts, including buildings with alterations, such as the addition of a storey or replacement of floor structures, but excluding buildings either completely rebuilt in concrete or in which a concrete frame has been introduced alongside the original masonry structure (14% of the districts total, according to 1998 census). According to a study conducted by the Fatih municipality (Stoquart and Caglar, 1998), 70% of the buildings contained in the sample were built before 1930 and 75% are listed as historic. The most specific feature of the building stock in Fener–Balat is a type of oriel window called cumba. This is usually the central window of the fac¸ade at first floor, built like a balcony supported at floor level by a continuous C shaped iron member, connected to the main floor structure and walled-up with extruded hollow bricks to reduce the overall weight (See Figure 11a and b). In some cases, this walled up balcony is extended to the entire fac¸ade and over several storeys, becoming a jetty. A thorough description of the construction details of the cumba is contained in D’Ayala and Yeomans (2004); hence here the discussion is limited to the statistics of their distribution within the sample and their effect on the vulnerability of the fac¸ade. Figure 12a shows that 70% of fac¸ades in the sample have oriels or jetty, 45% only at one storey. In order to distinguish between jetties and oriels, the length of the jetting portion is taken as ratio of the fac¸ade length in Figure 12b. This shows that more than half of the sample have a ratio ≤ 0.5, clearly oriels, while about 10% have jetties, and a small number of buildings on corner present jetties on both sides of the corner resulting in ratios greater than 1 (4%). Although the oriels and jetty are clearly perceived as a feature increasing the vulnerability of the fac¸ade, due to their eccentricity with respect to the main wall, in reality their associated overturning moment is relatively small, compared with other restoring actions, due to the large opening ratios and the fact that in most cases they are built with extruded hollow brickwork (Figure 11b). It is not immediate to quantify any increment in seismic vulnerability directly related to the presence of the cumba, especially because a number of structural details are present to limit their adverse effect, such as orientation of horizontal structure, presence of ties, presence of brackets to support it. However, it can be noted in Figure 12c that the buildings with just one-storey oriels tend to have higher vulnerability than others. This might be explained by the observation that in this category of buildings, anchors are less common than in buildings with oriel or jetty over more storeys or buildings without it. Given the particular construction typology used and the layout of the floors structures, spanning between party walls, the fac¸ades can only relay on the frictional restraint provided by the party walls themselves if the tooting of the brickwork is adequate. While this can be sufficient in
254
DINA F. D’AYALA
Figure 12. Statistical distributions of (a) number of storeys and (b) length of oriel and jetty; (c) corresponding vulnerability classes.
preventing overturning in modest tremors, it becomes ineffective for higher shaking, especially at the upper storey, were vertical load is modest. Hence, in this sample the most common chosen solution to the problem of outof-plane restraint of the fac¸ade is the introduction of iron ties. The high occurrence in the sample (almost 70% of fac¸ades surveyed, see Figure 13a) and the orderly and uniform distribution on fac¸ades and party walls shows clearly that this was a design choice implemented at the time of construction. Two types of anchors can be identified. One is the tie from fac¸ade wall to back wall, running underneath the floor structure and anchored to the wall by a vertical key slot through a hole at each end of the tie (Figure 11b). The second type is made of flat metal plates nailed into the joists and
VULNERABILITY ASSESSMENT FOR TRADITIONAL BUILDINGS
255
Figure 13. (a) Distribution of the number of storeys with ties in any given fac¸ade (b) histogram of corresponding collapse load factors.
then bent at 90◦ over the external surface of the wall (Figure 11c). These are readily visible only on corner buildings, but it is probable that their use extends to other buildings in the sample. The survey shows that typically fac¸ades have two arrays of ties, one on each corner, on two levels, typically the roof and the first or second storey, depending on the location of the oriel window. The presence of ties at roof level means that the overturning mechanism is prevented and a vertical arch effect, in which the top of the wall is restrained from moving out of plane, will form in its place. Figure 13b shows that only approximately 17% of the fac¸ades with ties have a collapse load factor smaller than 0.4, the average spectral acceleration for ductility level 2. Moreover, this mechanism determines the vulnerability of the building, only in one case of the entire sample. This is due to the fact that other mechanisms might develop in presence of ties, such as partial overturning, in plane failure or spandrels failure, and will occur for lower collapse load factors or involving greater portions of the structure. Given the type of horizontal structures described, it is feasible and safe to assume that diaphragm action will be very modest, and hence its effect on redistribution of forces and deformation is neglected in the analysis. Moreover the effect of connections between adjacent walls is taken into account in the definition of the mechanisms, in the limit state analysis, and
256
DINA F. D’AYALA
in the calculation of the stiffness and hence of the natural period of each fac¸ade for the definition of the ductility demand. 5. Discussion of results 5.1. Force based damage scenarios According to the division in four classes of vulnerability as introduced in Section 2.1, in the Fener–Balat sample 1.3% of the fac¸ades show extreme vulnerability, 28.0% high vulnerability, 61% medium and 9.6% low vulnerability, showing a rather homogeneous behaviour, to be expected given the uniform development of the two districts. An analysis of the data by failure mechanism shows that because of the high proportion of anchors, and hence the prevention of out of plane mechanisms, the most common single mechanism is in plane failure (mechanism type H in Figure 14), followed by the overturning of the fac¸ade involving party walls (mechanisms B or C). These results are confirmed by on site survey of crack patterns following the 1999 earthquake. However out of plane overturning of the fac¸ade alone (mechanisms A, D or E), whether partial or total, represents one third of the whole sample and 61% of the class of High vulnerability. The fac¸ades with highest vulnerability are affected by total overturning of the fac¸ade (mechanism A): these are mainly 3 storey high, with timber floors with no ties, medium to poor level of maintenance and at least one storey with cumba. Within the same typology are the set of buildings failing by partial overturning (mechanisms D or E), which differs from the previous group only by the presence of irregular connections at the edges and/or the sporadic presence of ties. To summarise the force-based vulnerability analysis shows that: • Fac¸ades with poor lateral connection and no visible presence of ties are highly vulnerable, as they are prone to overturning of their whole height, also involving the cumba in the collapse. Their average collapse load factor is 0.125 a/g. • Fac¸ades with basically good construction standards, such as good maintenance of the masonry accompanied by connection to party walls and presence of ties, all show medium-low level of vulnerability and an average collapse load factor of 0.3 a/g. • Fac¸ades with localised defects, such as narrow upper spandrels, or connections only on one side or only at the lower levels, fail with mechanisms types G and D, respectively, with low collapse load factors of about 0.10 a/g, and show a value of vulnerability in the upper range of the medium class. In Figure 15, the curves of cumulative distribution for each damage state are plotted against different level of expected mean response spectrum
VULNERABILITY ASSESSMENT FOR TRADITIONAL BUILDINGS
257
acceleration. The curves have been obtained using the process of derivation of fragility curves described in Section 2.2 and show the percentage of the building sample, which would reach or overcome a given state of damage. Of particular interest are the values of the curves in correspondence of 0.25–0.33 a/g corresponding to the level of design acceleration prescribed by the Turkish code, but also to the expected spectral acceleration in Fatih (Ansal, 2003). For 0.25 a/g Figure 15 shows that slightly less than 90% of the buildings will be damaged and 80% will have at least damage level D2; about 55% of the buildings will suffer heavy damage, level D3, 36% will experience partial collapse, D4, and 18% will collapse, D5. For 0.33 a/g 75% of the building will have damage level D3, 50% D4 and 25% level D5. The cumulative damage distribution is compared with the EMS’98 curves for classes of vulnerability B and C, having used Wald et al. (1999) Intensity–PGA correlation equation. It can be noted that for level of damage up to D3 the sample distribution compares well with the EMS’98 class C, however for low level of shaking lower proportion of cumulative damage for level D1 and D2 are expected for the sample. This has to do with the homogeneity of the sample and with the relatively moderate increment in acceleration assumed between damage state D2 and D3 (see Figure 7). It should also be noted that in EMS’98 the curves for class B damage D4 and class C damage D3 are almost coincident, as they have been obtained by using the concept of binomial and normal distribution. The lower part of these two curves overlaps the sample damage D3 and in the upper part
Figure 14. Distribution of mechanisms by vulnerability classes.
258
DINA F. D’AYALA
Figure 15. Cumulative damage curves. Comparison between FaMIVE results and EMS’98 curves for building class B and C.
damage D4. Finally, for level damage D5 the curve representative of the sample compares very well with the class B curve of EMS’98. This observation highlights two limitations of the normal distribution approach. The first one is that given a building sample it is incorrect to assume that there will be a normal continuous distribution of capacity around a median level. The second limitation has to do with the fact that the normal distribution is usually built by assuming a reference curve for damage D3, say and then standard deviation is used to derive upper and lower damage level, using a constant interval shift. This approach does not take into account the physical phenomena associated with the progression of damage level onto a building, and specifically that while the shift between D2 and D3 does indeed corresponds to an increase in terms of acceleration demand, the shift between D3 and D4 is associated to post-elastic displacement capacity, and hence in cumulative damage distribution while an horizontal shift between D2 and D3 represents a change in the physical state of a given set of buildings, the same shift between D3 and D4, is to be associated to different sets of buildings. 5.2. Displacement based damage scenarios Given the limitation highlighted in Section 5.1 in deriving force-based damage scenario, it seems appropriate to derive an equivalent scenario in terms of expected displacement, as this should take better into account the postelastic performance of the building sample. A first analysis of the data
VULNERABILITY ASSESSMENT FOR TRADITIONAL BUILDINGS
259
Figure 16. Comparison of points representative of failure for each fac¸ade and the linear and non-linear displacement spectrum for the deterministic earthquake.
visually compares the point representative of the failure condition for each fac¸ade with the linear and non-linear ADRS spectra. This is carried out in Figure 16, where the point representative of each fac¸ade is coded by vulnerability class. It should be noted that while there is a clear difference in behaviour in terms of ultimate displacement and capacity for the low vulnerability class, the transition between medium and high vulnerability classes is not as clear and many points representative of the first coincide with points representative of the second, for the range of strength capacity between 0.1 and 0.2 a/g. These correspond to fac¸ades that have same collapse load factor and ultimate displacement but different failure extent index If and hence belong to different classes. As already pointed out in Section 3.2 the ductility demand within the sample is quite variable and hence comparison with a specific ductility spectrum is of limited validity, to define the margin of safety of each fac¸ade. A more meaningful assessment can be carried out by verifying the capacity/demand ratio in terms of the ultimate drift or in terms of the ultimate ductility. These results are shown in Figure 17, and, for ease of interpretation, have been coded by vulnerability class. A first general remark relates to the lack of direct proportionality between the two ratios, which should be expected as the demand in terms of ductility and displacement are calculated using entirely different functions. The totality of fac¸ades belonging to the low vulnerability class shows
260
DINA F. D’AYALA
Figure 17. Ductility and drift capacity/demand ratios as a function of the strength capacity of the fac¸ades.
ratios greater than 2 both in ductility and in drift. The results confirm the view that these fac¸ades do not need structural intervention. High or medium vulnerability classes show ultimate displacement capacities which in some case fall just short or meet the demand. Furthermore, a significant proportion of the sample (30%) shows both ductility and displacement ratios smaller than 2. These fac¸ades will be subjected to substantial damage in the scenario earthquake chosen. It should be noted that, although the criteria underlining the two methods for definition of vulnerability are somewhat different, the cumulative results of fac¸ades likely to fail are very similar if this last group is compared to the class high/extreme vulnerability as identified in the force based approach. It should also be considered that, as for the group of buildings with modest strength capacity (ay < 0.2), there is often substantial difference between the performance evaluation in terms of displacement or ductility, a decision needs to be made on which of the two parameters should be considered critical (Figure 18). In order to validate the obtained results further, cumulative damage distributions have been computed and compared with results published by Erdik and Ayd´ynoglu (2003) for Istanbul Metropolitan City. Specifically the two curves for moderate and extensive damage for mid-rise masonry buildings built before the 1980 (for which the census identifies in excess of 6000 buildings) have been plotted along the damage distribution obtained for the sample. With an average height of 10.5 m the sample studied in Fener and Balat is well representative of the above group classified as reference
VULNERABILITY ASSESSMENT FOR TRADITIONAL BUILDINGS
261
Figure 18. Displacement based cumulative damage probability curves for the sample.
height 10 m. The two curves shall be compared with damage level D4 and D5, respectively, of the sample under study. In general, it can be noted that the results obtained with this study highlights a level of greater cumulative damage for larger displacements than the one expected with the more general study and lower cumulative damage for smaller displacements. This can be ascribed to the lognormal distribution used in the Erdik & Ayd´ynoglu study as opposed to the more accurate profiling of the Fener sample and to the substantial homogeneity of the last. Similar limitation in the use of lognormal and normal distribution have been highlighted by Booth et al. (2004) and Jeong and Elnashai (2004) both in force based and displacement based vulnerability assessment of samples for which damage data is available. 6. Conclusions Masonry buildings have common traditional structural features in seismic prone countries worldwide. Traditional resilient features have already proven to be effective, as in some cases these buildings have survived major destructive earthquakes in past centuries. Vulnerability of the single building depends on position in urban block, local topography, masonry fabric, layout of horizontal structures, level of maintenance and alteration, and presence of traditional or latter seismic resilient features. Historic urban masonry buildings are generally classified as class B of the EMS98 with subset in class A when structural deficiencies are present and subset in
262
DINA F. D’AYALA
class C when strengthening is effective. It has been shown with reference to a case study in the historic district of Fener Balat that this classification is accurate and if any underestimate their capacity slightly, when specific strengthening is present. The discussion presented in the paper shows that is possible to use an engineering consistent limit state analysis approach to the definition of seismic vulnerability of historic buildings and that a procedure of general applicability can be derived and successfully used to define fragility curves in terms of expected mean spectra accelerations. It is also feasible to derive a displacement based vulnerability analysis based on capacity and demand ultimate displacement. An accurate estimate of the ductility is essential to the definition of vulnerability in this case. A collapse mechanism analysis of a sample in Fener Balat, Istanbul, Turkey, identifies for this class of buildings a seismic capacity ranging from 0.12 to 0.28 a/g when there is no connection with party walls, increasing to 0.18–0.4 if the connection is present or there are regular arrays of ties. This correlates to seismic vulnerability to intensity VIII for the first class of buildings and to intensity IX for the second class. A third class, characterised by poor level of maintenance and the presence of oriels can result vulnerable to intensity VII. Comparable results are attained with the displacement-based approach outlined in the paper. Comparison of these results with results obtained applying a modified version of Hazus 1999 to the mid-rise masonry building stock of Istanbul highlights the limitation of using normal or lognormal distribution for relatively homogeneous types of buildings. The application to the sample in Fener–Balat also shows that the presence of ties or equivalent devices is particularly efficient in reducing risk especially in the more slender fac¸ades. Vertical additions, alteration of window lay out and improper introduction of reinforced concrete floor structures can seriously impair seismic capacity. The effectiveness of modern strengthening techniques depends upon accurate detailing both in design and construction and on accurate assessment of the structural integrity of the building. These details need to be accounted for in the vulnerability analysis if robust cumulative damage distributions are to be derived.
References Ambraseys, N.N. and Finkel, C.F. (1991) Long-term seismicity of Istanbul and the Marmara sea Region. Terra Nova, 3. Ansal, A. (ed.) (2003). Earthquake Master Plan for Istanbul, Metropolitan Municipality of Istanbul. ¨ (2002) Strength-based displacement amplification specAydino˘glu, M.N. and Kac¸maz, U. tra for inelastic seismic performance evaluation, Bo˘gazic¸i University, Kandilli Observatory And Earthquake Research Institute (Koeri), Department of Earthquake Engineering Report No. 2002/2.
VULNERABILITY ASSESSMENT FOR TRADITIONAL BUILDINGS
263
Baggio, C. and Carocci, C. (2000) Valutazione della qualit`a meccanica delle murature. In: La Vulnerabilit`a degli edifici: valutazione a scala nazionale della vulnerabilit`a sismica degli edifici ordinari. Pubblicazione GNDT-CNR, a cura di A. Bernardini. Benedetti, D., Carydis, P. and Pezzoli, P. (1998) Shaking table tests on 24 simple masonry buildings. Earthquake Engineering & Structural Dynamics 27(1), 67–90. Bernardini, A. and Modena, C. (1986) The vulnerability of masonry buildings typologies in a seismic area. In: Proceedings of the 8th European Conference on Earthquake Engineering, Lisbon, pp. 2.3/57–62. Booth, E., Bird, J. and Spence, R. (2004) Building Vulnerability Assessment Using Pushover Methods – A Turkish Case Study. In: International Workshop on Performance Based Seismic Design, Bled, Slovenia. Braga, F., Dolce, M. and Liberatore, O. (1982) A statistical study on damaged buildings review of the MSK-76 scale. In: Proceedings of the Conference of the European Association of Earthquake Engineering, Athens. Building Seismic Safety Council. BSSC (2000) Prestandard and Commentary for the Seismic Rehabilitation of Buildings, FEMA-356, Federal Emergency Management Agency, Washington, D.C. Calvi, G.M. (1999) A displacement-based approach for vulnerability evaluation of classes of buildings. Journal of Earthquake Engineering 3(3), 411–438. Ceradini, V. (1992) Modellazione, sperimentazione per lo studio della struttura muraria storica. Doctoral thesis, Universit`a di Roma “La Sapienza”, Facolt`a di Architettura. Cuesta, I., Aschheim, M. and Fajfar, P. (2003) Simplified R-factor relationships for strong ground motions. Earthquake Spectra 19(1), 25–45 D’Ayala, D. (1999) Correlation of seismic vulnerability and damage between classes of buildings: churches and houses. In: Measures of Seismic Damage to Masonry Buildings, pp. 41–58. Balkema. D’Ayala, D. (2000) Establishing correlation between vulnerability and damage survey for churches. 12th World Conference on Earthquake Engineering, paper no. 2237. New Zealand. D’Ayala, D. and Speranza, E. (2001) A procedure for evaluating the seismic vulnerability of historic buildings at Urban scale based on mechanical parameters. In: Second International Congress on Studies in Ancient Structures, Istanbul 2001, pp. 477–488. D’Ayala, D. and Speranza, E. (2002) An integrated procedure for the assessment of seismic vulnerability of historic buildings. In: 12th European Conference on Earthquake Engineering, paper no. 561. D’Ayala, D. and Speranza, E. (2003) Definition of collapse mechanisms and seismic vulnerability of masonry structures, Earthquake Spectra 19(3), 479–509. D’Ayala, D. and Yeomans, D. (2004) Assessing the seismic vulnerability of late Ottoman Buildings in Istanbul, In: International Seminar on Structural Analysis of Historical Construction, Padova 2004, pp. 1111–1119. D’Ayala, D., Spence, R., Oliveira, C. and Pomonis, A. (1997) Earthquake loss estimation for Europe’s historic town centers. Earthquake Spectra 13(4), 773–792. Dolce, M., Masi, A., Marino, M. and Vona, M. (2003) Earthquake Damage Scenario of the Building Stock of Potenza (Southern Italy) Including Site Effects. Bulletin of Earthquake Engineering 1, 115–140. Erdik, M. (Ed.) 2003. Earthquake Risk Assessment for The Istanbul Metropolitan Area, Final Report. Bogazici University. Erdik, M., Ayd´ynoglu, N. (2003) Earthquake vulnerability of buildings in Turkey. In: Third International Symposium on Integrated Disaster Risk Management (IDRM-2003) Kyoto, Japan, 3–5 July, 2003.
264
DINA F. D’AYALA
European Committee for Standardisation (ECS) (2002) Design of Structures for Earthquake Resistance, Part 1: General Rules, Seismic Actions and Rules for Buildings, Draft no. 5, Eurocode 8. Faccioli, E., Pessina, V., Calvi, G.M. and Borzi, B. (1999) A study on damage scenarios for residential buildings in Catania city, Journal of Seismology 3(3). Fajfar, P. (2000) A nonlinear analysis method for performance-based seismic design. Earthquake Spectra 16(3), 573–592. Giovinazzi, S. and Lagomarsino, S. (2003) Seismic Risk Analysis: a method for the vulnerability assessment of built-up areas. In: European Safety and Reliability Conference ESREL 2003, Maastricht, Vol. 1, pp. 671–679. Giuffr`e, A. (1991) Letture sulla meccanica delle murature storiche. Kappa Ed., Rome. Giuffr`e, A. (1993) Sicurezza e conservazione dei centri storici. Il caso di Ortigia, Bari, Italy. Goretti, A. and Di Pasquale, G. (2002) An Overview of post-earthquake damage assessment in Italy. In: EERI Invitational Workshop An Action Plan to Develop Earthquake Damage and Loss Protocols, Pasadena California. ¨ Grunthal, G. (Ed.) (1998) European macroseismic Scale 1998, Conseil de L’Europe, Luxembourg. Guagenti, E. and Petrinim, V. (1989) Il caso delle vecchie costruzioni: verso una nuova legge danni-intensita’. In: Atti IV Convegno Nazionale di Ingeneria Sismica, Milano, Vol. I, 145–153. Gulkan, P. and Sozen, M.A. (1999) Procedure for Determining Seismic Vulnerability of Building Structures, ACI Structural Journal 96(3), 336–342. HAZUS (1999) Earthquake Loss Estimation Methodology. Technical Manual. RMS, NIBS, FEMA. Jeong, S. and Elnashai, A. (2004) Parameterized Vulnerability Functions For As-Built And Retrofitted Structures. In: International Workshop on Performance Based Seismic Design, Bled, Slovenia. Kircher, C., Nassar, A., Kustu, O. and Holmes, W. (1997) Development of building damage functions for earthquake loss estimation. Earthquake Spectra 13, 663–682. Lang, K. and Bachmann, H. (2004) On the seismic vulnerability of existing buildings: a case study of the city of Basel. Earthquake Spectra 20(1), 43–66. Rossetto, T. and Elnashai, A. (2003) Derivation of vulnerability functions for European-type RC structures based on observational data. Engineering Structures 25(10), 1241–1263. Spence, R., Cobourn, A., Sakai, S. and Pominis, A. (1991) A parameterless scale of seismic intensity for use in seismic risk analysis and vulnerability assessment. In: Saced (Ed.) Earthquake, Blast and Impact: Measurement and Effects of Vibration. Elsevier Applied Science, Amsterdam. Spence, R. and Coburn, A. (1992) Strengthening buildings of stone masonry to resist earthquakes. Meccanica 27, 213–221. Kluwer Academic Publisher. Spence, R. Bommer, J., del Re, D., Bird, J., Aydinoglu, N. and Tabuchi, S. (2003) Comparing loss estimation with observed damage: A study of the 1999 kocaeli earthquake in Turkey. Bulletin of Earthquake Engineering 1(1), 83–113. Speranza, E. (2003) An integrated method for the assessment of the seismic vulnerability of historic buildings. PhD thesis, University of Bath, UK. Stoquart, R. and Caglar, N. (Eds.) (1998) Rehabilitation des quartiers de Balat and de Fener, Diagnostic et proposition d’amenagement. Union Europeenne, UNESCO. Tomazevic, M. and Anicic, D. (1989) Research, technology and practice in evaluating, strengthening, and retrofitting masonry buildings: some Yugoslavian experiences, In: Proceedings of and International Seminar on Evaluating, Strengthening, and retrofitting Masonry Buildings. October, Arlington, Texas.
VULNERABILITY ASSESSMENT FOR TRADITIONAL BUILDINGS
265
Togrol, E. (2001) Golden Horn, a historical survey of geotechnical investigations, In: Proceeding of 15th ISSMGE-Istanbul 2001, pp. 2445–2470. Vidic, T., Fajfar, P. and Fischinger M. (1994) Consistent inelastic design spectra: strength and displacement. Earthquake Engineering and Structural Dynamics 23, 507–521. Wald, D.J., Quitoriano, V., Heaton, T.H. and Kanamori, H. (1999) Relationships between peak ground acceleration, peak ground velocity and modified mercalli intensity in California. Earthquake Spectra 15(3), 557–564.