As early as 1914, Paul ...... Among the several substances investigated by Paul Walden ...... [251] Cammarata, L.; Kazarian, S. G.; Salter, P. A.; Welton, T. Phys.
Forces, structure, and dynamics in ionic liquids Der Fakult¨at f¨ ur Chemie und Mineralogie der Universit¨at Leipzig genehmigte
DISSERTATION zur Erlangung des akademischen Grades
DOCTOR RERUM NATURALIUM (Dr. rer. nat.) vorgelegt von Dipl. Chem. Stefan Zahn geboren am 8.9.1981 in Werdau, Sachsen
Angenommen aufgrund der Gutachten von: Prof. Dr. Barbara Kirchner Prof. Dr. Koen Binnemans Tag der Verleihung: 18.07.2011
Die in dieser Dissertation ver¨offentlichen Arbeiten wurden im Zeitraum Juli 2007 – Januar 2011 durchgef¨ uhrt.
Ich versichere, dass ich diese Arbeit eigenst¨andig verfasst habe und keine anderen als die angegebenen Quellen und Hilfsmittel benutzt sowie Zitate kenntlich gemacht habe.
Leipzig, den 19.3.2011
Betreuerin: Prof. Dr. Barbara Kirchner
ii
I do not know what I may appear to the world, but to myself I seem to have been only like a boy playing on the sea-shore, and diverting myself in now and then finding a smoother pebble or a prettier shell than ordinary, whilst the great ocean of truth lay all undiscovered before me. Sir Isaac Newton
iii
Bibliographische Daten: Stefan Zahn Forces, structure, and dynamics in ionic liquids Universt¨at Leipzig, Dissertation 154 Seiten, 49 Abbildungen, 23 Tabellen, 369 Literaturzitate
iv
Contents Curriculum vitae
ix
Referat
xi
1. Introduction
1
2. The cause of the low melting point of ionic liquids 3 2.1. The validity of the energy landscape paradigm . . . . . . . . . . . . . . . . 3 2.2. The role of intermolecular forces . . . . . . . . . . . . . . . . . . . . . . . 11 3. Assessment of Kohn–Sham density functional theory for ionic liquids 3.1. Basics of Kohn–Sham density functional theory . . . . . . . . . . . 3.2. Validation of Kohn–Sham density functional theory . . . . . . . . . 3.2.1. Selection of reference method . . . . . . . . . . . . . . . . . 3.2.2. Cation conformer data set . . . . . . . . . . . . . . . . . . . 3.2.3. Counter ion pair data set . . . . . . . . . . . . . . . . . . . . 3.2.4. Ionic liquid – solute data set . . . . . . . . . . . . . . . . . . 3.2.5. Summary of data sets . . . . . . . . . . . . . . . . . . . . . 4. Structure and dynamics in a protic ionic liquid 4.1. Monomethylammonium nitrate — a protic ionic liquid . . . . . . . 4.2. Liquid structure of monomethylammonium nitrate . . . . . . . . . . 4.2.1. Structure of counter ions . . . . . . . . . . . . . . . . . . . . 4.2.2. Hydrogen bonds . . . . . . . . . . . . . . . . . . . . . . . . 4.2.3. Structure of like ions . . . . . . . . . . . . . . . . . . . . . . 4.2.4. Nano-scale segregation . . . . . . . . . . . . . . . . . . . . . 4.3. Ion pairing and ion dynamics . . . . . . . . . . . . . . . . . . . . . 4.3.1. Determining ion pair lifetimes . . . . . . . . . . . . . . . . . 4.3.2. Ion pair lifetimes depending on initial ion pair conformation
. . . . . . .
. . . . . . . . .
. . . . . . .
. . . . . . . . .
. . . . . . .
. . . . . . . . .
. . . . . . .
17 17 19 20 22 24 25 31
. . . . . . . . .
33 33 34 35 39 41 44 44 45 46
v
Contents 4.3.3. Lifetime of a particular ion pair conformation 4.3.4. Dynamics of the ion pair conformations . . . . 4.3.5. Conformation memory loss of ion pairs . . . . 4.3.6. Rotation of ions . . . . . . . . . . . . . . . . . 4.4. Hydrogen bond dynamics . . . . . . . . . . . . . . . . 4.5. Comparison to imidazolium-based ionic liquids . . . . 5. Water in protic ionic liquids 5.1. Water — A typical impurity of ionic liquids . 5.2. Liquid structure . . . . . . . . . . . . . . . . . 5.3. Influence of MMAN on water . . . . . . . . . 5.3.1. Intramolecular bonds . . . . . . . . . . 5.3.2. Hydrogen bond network and dynamics 5.3.3. Dipole . . . . . . . . . . . . . . . . . . 5.4. Influence of water on MMAN . . . . . . . . . 5.4.1. Structure . . . . . . . . . . . . . . . . 5.4.2. Rotation of ions . . . . . . . . . . . . . 5.4.3. Electronic structure . . . . . . . . . . . 5.5. Comparison to imidazolium-based ionic liquids
. . . . . . . . . . .
. . . . . . . . . . .
. . . . . . . . . . .
. . . . . . . . . . .
. . . . . .
. . . . . . . . . . .
. . . . . .
. . . . . . . . . . .
. . . . . .
. . . . . . . . . . .
. . . . . .
. . . . . . . . . . .
. . . . . .
. . . . . . . . . . .
. . . . . .
. . . . . . . . . . .
. . . . . .
. . . . . . . . . . .
. . . . . .
. . . . . . . . . . .
. . . . . .
. . . . . . . . . . .
. . . . . .
. . . . . . . . . . .
. . . . . .
. . . . . . . . . . .
. . . . . .
47 48 49 51 53 57
. . . . . . . . . . .
59 59 61 63 64 65 67 69 70 73 75 75
6. Pnicogen bonds 77 6.1. Bond strength of the non-covalent interaction . . . . . . . . . . . . . . . . 77 6.2. Cause of the attractive interaction . . . . . . . . . . . . . . . . . . . . . . . 82 7. Summary A. Computational details A.1. Computational details of section 2.1 . . . . . . . . . . . . . . . . . . . . . A.1.1. Relaxed dissociation energies of table 2.1 . . . . . . . . . . . . . . A.1.2. Relaxed dissociation energies of table 2.2 and potential energy surface of Fig. 2.3 . . . . . . . . . . . . . . . . . . . . . . . . . . . . A.1.3. Classical molecular dynamics simulations . . . . . . . . . . . . . A.2. Computational details of section 2.2 . . . . . . . . . . . . . . . . . . . . . A.2.1. SAPT calculations . . . . . . . . . . . . . . . . . . . . . . . . . . A.2.2. Interaction potential of two ion pairs (Fig. 2.8) . . . . . . . . . . . A.3. Computational details of section 3.2 . . . . . . . . . . . . . . . . . . . . .
vi
91 95 . 95 . 95 . . . . . .
95 96 96 96 99 100
Contents A.4. Computational details of chapter 4 . . A.4.1. Monomethylammonium nitrate A.4.2. Water . . . . . . . . . . . . . . A.5. Computational details of chapter 5 . . A.6. Computational details of chapter 6 . .
. . . . .
. . . . .
. . . . .
. . . . .
. . . . .
. . . . .
. . . . .
. . . . .
. . . . .
. . . . .
. . . . .
. . . . .
. . . . .
. . . . .
. . . . .
. . . . .
. . . . .
. . . . .
. . . . .
. . . . .
100 100 102 103 104
List of abbreviations
107
List of publications
109
Conference contributions
113
Danksagung
117
Bibliography
119
vii
viii
Curriculum vitae Personal
Stefan Zahn Theodor-Neubauer-Straße 21 04318 Leipzig, Germany Date of birth: 08.09.1981 Place of birth: Werdau, Germany Citizenship: German
School 09/1991-06/2000
Gymnasium “Alexander von Humboldt”, Werdau
06/2000
Abitur (High school diploma)
Civilian service 09/2000-06/2001
Paracelsus-Klinik, Zwickau
University 10/2001-04/2006
Friedrich-Schiller-Universit¨ at Jena (University of Jena, Germany) Field of study: chemistry
04/2006
Diploma in chemistry
Awards 06/2000
Book award of the Verband der Chemischen Industrie (VCI) as best chemistry high school diploma (Werdau, Germany, 2000)
ix
Curriculum vitae
Scientific Appointment 10/2001-04/2006
Student research assistant at the Institut f¨ ur Physikalische Chemie of the Friedrich-Schiller-Universit¨at Jena, Jena
05/2006-07/2007
Research associate at the Institut f¨ ur Organische Chemie und Makromolekulare Chemie of the Friedrich-Schiller-Universit¨at Jena, Jena
07/2007-03/2011
Research associate at the Wilhelm–Ostwald–Institut f¨ ur Physikalische und Theoretische Chemie, Leipzig
from 03/2011
Research fellowship at the School of Chemistry of Monash University, Melbourne
Miscellaneous 07/2007-04/2010
Grant of computer time at the John-von-Neumann-Institut f¨ ur Computing, J¨ ulich
02/2008
Organization of the SPP 1191 winter school in Leipzig
09/2008-08/2009
Grant of computer time at the Zentrum f¨ ur Informationsdienste und Hochleistungsrechnen, Dresden
02/2009
Organization of the “Saxonian Theorie Seminar — Theoretical methods for complex molecular systems“ in Leipzig
19th March 2011, Leipzig
x
Referat Die Vielfalt, mit der Ionen zu ionischen Fl¨ ussigkeiten kombiniert werden k¨onnen, vermittelt den Eindruck, dass f¨ ur jede Situation das passende L¨osungsmittel entworfen werden kann. Obwohl erste systematische Studien dieser Salze bereits 1914 durchgef¨ uhrt wurden, ist ihr Potential erst mit der erfolgreichen Synthese von luft- und wasserstabilen imidazoliumbasierten ionischen Fl¨ ussigkeiten zu Beginn der 90er Jahre erkannt wurden. Oft tragen verschiedenste Aspekte zu den faszinierenden Eigenschaften der ionischen Fl¨ ussigkeiten bei. Im Rahmen dieser Dissertation wurden Kr¨afte, dynamische Prozesse und strukturelle Besonderheiten der fl¨ ussigen Phase von ionischen Fl¨ ussigkeiten mit Hilfe computergest¨ utzter Methoden charakterisiert, um die Ursache chemischer und physikalischer Eigenschaften auf molekularer Ebene herauszuarbeiten. Es konnte gezeigt werden, dass die Substitution des aciden Wasserstoffatoms am C2-Atom in 1,3-dialkylimidazoliumbasierten ionischen Fl¨ ussigkeiten durch eine Methylgruppe die Beweglichkeit des Anions erheblich einschr¨ankt. Dadurch muss eine h¨ohere Energiebarriere in der methylierten Verbindung u ¨berwunden werden, um die f¨ ur das Schmelzen der Substanz n¨otige kritische Auslenkung aus der Gleichgewichtslage zu erreichen. Damit wurde zum einen herausgestellt, warum die Methylierung der 1,3-dialkylimidazoliumbasierten ionischen Fl¨ ussigkeiten zu einer deutlichen Erh¨ohung des Schmelzpunktes anstatt, wie man intuitiv vermuten w¨ urde, zu einer Schmelzpunkterniedrigung f¨ uhrt. Zum anderen wurde mit diesem Beispiel die G¨ ultigkeit des Energiepotentialfl¨achenmodells f¨ ur ionische Fl¨ ussigkeiten belegt. Aufbauend auf diesem Ergebnis wurden die in einer ionischen Fl¨ ussigkeit wirkenden Kr¨afte zwischen Ionen denen eines typischen Salzes gegen¨ ubergestellt, um deren Einfluss auf die Energiepotentialfl¨ache zu untersuchen. Als signifikanter Unterschied wurde ein bedeutender Einfluss der Dispersionskr¨afte auf den Gleichgewichtsabstand und die Wechselwirkungsenergie der Ionen bei den ionischen Fl¨ ussigkeiten gefunden. Dies resultiert in einer flacheren Energiepotentialfl¨ache bei ionischen Fl¨ ussigkeiten im Vergleich zu einem typischen Salz und tr¨agt damit zu den niedrigen Schmelzpunkten von ionischen Fl¨ ussigkeiten bei.
xi
Referat Der signifikante Einfluss von Dispersionskr¨aften weist ebenfalls auf Schwachpunkte bei ab initio Molekulardynamik-Simulationen hin. Die schlechte Beschreibung dieser Kr¨afte in der zugrunde liegenden elektronischen Struktur, der Dichtefunktionaltheorie nach Kohn und Sham, ist allgemein bekannt. Um die Genauigkeit dieser Methodik f¨ ur die Beschreibung von ionischen Fl¨ ussigkeiten zu untersuchen, wurden typische verwendete Funktionale sowie zwei empirische Dispersionskorrekturen f¨ ur die Dichtefunktionaltheorie validiert. Eine vergleichbare Genauigkeit zu post–Hartree–Fock Methoden wurde ausschließlich bei der Verwendung von empirischen Dispersionskorrekturen erreicht. Es stellte sich heraus, dass klassische Funktionale ohne Dispersionskorrektur, wie zum Beispiel das popul¨are B3LYP, in der Beschreibung ionischer Fl¨ ussigkeiten versagen, da erhebliche energetische und strukturelle Abweichungen zur post–Hartree–Fock Referenz beobachtet wurden. Eine der beiden validierten dispersionskorrigierten Dichtefunktionalmethoden wurde anschließend in Car–Parrinello Molekulardynamik-Simulationen von protischen ionischen Fl¨ ussigkeiten und deren Mischungen mit Wasser verwendet. Dabei wurde nachgewiesen, dass die untersuchte protische ionische Fl¨ ussigkeit, Monomethylammoniumnitrat, als eine Fl¨ ussigkeit verstanden werden kann, in der sich die Ionen in langlebigen K¨afigen aus entgegengesetzt geladenen Ionen befinden. Innerhalb des K¨afigs wird jedoch eine schnelle Ionendynamik beobachtet. Ein ¨ahnliches Verhalten wurde bereits f¨ ur imidazoliumbasierte ionische Fl¨ ussigkeiten beschrieben. Signifikante Unterschiede zwischen protischen ionischen Fl¨ ussigkeiten und imidazoliumbasierten ionischen Fl¨ ussigkeiten wurden hingegen bei deren Mischungen mit Wasser gefunden. W¨ahrend Wasser in imidazoliumbasierten ionischen Fl¨ ussigkeiten Wasserstoffbr¨ uckenbindungen bevorzugt zum Anion ausbildet, wird in protischen ionischen Fl¨ ussigkeiten eine st¨arkere Wasserstoffbr¨ uckenbindung zum Kation gefunden. Die vergleichbare Dynamik und Bindungst¨arke aller Wasserstoffbr¨ ucken eines Wassermolek¨ uls in protischen ionischen Fl¨ ussigkeiten zeigt eine ausgezeichnete Einbindung des Wassers in das Wasserstoffbr¨ uckennetzwerk der protischen ionischen Fl¨ ussigkeit. Gleichwohl dieser Einbindung und der ionischen Umgebung wird eine Depolarisierung des Wassers in der protischen ionischen Fl¨ ussigkeit im Vergleich zu reinem Wasser beobachtet. Dies deutet auf eine signifikante kurzreichweitige elektrostatische Abschirmung in Monomethylammoniumnitrat hin, die die effektiv wirkende Ladung auf das Wasser erheblich reduziert. Neben ionischen Fl¨ ussigkeiten wurde eine nicht kovalente Wechselwirkung zwischen Elementen der Stickstoffgruppe untersucht. Es wurde gezeigt, dass diese Pnicogen-Bindungen eine vergleichbare St¨arke wie eine Wasserstoffbr¨ ucke zwischen zwei Wassermolek¨ ulen haben k¨onnen, womit deren Einsatz als molekularer Anker zwischen zwei Molek¨ ulen in Be-
xii
tracht kommt. Die charakteristische Wechselwirkung der Elemente der Stickstoffgruppe findet dabei zwischen dem freien Elektronenpaar des einen Pnicogens mit einem positiv geladenen G¨ urtel um das freie Elektronenpaar des anderen Pnicogens statt. Ferner wurde herausgearbeitet, welche Substituenten an den wechselwirkenden Pnicogenen die Bindungsst¨arke vergr¨oßern.
xiii
1. Introduction Ionic liquids offer high-potential solutions to an amazingly broad range of applications. The large number of cations and anions which can be combined to a low melting salt suggests the feasibility to design a required liquid for every task. The variety of possible ionic liquids even outnumbers traditional solvents in chemistry.1, 2 Unfortunately, little is known about general properties of ionic liquids except the obvious fact that they consist solely of ions. It is the human and scientific nature that always finds its way to characterize the unknown or find ways to overcome challenges. One such challange is the distillation of ionic liquids which was originally thought impossible due to the low volatility of known ionic liquids. However, ionic liquids can be distilled.3 The history of ionic liquids goes back nearly one hundred years. As early as 1914, Paul Walden reported the first systematic study of ionic liquids.4 However, the scope of ionic liquids was recognized barely until the development of air and water stable imidazoliumbased ionic liquids in 1992.5 Since then, the interest in these compounds has increased greatly leading to manifold applications of these compounds in natural sciences and industry.1, 2, 6–15 Nevertheless, even fundamental properties of ionic liquids are far from being understood. Due to the technical progress and the developments in theoretical chemistry over the last 20 years, computational methods have become a powerful tool in chemistry because various approaches can be employed for an investigation at the molecular scale. Observed macroscopic properties can be assigned to functional parts of a molecule which facilitates a more task-related design of new compounds. Still, the interplay of nuclei and electrons is too complex for feasible black box methods of systems larger than a few atoms until now. Therefore, a computational chemist should always choose an approach carefully and verify how the necessary approximations influence the results. Ionic liquids are a special challenge for computional chemistry. Due to the important role of cooperativity,16 the investigation of large systems is necessary to obtain reliable results. Unfortunately, only for medium sized systems are computional approaches available which possess the required flexibility of electronic structure for an accurate ab initio description of coopera-
1
1. Introduction tivity. Additionally, as will be discussed in detail in chapter 3, not only cooperativity, but also intermolecular forces make the choice of a reliable approach for ionic liquids a challenging task. Nevertheless, carefully selected computational approaches allow predictions for ionic liquids which can be confirmed by experiments if possible. One example is the nanoscale segregation of polar and nonpolar domains (also called microheterogeneity) in ionic liquids. These domains were found in corse-grained model17 and in fully atomistic model molecular dynamics simulations18 before they were reported by X-ray diffraction19 or Raman-induced Kerr effect spectroscopy20 studies as well. Not only the prediction of the liquid structure but also the calculation of thermodynamic data, like the gaseous enthalpy of formation, is feasible.21 These two selected examples exemplify that carefully selected computational approaches are a powerful tool for the investigation of ionic liquids.22–28 The presented studies focus on the forces, structure, and dynamics in ionic liquid systems which are investigated by various computational approaches. The validity of the energy landscape paradigm for ionic liquids is discussed and the significant contribution of dispersion forces in the interaction of ionic liquid ions is highlighted as one cause for the low melting point of these liquids. Furthermore, this thesis presents the first detailed molecular view on structure and dynamics of a pure protic ionic liquid as well as a mixture of this liquid with water using ab initio molecular dynamics simulations. Thus, this thesis aims to highlight molecular features of ionic liquids which contribute to the fascinating properties of these liquids. Additionally, the Kohn–Sham density functional theory is validated for ionic liquids to improve the reliability of static quantum chemistry investigations and ab initio molecular dynamics simulations of ionic liquid systems. Finally, a new possible linker in supramolecular chemistry is characterized.
2
2. The cause of the low melting point of ionic liquids This chapter gives an overview of selected molecular features for the low solid-liquid transition temperature of ionic liquids which can be as low as -100 ◦ C. The validity of the energy landscape paradigm for ionic liquids will be discussed and the role of intermolecular forces is highlighted as one feature for the low melting point of ionic liquids. Parts of this chapter were published in Angew. Chem. Int. Ed., 2008, 47, 3639–3641 (publication 2) and in Phys. Chem. Chem. Phys., 2008, 10, 6921–6924 (publication 6).
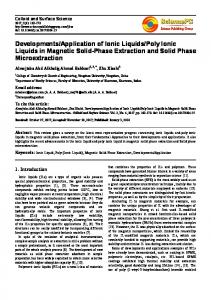
2.1. The validity of the energy landscape paradigm In early approaches, the low solid-liquid transition temperature of ionic liquids was attributed to the large size of the ions resulting in a weak interaction energy.7 According to the coulomb force, given by: Z +Z − FC = (2.1) 4π�0 r2 a large distance between charged species results in a low attractive force. Because most ionic liquids possess large ions, one may expect a weak coulomb interaction due to the larger distance of the charge centers of each ion. If one considers the relaxed dissociation energies from ab initio calculations between a counter ion pair of typical ionic liquids, see table 2.1, these energies are smaller than from a typical salt like [Na][Cl] (545.0 kJ/mol with TZVPP/MP2). However, these calculations and further computational investigations29–31 show that the dissociation energy of most ionic liquids is in excess of 300 kJ/mol which is significant larger than for common liquids. For example, two water molecules have a dissociation energy of approximately 20 kJ/mol.32 Therefore, it is not unexpected that no correlation between the dissociation energy and the melting point of ionic liquids can be observed, see Fig. 2.1. Similar results were reported by Turner et al. who found a correlation of the melting point and the interaction energy for selected compounds of
3
2. The cause of the low melting point of ionic liquids imidazolium based ionic liquids.29 Nevertheless, the difference between successive melting points is much greater than the difference between successive energies and a general correlation was excluded. An investigation of Tsuzuki et al. confirm this observation.30 Based on these results, it seems questionable whether the consideration of interaction energies leads solely to an understanding of the low melting point. Table 2.1.: Relaxed dissociation energy Ediss in kJ/mol (TZVPP/MP2) of the investigated counter ion pairs and melting temperature TM in K of selected imidazolium based ionic liquids.
[C1 mim][Cl] [C2 mim][Cl] [C2 mim][BF4 ] [C2 mim][AlCl4 ] [C2 mim][SCN] [C2 mim][DCA]
Ediss 400.9 411.5 362.3 328.2 376.8 358.4
TM 39833 36033 28834 35735 26736 25237
A more promising approach to discuss the melting point turns out to be the investigation of the energy landscape. Goldstein stated in 1969: “...that portion of the potential energy surface that represents the liquid or glassy region has, unlike the portion associated with the crystalline solid, a large number of minima, of varying depths.”38 According to Goldstein’s theory, the occupied conformational states of a high melting compound are located in deep and steep parts of the energy potential surface. Thus, a high activation energy is required for a conformational change of the compound which is necessary for melting. On the other hand, a low melting compound has shallow energy potentials and low transition states between conformational states resulting in a gliding movement of the molecules. Goldstein’s seminal ideas have been applied in chemistry, physics and material sciences.39–53 Especially, the successful application for glasses and supercooled liquids is mentionable46 because several experimental investigations indicate similarities between typical glass forming liquids and ionic liquids.54–56 Unfortunately, an experimental investigation of the energy landscape remains elusive. A connection to experiments could be drawn from the Lindemann melting rule.57, 58 Lindemann stated that particles exceed a critical displacement at the solid-liquid transition which was shown by Martin
4
2.1. The validity of the energy landscape paradigm
Figure 2.1.: Melting point plotted against the calculated dissociation energy (TZVPP/MP2) of counter ion pairs of selected imidazolium-based ionic liquids.
and O’Connorin.59 A probable hypothesis considers the activation energy for the critical displacement. A low barrier of this displacement would be reflected in a low melting temperature which is the connection to the energy landscape paradigm of Goldstein. As an example to test the validity of Goldstein’s model for ionic liquids, the substitution of the most acidic proton at C2 of 1,3-dialkylimidazolium based ionic liquids with a methyl group was selected, see Fig. 2.2 for an illustration of the substitution. This substitution replaces an attractive interaction with a repulsive interaction and, therefore, a lower melting temperature and viscosity is expected. However, the opposite was observed, see table 2.3. Hunt has attributed the increased melting temperature and higher viscosity for the 1,2,3trialkyl species to a decreased free rotation of the butyl-side chain at C160 which supports the energy landscape paradigm. On the other hand, the decreased melting temperature can be found also for imidazolium based ionic liquids with shorter side chains. Thus, the following investigation compares the properties of 1,3-dimethylimidazolium chloride ([C1 mim][Cl]) with 1,2,3-trimethylimidazolium chloride ([C1 C1 mim][Cl]) for which effects of the side chain can be excluded. As listed in table 2.2, the dissociation energy differs only slightly for the comparable minimum structures of both ionic liquids which was observed
5
2. The cause of the low melting point of ionic liquids for ([C2 mim][BF4 ]) and ([C2 C1 mim][BF4 ]) by Tsuzuki et al., too.30 Interestingly, the two most energetically preferred structures (DA and DB ) of [C1 mim][Cl] possess nearly the same dissociation energy while no minimum can be found for [C1 C1 mim][Cl] in which the anion is located in front of the C2 atom (see TA in Fig. 2.2). As only one minimum, which is at least 35 kJ/mol more stable than other investigated ion pair conformations, can be found for [C1 C1 mim][Cl], the picture of an anion caught in a hollow of the energy landscape emerges for [C1 C1 mim][Cl].
Figure 2.2.: Ball-and-stick model of investigated conformations of [C1 mim][Cl] (D) and [C1 C1 mim][Cl] (T). The red circles highlight the substitution of the most acidic proton at C2.
Table 2.2.: Relaxed dissociation energy Ediss ([A][B]−→[A]+[B]) for investigated [C1 mim][Cl] (D) and [C1 C1 mim][Cl] (T) conformations shown in Fig. 2.2. All values are given in kJ/mol (aug-cc-pVTZ/SCS-MP2//cc-pVTZ/MP2).
Ediss
6
DA 384.1
DB 386.2
DC 352.1
DD 330.2
TB TC 383.4 345.0
TD 319.7
2.1. The validity of the energy landscape paradigm
Table 2.3.: Comparison of melting points TM in K for imidazolium based ionic liquids.
TM anion − Cl
−
Br − BF4 − PF6
−
CO2 CF3 − N(SO2 C2 F5 )2
X C2 H5 C3 H7 C4 H9 C2 H5 C4 H9 C2 H5 C3 H7 C4 H9 C2 H5 C2 H5
[Xmim][anion] 36061 /36262 33362 31463 35262 19162, 66 /19267, 68 33164, 70, 71 /33272 /33562 29470, 71 /31362 28362, 63 /28469 /28972 25973 27262
[XC1 mim][anion] 46162 41162 37364 /37865 41462 31069 46962 35162 31364 33273 29862
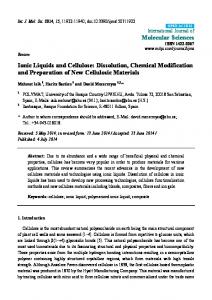
To obtain more detailed insight on the potential surface, the energy path for structure DB /TB over DA /TA to DB /TB (opposite side) is considered by freezing the dihedral angle Cl-C2-N1-C5 during optimization, see Fig 2.3. The activation energy for the side change is below 10 kJ/mol for the lower melting [C1 mim][Cl], while it is increased above 40 kJ/mol for [C1 C1 mim][Cl]. Other pathways, in which the anion crosses the imidazolium plane with an energy barrier below 10 kJ/mol, can be excluded for [C1 C1 mim][Cl] because the anion must always pass the minima structures TC or TD which are at least 35 kJ/mol less stable than TB . As a result, the anion is caught in a steep part of the potential surface at the top side of the imidazolium ring for [C1 C1 mim][Cl]. In contrast, the anion in the lower melting [C1 mim][Cl] can easily change the position relative to the imidazolium plane. Therefore, the critical displacement can be reached at a lower temperature in [C1 mim][Cl] than in [C1 C1 mim][Cl] according to the Lindemann melting rule. A recent investigation has shown that the energy potential surface from structure DB /TB over DA /TA to DB /TB (opposite side) is shallower if the length of the alkyl-side chain is increased or the the size of the anion is larger.31 This correlates also with the melting point. Unfortunately, all previous calculations of counter ion pairs neglect the influence of solvation. Several studies indicate π-π stacking of the imidazolium cations.74–77 Thus,
7
2. The cause of the low melting point of ionic liquids
Figure 2.3.: Potential energy surface (aug-cc-pVTZ/SCS-MP2//cc-pVTZ/MP2) from DB /TB to DB /TB (opposite side) via conformer DA /TA in dependence of the dihedral angle Cl-C2-N1-C5 for [C1 mim][Cl] (blue) and [C1 C1 mim][Cl] (red)
it seems questionable if the ion pair conformations DB and TB are important for the liquid state because these possible anion positions might be already occupied by cations. Regrettably, neutron scattering experiments78, 79 or ab initio molecular dynamics simulations74, 80, 81 are reported only for [C1 mim][Cl] and not for [C1 C1 mim][Cl] up to now. Classical molecular dynamics simulations are less reliable as ab initio molecular dynamics simulations. However, this type of simulations is feasible for large systems and has proven a powerful tool to calculate thermodynamic properties of ionic liquids.27 Therefore, classical molecular dynamics simulations of 1-ethyl-3-methylimidazolium chloride ([C2 mim][Cl]) and 1-ethyl-2,3-dimethylimidazolium chloride ([C2 C1 mim][Cl]) were carried out to determine the structural impact of the hydrogen substitution at C2 by a methyl group on the liquid structure. The details of the simulations setup are given in section A.1.3 of the appendix. Only the calculated partial charges of the force field parametrization will be highlighted here. Intuitively, an increase of the electron density at C2 is expected due to the insertion of an electron releasing methyl group. Instead of that, the electron density at C2 is decreased in [C2 C1 mim][Cl] compared to [C2 mim][Cl] while the charge of C4 and C5 is increased slightly, see table 2.4. This influence of the methyl group on the charge
8
2.1. The validity of the energy landscape paradigm distribution was also found by Hunt60 and was confirmed in a vibrational and NMR spectroscopy study recently.82 The unexpected charge rearrangement might result solely from removing the positively charged hydrogen atom which decreases the electron density at C2.82 This effect might be stronger than the +I-effect of the methyl group. Interestingly, the more negatively charged C4 and C5 in [C2 C1 mim][Cl] than in [C2 mim][Cl] do not result in a stronger interaction of the counter ion pair conformations TC /TD compared to DC /DD , see table 2.2. Nonetheless, the interaction energy of counter ion pairs has no correlation with the melting point as noted before. Table 2.4.: Selected restrained electrostatic potentials83 (RESP) in a.u. calculated for the classical molecular dynamics simulations of [C2 mim][Cl] and [C2 C1 mim][Cl]. Corresponding structures and labels are shown in Fig. 2.4.
N1 C2 N3 C4 C5 [C2 mim][Cl] 0.099 −0.106 0.246 −0.253 −0.184 [C2 C1 mim][Cl] 0.013 0.250 0.146 −0.288 −0.195
Figure 2.4.: Ball-and-stick model with atom labels of [C2 mim][Cl] (left) and [C2 C1 mim][Cl] (right)
A possible illustration of the energy landscape can be obtained from molecular dynamics simulations by the spatial distribution function (SDF)84 which is correlated to the potential energy surface. The spatial distribution function captures the three-dimensional structure around a chosen molecule by showing the probability to find a particle within a certain region. A high probability to find a particle is connected to a low energy on the potential energy surface while a low probability is related to a high energy barrier
9
2. The cause of the low melting point of ionic liquids for a particle to reach this place. In agreement with the static quantum chemistry calculations, a large sphere in front of the H2 is observed for [C2 mim][Cl] which smears out slightly above and below the imidazolium ring, see Fig. 2.5a. The conformation DB with a dihedral-angle Cl-C2-N1-C5 of about 90◦ is rarely populated because this positions is occupied by an adjacent cation. The same preferred position of the [C2 mim][Cl] cation was also found in the simulation study of Qiao et al.76 In contrast to this, no sphere is found in front of the middle methyl group in [C2 C1 mim][Cl], see Fig. 2.5b. Only few dots are apparent above and below the imidazolium ring close to structure TB . Therefore, the acidic proton at C2 enhances the mobility of the anion resulting in a lower activation barrier to reach the critical displacement for melting. This result supports the validity of the energy landscape paradigm for ionic liquids because the comparison of the spatial distribution functions at the same energy level reveals that the anion of [C2 mim][Cl] is more delocalized than the one of [C2 C1 mim][Cl].
Figure 2.5.: Spatial distribution function (SDF) of chloride for [C2 mim][Cl] (a) and [C2 C1 mim][Cl] (b). The isosurface is plotted at 30 times (yellow outer surface) and 20 times (pink interior surface) of the average anion density less than the corresponding largest local anion density in each simulation.
Further evidence of the validity of Goldstein’s model for ionic liquids can be found in the molecular dynamics simulations of Urahata and Ribeiro.85 Their results indicate an enlarged delocalization for the chloride anion with increasing side chain of 1alkyl-3-methylimidazolium chlorides from methyl to butyl while the melting point of the investigated compounds decreases. Furthermore, the delocalization of the anion of 1butyl-3-methylimidazolium chloride ([C4 mim][Cl]) and 1-octyl-3-methylimidazolium chloride ([C8 mim][Cl]) is similar which is also in agreement with the melting point. The results of Urahata and Ribeiro as well as the results presented in this section show that
10
2.2. The role of intermolecular forces the energy landscape paradigm can be applied to ionic liquids for a discussion of the melting point.
2.2. The role of intermolecular forces The low melting point is one of the fundamental properties of ionic liquids which is still not fully understood. As discussed in the previous section, the energy landscape paradigm can be employed to reveal molecular properties resulting in a low melting point. It is obvious that several diverse molecular features can contribute to a shallow energy potential surface. Asymmetrical ions are recognized as one molecular feature for a low melting point.2, 7, 73, 86–89 A low symmetry of the ions results in a large number of minima on the energy landscape. Furthermore, the ion size disparity and charge distribution are identified as important molecular properties related to the melting point or transport properties of ionic liquids.7, 88, 90–92 Additionally, functional parts of the molecule such as hydrogen bonds73, 82, 93, 94 or alkyl chain length7, 73, 88 might contribute to a low melting point. In the following section, it will be addressed to what extent the melting point of ionic liquids originates from the interplay of intermolecular forces. It has been inferred that other forces besides pure coulomb interactions must play a role in ionic liquids.30, 95–97 Thus, the symmetry-adapted perturbation theory98 (SAPT) method was employed to decompose the total interaction energy of one ion pair of different ionic liquid model compounds, 1,3-dimethylimidazolium chloride ([C1 mim][Cl]), monoethyltrimethylammonium chloride ([N2111 ][Cl]), and 1-methylpyridinium chloride ([C1 Py][Cl]), as well as one ion pair of a typical salt, sodium chloride ([Na][Cl]), into the different force contributions. The energy potentials with circles of Fig. 2.6 contain the Pauli repulsion and electrostatic forces contribution, the potentials with squares include additionally the contribution of induction forces while the potentials with diamonds illustrate the total interaction energy considering dispersion contribution. Please note that the equilibrium distance is set to zero in order to provide comparability. The main contribution to the total interaction energy stems from the electrostatic interaction for all species highlighting strong ionic interactions. However, the equilibrium structure is not determined exclusively by the major force for all compounds. While the equilibrium distance of the total interaction potential is shifted only about 10 pm for [Na][Cl] compared to the equilibrium distance of the electrostatic and exchange potential, this shift is significantly larger for all ionic liquid model systems. This finding demon-
11
2. The cause of the low melting point of ionic liquids
Figure 2.6.: Interaction energies versus distance for [C1 mim][Cl] (a), [C1 Py][Cl] (b), [N2111 ][Cl] (c), and [Na][Cl] (d) obtained by the symmetry-adapted perturbation theory
12
2.2. The role of intermolecular forces strates that the ions of the ionic liquid model systems interact much more in the repulsive region of the hypothetical potential consisting of electrostatic and Pauli repulsion because dispersion and induction forces have a significant impact on interaction energy and the obtained equilibrium structures. Thus, ionic liquids are not as ionic as one may imagine naively supporting the idea of charge screening in ionic liquids.16, 80, 99–103 The important role of induction forces for ionic liquids was shown by Yan et al. who have compared thermodynamic properties obtained from a polarizable and a nonpolarizable force field.95 Furthermore, charge scaling seems reasonable for classical molecular dynamics simulations of ionic liquids16, 80, 99–102 to consider induction forces. Interestingly, the influence of induction and dispersion is comparable on the equilibrium structure and the interaction energy of ionic liquids while dispersion forces play a negligible role in a typical salt. As a result of the significant contribution of dispersion forces and the intermolecular forces interplay, ionic liquids possess a shallower interaction potential than typical salts. Thus, the ionic liquid counter ions can change their respective distances more easily. The flattening of the interaction potential by the interplay of intermolecular forces can be observed independently of the position of the counter ions to each other, see Fig. 2.7. Therefore, one contribution to the low melting temperature of ionic liquids stems from the special composition of intermolecular forces according to the energy landscape paradigm. In 1914, Walden proposed that one should not think in terms of isolated ions.4 Thus, the energy potential of two ion pairs dissociating into separated ion pairs is investigated for [C1 mim][Cl] and [Na][Cl]. Unfortunately, the symmetry-adapted perturbation theory is not feasible for these systems. Hence, single-point calculations with the Hartree–Fock (HF) method and the spin-component-scaled Møller-Plesset perturbation theory104 (SCSMP2) were carried out at the same geometries. The difference between these energies provides a rough estimate of the dispersion forces, because HF does not describe dispersion interaction by definition while SCS-MP2 accounts for these interactions very well.104–106 In Fig. 2.8 the red curve with squares perfectly matches the red curve with diamonds, indicating that dispersion forces also play a negligible role for the interaction between [Na][Cl] ion pairs. This is not the case in the selected ionic liquid example. Almost 30 % of the total energy (SCS-MP2) is missing in the HF curve at the equilibrium distance for [C1 mim][Cl], see Fig. 2.8. As a result, the location of the minima of the SCS-MP2 curve for [C1 mim][Cl] is shifted 40 pm compared to the HF potential. In opposite to the ionic liquid, the [Na][Cl] minimum distance is the same regardless of the applied method. Thus, two ion pairs of an ionic liquid are closer together than the electrostatic forces would allow as well, resulting in flatter and broader energy potentials for ionic liquids than typical salts.
13
2. The cause of the low melting point of ionic liquids
Figure 2.7.: Interaction energies versus distance for [C1 mim][Cl] of structure DA (a), DB (b), DC (c), and DD (d) obtained by the symmetry-adapted perturbation theory
14
2.2. The role of intermolecular forces Therefore, the significant role of dispersion forces for the interplay of ionic liquid counter ions as well as two ion pairs is one important contribution to the low melting point of ionic liquids. This is supported by a recent investigation of Bernard et al. which shows that the ratio of total ion pair binding energy to its dispersion component correlates well with melting point, whereas the dispersion component of the ion pair binding energy correlates well with conductivity and viscosity.107
Figure 2.8.: Interaction energies obtained from the Hartee–Fock (squares) and the SCSMP2 (diamonds) approaches. The energy difference between the two methods is represented by triangles. All blue curves indicate the [C1 mim][Cl] dimer while the red curves denote the [Na][Cl] dimer.
15
16
3. Assessment of Kohn–Sham density functional theory for ionic liquids As discussed in chapter 2, dispersion forces have a significant influence on structure and interaction energy of ionic liquids. Unfortunately, suited post Hartree–Fock methods are limited to small systems while Kohn–Sham density functional theory which can be employed for larger systems fails in the description of dispersion forces.108–113 The following chapter will validate the performance of different types of functionals for ionic liquid systems. Parts of this chapter were published in J. Phys. Chem. A, 2008, 112, 8430–8435 (publication 3).
3.1. Basics of Kohn–Sham density functional theory The fundamental idea of density functional theory is that the ground state electron density is sufficient to determine molecular electronic properties. Considering the Born– Oppenheimer approximation, the expectation value of the energy E[ρ] consists of the kinetic energy Te [ρ] of the electrons, the electron-electron interaction energy Vee [ρ], the potential energy of the electrons in the field of the atom nuclei VeK [ρ], and the nucleusnucleus interaction energy VKK . E[ρ] = Te [ρ] + Vee [ρ] + VeK [ρ] + VKK
(3.1)
VKK is independent from the electron density due to the Born–Oppenheimer approximation. The correct analytic term is only known for VeK [ρ] which is given by the coulomb energy. N Z X ZI ρ(r) VeK [ρ] = − dr (3.2) |RI − r| I=1 In 1965, Kohn and Sham proposed a method allowing a feasible calculation of the missing terms.114 The basic assumption of the Kohn–Sham density functional theory
17
3. Assessment of Kohn–Sham density functional theory for ionic liquids is that the electron density of an interacting electron system can be obtained from an alternative system consisting of noninteracting particles. These noninteracting particles KS are characterized by orthogonal eigenfunctions Ψi which are called Kohn–Sham orbitals. Therefore, the Hartree product ansatz is exact because each particle interacts only with the potential of the nuclei. Furthermore, the total electron density can be obtained by adding the absolute value squared of all occupied n Kohn–Sham orbitals. ρ
KS
=
n X i=1
KS
|Ψi |2
(3.3) KS
Kohn and Sham stated that the electron density of the alternative system ρ should be the same as the electron density of the fully interacting system ρ. To provide this, the energy difference between the real system and the alternative system is considered. real
∆Te [ρ] = Te real
KS
n X ∇2 KS KS |Ψi i [ρ] − hΨi | − 2 i=1
(3.4)
n n 1X X 1 KS KS KS KS [ρ] − hΨi hΨj | |Ψj iΨi i 2 i=1 j=1;i6=j rij
(3.5)
KS
real
[ρ] − Te [ρ] = Te real
∆Vee [ρ] = Vee [ρ] − Vee [ρ] = Vee
Both correction terms are summarized in the so called exchange-correlation functional. EXC [ρ] = ∆Te [ρ] + ∆Vee [ρ]
(3.6)
Thus, the energy of the ground state is given by: KS
KS
E[ρ] = Te [ρ] + Vee [ρ] + VeK [ρ] + VKK + EXC [ρ]
(3.7)
The exact analytical term of the exchange-correlation functional is unknown but several approximations were proposed. All functional types mentioned in the following section have the similarity that the exchange-correlation functional can be divided into an exchange term EX [ρ] and a correlation term EC [ρ]. EXC [ρ] = EX [ρ] + EC [ρ] (3.8) Ideally, the exchange term should reproduce the repulsive exact Hartree–Fock exchange while the correlation term should reproduce the attractive dynamical-correlation effects. However, attractive dispersion-like interactions of some functionals originate from the exchange term.115
18
3.2. Validation of Kohn–Sham density functional theory The simplest exchange-correlation functionals are the local density approximation (LDA) functionals.116 For LDA functionals, it is assumed that the local electron density can be described as a homogeneous electron gas. However, this approximation is only valid if the electron density changes only slightly over space. Thus, the accuracy of LDA functionals is comparable to the Hartree–Fock approach. The accuracy can be improved if the derivative of the electron density is considered in the exchange-correlation functional. These methods are known as gradient corrected or generalized gradient approximation (GGA) functionals.116 Further improvement can be achieved by including kineticenergy density terms as in the meta generalized gradient approximation (meta-GGA) approaches.116 Furthermore, several hybrid functionals, like the popular B3LYP,117–119 are employed commonly.116 In opposite to LDA, GGA or meta-GGA functionals, hybrid functionals calculate a part of the exchange term EX [ρ] by the exact Hartree–Fock exchange.
3.2. Validation of Kohn–Sham density functional theory Commonly used ionic liquids consist of inorganic anions and organic cations with alkyl side chains and aromatic moieties. Both functional groups are well-known for a significant contribution of dispersion forces to equilibrium structure and interaction energy.120–122 Long alkyl chains of ionic liquids result in nanoscale segregation17–20, 123–125 in which the nonpolar domains are dominated by dispersion forces. Furthermore, π-π-stacking of aromatic cations was observed.74–76 Even the interplay of counter ions is influenced significantly by dispersion forces, see section 2.2. Therefore, reliable computational approaches for an investigation of ionic liquids need a proper description of dispersion forces. Ab initio correlated or so-called post Hartree–Fock methods provide a proper descriptions of dispersion forces. Unfortunately, these methods are computationally limited to systems with few atoms. On the other hand, Kohn–Sham density functional theory,114, 126 with computational cost much lower than that of conventional correlated methods, accounts for electrostatic, exchange and induction forces very well, but fails for the description of dispersion forces.108–113 Several possible solutions were proposed to correct this shortcoming of the Kohn–Sham density functional theory.127 A simple and intuitive introduction of van der Waals forces is to add a 1/r6 term,128–137 which was originally applied to correct the Hartree–Fock energy.138, 139 To prevent divergence at short interatomic distances, the 1/r6 term must be damped. Furthermore, an empirical dispersion correction
19
3. Assessment of Kohn–Sham density functional theory for ionic liquids can be included in a pseudopotential model.140–142 The seamless approach obtaines the dispersion interaction with a general function depending on quantity and distance of two local electron densities.143, 144 Another approach called the weighted density approximation (WDA)145 starts from the exact expression for the exchange correlation functional to obtain a WDA. An unknown pair-correlation function enters into the expression leading to an introduction of a weighted density parameter. It is also possible to include weak dispersion forces by making use of the correlation described by second-order Møller–Plesset perturbation theory, as for example in the range-separated-hybrid scheme.146, 147 The following study focus on the dependability of the Kohn–Sham density functional theory for ionic liquids. Commonly employed GGA (PBE,148, 149 BLYP,117, 118 and BP86117, 150 ) and meta-GGA (TPSS151 ) functionals are validated in addition to the Hartree–Fock approach which does not consider dispersion forces. Furthermore, the performance of two hybrid functionals (B3LYP117–119 and PBE0148, 149, 152 ) is investigated to determine the role of the exact Hartree–Fock exchange. Additionally, two empirical dispersion corrected approaches are validated. The first approach (DFT-D) includes the dispersion correction in the functional by a sum of damped interatomic potentials134 while the second ansatz includes the empirical correction in a dispersion-corrected atom-center dispersion potential (DCACP).153 Both approaches have shown an impressive performance for biomolecules compared to common functionals154, 155 whereas the computational effort is increased only slightly for the DCACP ansatz and is even negligible for the DFT-D approach. A low computational effort is desirable because cooperativity is important for ionic liquids.16 Thus, large systems must be investigated to obtain size independent results. All methods are evaluated for three different data sets.
3.2.1. Selection of reference method Several coupled cluster theory calculations including singles, doubles and non-iterative triples (CCSD(T)) of ionic liquids were reported so far.30, 90, 156–160 Tsuzuki et al. determined the interaction energy of a 1-ethyl-3-methylimidazolium tetrafluoroborate ([C2 mim][BF4 ]) ion pair employing the 6-311G∗ basis set.30 Hunt and Gould employed a correlation consistent valence double–ζ basis set for the interaction of 1-butyl3-methylimidazolium chloride ([C4 mim][Cl]).156 A reliable correlation consistent valence triple-ζ basis set was used by Izgorodina et al. who studied proton affinities of common + ionic liquid anions.90 Pimienta et al. investigated pentazole cation isomers (N5 H2 ) with the 6-311++G(d,p) basis set.157 Tsuzuki et al. estimated the CCSD(T) energy with
20
3.2. Validation of Kohn–Sham density functional theory a correlation consistent basis set of triple-ζ quality for several rotamers of a 1-butyl-3methylimidazolium cation and ion pair conformations of ([C4 mim][Cl]) and ([C4 mim][Br]) by calculating the sum of the MP2/cc-pVTZ relative energies and a CCSD(T) correction term.159 This correction term was obtained by calculating the energy difference of CCSD(T) and MP2 with the 6-31G∗ basis set. A similar ansatz was also applied by Tsuzuki et al. to extrapolate the CCSD(T) energy at the basis set limit for benzene complexes with pyridinium cations.158 These selected investigations illustrate that CCSD(T) calculations are even for one ion pair at the limit of this approach because only the investigation of Izgorodina et al. employed a recommended correlation consistent triple-ζ basis set. Hence, the MP2 method must be selected instead of CCSD(T) as reference ab initio method in that basis sets of triple-ζ quality are feasible for all further investigated systems. However, the question remains how reliable is a MP2 reference calculation. To clarify this, CCSD(T) calculations with a correlation consistent valence triple-ζ basis set (cc-pVTZ) were carried out for two conformers of 1,3-dimethylimidazolium chloride ([C1 mim][Cl]) which were already discussed in section 2.1, see table 3.1. The contribution of higher order correlation energy was determined with a similar scheme as employed in the investigations by Tsuzuki et al.158, 159 � � CCSDT MP 2 CCSDT MP 2 (3.9) − ∆E ∆E = ∆ECBS + ∆E cc−pV T Z
This is based on the assumption that the difference between the CCSD(T) and MP2 CCSDT MP 2 interaction energies (∆E − ∆E ) depends only slightly on the basis set and, therefore, can be determined with small or medium-sized basis sets like cc-pVTZ.161, 162 MP 2 ∆ECBS is the MP2 energy at the complete basis set limit which was obtained by the extrapolation proposed by Halkier et al.:163 MP 2
MP 2
∆ECBS =
∆EX
MP 2
X 3 − ∆EY X3 − Y 3
Y3
(3.10)
in which X and Y are the cardinal numbers of the cc-pVTZ and cc-pVQZ basis set, respectively. The performance of two split-valence triple-ζ basis sets with two additional polarization functions on all atoms, the TZVPP basis set of the Ahlrichs group and the cc-pVTZ of the Dunning group, was compared for the MP2 approach. The mean absolute deviation (MAD) for TZVPP (2.8 kJ/mol) is about 1.0 kJ/mol lower than for cc-pVTZ (3.8 kJ/mol). Therefore, the TZVPP basis set was used in the reference MP2 calculations of the following investigation.
21
3. Assessment of Kohn–Sham density functional theory for ionic liquids
Table 3.1.: Calculated relaxed dissociation energies for structure DA and DB of [C1 mim][Cl] in kJ/mol. Structures are shown in Fig. 2.2. MP 2
DA DB
∆ET ZV P P
∆Ecc−pV T Z
MP 2
∆Ecc−pV QZ
MP 2
∆ECBS
∆Ecc−pV T Z
−400.7 −398.3
−400.4 −396.0
−399.1 −400.0
−398.2 −402.9
−401.2 −395.2
MP 2
CCSDT
∆E
CCSDT
−399.0 −402.1
3.2.2. Cation conformer data set The first data set consists of different conformers of the 1-butyl-3-methylimidazolium + cation (C4 mim ) shown in Fig. 3.1. The force field developed by Canongia Lopes et al. is based on the OPLS-AA/AMBER framework in which the torsion energy profiles of the alkyl-side chain are fitted to ab initio calculations.164 Hunt found an enhanced rotation of the butyl-side chain for 1-butyl-3-methylimidazolium ionic liquids compared to 1-butyl-2,3-dimethylimidazolium ionic liquids and attributed the increased melting point of the C2-methyl substituted compounds to this observation.60 These two selected examples illustrate the relevance of accurate torsion energy profiles for an investigation of + ionic liquids. Therefore, the relative energy of the different C4 mim conformations was validated.
+
Figure 3.1.: Ball-and-stick model of the investigated C4 mim conformers.
The obtained energies of the HF and the MP2 approach differs significantly, see table 3.2, highlighting the role of dispersion forces. While the energy gap for all conformers to C4 mimI is below 5 kJ/mol for the MP2 approach, it is increased to more than 10 kJ/mol for the HF approach. Furthermore, the stablest structure is C4 mimI for the HF approach instead of C4 mimIII as in the MP2 reference. All investigated exchangecorrelation functionals without an empirical dispersion correction show the same false
22
3.2. Validation of Kohn–Sham density functional theory trend observed in the HF approach. No significant improvement is observed by including the exact Hartree–Fock exchange or kinetic-energy density terms in the functional. Overall, the PBE functional is the best, if still very bad, choice of the non-dispersion corrected methods. In contrast to this, the DFT-D or the DCACP approach improves the accuracy of Kohn–Sham density functional theory remarkably, see table 3.2. The mean absolute deviation (MAD) is decreased below 2 kJ/mol which is within the error range of the reference method. Furthermore, C4 mimIII is obtained as the stablest structure in all dispersion corrected approaches. Especially, the BLYD-D and the BP86DCACP can be recommended of the two empirical dispersion corrected approaches.
Table 3.2.: Comparison of different approaches for the relative energy of conformers of + C4 mim compared to C4 mimI . MAD is the mean absolute deviation to the MP2 values. All values are given in kJ/mol.
HF BP86 PBE BLYP TPSS B3LYP PBE0 BP86-D PBE-D BLYP-D TPSS-D B3LYP-D BP86DCACP PBEDCACP BLYPDCACP MP2
C4 mimII 3.4 2.6 2.3 3.6 2.3 3.0 2.0 0.6 1.1 1.5 0.4 1.3 2.4 2.4 3.2 2.6
C4 mimIII 1.7 1.1 0.6 1.7 1.4 1.3 1.7 −2.7 −2.0 −2.2 −2.3 −2.3 −1.8 −1.0 −1.1 −3.2
C4 mimIV 13.2 10.6 9.4 11.5 10.9 11.1 13.2 1.4 3.1 2.1 2.3 1.9 3.4 5.2 4.2 1.7
MAD 5.7 4.4 3.9 5.2 4.7 4.8 5.7 0.9 1.4 0.8 1.2 0.8 1.1 2.0 1.7 —
23
3. Assessment of Kohn–Sham density functional theory for ionic liquids
3.2.3. Counter ion pair data set The second data set consists of the different ion pair conformations of 1-butyl-3-methylimidazolium dicianamide ([C4 mim][DCA]) shown in Fig. 3.2. Dispersion forces have a significant influence on interaction energy and equilibrium distance of a counter ion pair, see section 2.2. Interestingly, dispersion forces change the liquid structure of water in ab initio molecular dynamics simulations165, 166 even though there are no typical features for dispersion interactions like π-π-stacking in water, as opposed to ionic liquids. Furthermore, Emel’yanenko et al. compared the enthalpy of formation of [C4 mim][DCA] obtained by experiment and calculations.21 They found a good agreement between experimental (363.4±2.7 kJ/mol) and calculated results employing the G3MP2 method (359.6 kJ/mol) while the B3LYP functional (345.5 kJ/mol) underestimates the enthalpy of formation significantly. Therefore, a validation of Kohn–Sham density functional theory for counter ion pairs is necessary for a reliable liquid structure from ab initio molecular dynamics simulations as well as accurate thermodynamic data of ionic liquids.
Figure 3.2.: Ball-and-stick model of the investigated [C4 mim][DCA] ion pair conformations.
The HF approach underestimates the counter ion pair dissociation energy on average by more than 10% highlighting again the importance of dispersion forces in ionic liquids, see table 3.3. The BLYP functional shows a comparable error to the reference values like HF while the performance is improved for all other non-dispersion corrected approaches. However, the average deviation to the reference values is still more than 15.0 kJ/mol for the best eligible non-dispersion corrected functional PBE0. Similar to the data set of section 3.2.2, the reliability of Kohn–Sham density functional theory is not improved significantly by including the exact Hartree–Fock exchange in the functional. More important is the consideration of dispersion forces by an empirical dispersion correction. The error of the BLYP-D functional is within the accuracy of the reference calculations. The
24
3.2. Validation of Kohn–Sham density functional theory mean absolute deviation of the most reliable DCACP approach, BP86DCACP , is larger than for the BLYP-D approach but it is still below 5.0 kJ/mol.
Table 3.3.: Comparison of the ion pair dissociation energy of [C4 mim][DCA] for different approaches. MAD is the mean absolute deviation to the MP2 values. All values are given in kJ/mol.
HF BP86 PBE BLYP TPSS B3LYP PBE0 BP86-D PBE-D BLYP-D TPSS-D B3LYP-D BP86DCACP PBEDCACP BLYPDCACP MP2
IPI 321.1 331.0 340.8 324.4 332.0 329.8 341.0 354.7 357.5 350.5 356.5 353.3 353.2 347.2 343.5 348.1
IPII IPIII 317.8 315.2 329.2 323.9 339.3 331.9 322.0 317.4 330.0 326.4 327.4 323.2 339.6 334.4 354.4 357.5 356.9 356.8 350.1 353.4 355.3 358.0 352.9 355.6 355.5 350.6 347.8 344.8 344.7 341.6 349.1 353.2
IPIV 313.5 321.1 331.3 314.3 321.4 319.8 333.8 356.7 356.3 351.6 357.1 355.0 349.6 343.3 340.1 354.3
IPV MAD 317.4 35.7 327.2 26.2 338.3 16.4 319.5 33.2 328.1 25.1 325.5 27.6 338.4 15.3 360.5 4.1 361.0 5.0 357.0 1.6 361.3 4.9 361.9 3.0 355.8 4.4 346.8 6.7 345.9 9.5 358.8 —
3.2.4. Ionic liquid – solute data set The last data set consists of two reactants of a Diels–Alder reaction interacting with 1ethyl-3-methylimidazolium dicianamide ([C2 mim][DCA]), see Fig. 3.3. While cyclopentadiene is a typical compound for π-π-stacking and van der Waals interactions, methylacrylate can form hydrogen bonds with ionic liquid ions, too. Thus, the selected compounds are representative examples for uncharged organic solutes in ionic liquids possessing characteristic possible interaction sites for ionic liquid ions. Furthermore, the Diels–Alder re-
25
3. Assessment of Kohn–Sham density functional theory for ionic liquids action in ionic liquids was investigated by several computational and experimental studies highlighting the scientific relevance of this reaction for ionic liquids.167–177
Figure 3.3.: Ball-and-stick model of investigated structures of a [C2 mim][DCA] ion pair and cyclopentadiene (DAI ) or methylacrylate (DAII )
The van der Waals forces have an enormous contribution to the relaxed interaction energy. It is reduced at about 80% for DAI employing HF instead of MP2, see table 3.4. The HF energy is decreased only at about 30% compared to the MP2 reference for DAII . Furthermore, the differences of the obtained equilibrium structures are impressive, see table 3.5 and Fig. 3.4. In DAI , cyclopentadiene and the imidazolium plane are much closer to each other for the MP2 reference than for the HF approach. This is not unexpected because the major contribution of the interplay stems from π-π-stacking, a typical interaction induced by dispersion forces. Not only in DAI , but also in DAII , a significant deviation is observable for the equilibrium structure of HF and MP2. Methylacrylate and dicyanamide are oriented parallel to each other for MP2 while they are arranged nearly perpendicular for HF in DAII , see Fig. 3.4. Please note, that the initial guess of the structure optimization cycle was the MP2 optimized structure for the HF calculations of DAII . Therefore, the significant differences can be attributed solely to the employed method. Similar deviations of structure and interaction energy are obtained for all non-dispersion corrected approaches, see table 3.5, while the mean absolute deviation (MAD) of nearly all DFT-D approaches is within the error of the reference calculations, see table 3.6 and 3.7. Also BP86DCACP can be recommended for an investigation of the Diels–Alder reaction in ionic liquids.
26
3.2. Validation of Kohn–Sham density functional theory
Table 3.4.: Comparison of the adiabatic interaction energy of a [C2 mim][DCA] ion pair with cyclopentadiene (DAI ) and methylacrylate (DAII ) for different approaches . MAD is the mean absolute deviation to the MP2 values. All values are given in kJ/mol.
HF BP86 PBE BLYP TPSS B3LYP PBE0 BP86-D PBE-D BLYP-D TPSS-D B3LYP-D BP86DCACP PBEDCACP BLYPDCACP MP2
DAI −8.9 −6.6 −16.6 −5.7 −10.2 −9.0 −16.4 −46.6 −42.9 −43.2 −47.0 −39.5 −46.6 −34.3 −40.3 −45.5
DAII MAD −28.5 24.6 −22.2 28.9 −31.3 19.3 −23.0 28.9 −25.2 25.4 −23.7 26.9 −27.1 21.5 −39.8 1.2 −40.6 1.5 −40.1 1.6 −42.1 1.3 −42.6 3.8 −47.2 3.7 −33.2 9.5 −37.7 4.3 −41.0 —
27
3. Assessment of Kohn–Sham density functional theory for ionic liquids
Table 3.5.: Comparison of intermolecular distances r of a [C2 mim][DCA] ion pair with a reactant of the Diels-Alder reaction for different approaches without an empirical dispersion correction. MAD is the mean absolute deviation to the MP2 values. All values are given in pm.
BP86
PBE
BLYP
rC1−C4 rN 2−C5 rC2−C6 rC3−C7 rN 1−C8
413 401 415 431 428
402 384 391 409 414
434 417 435 459 457
rN 1−C3 rC1−O1 rN 2−C4 rC2−C5 rN 3−C6 MAD
353 492 597 701 779 161
351 492 578 683 742 145
359 504 608 715 791 178
TPSS DAI 426 411 427 448 444 DAII 353 480 581 672 746 159
B3LYP
PBE0
HF
MP2
416 400 413 432 431
394 379 387 402 405
428 420 449 467 451
346 331 329 336 346
354 515 630 748 828 177
351 504 618 730 810 158
361 511 607 758 844 190
338 321 319 335 397 —
Figure 3.4.: Comparison of the obtained geometries for DAI and DAII employing the HF (red), MP2 (blue), B3LYP (magenta), BLYP-D (yellow) and BP86DCACP (green) approach
28
3.2. Validation of Kohn–Sham density functional theory
Table 3.6.: Comparison of intermolecular distances r of a [C2 mim][DCA] ion pair with a reactant of the Diels-Alder reaction for the DFT-D approach. MAD is the mean absolute deviation to the MP2 values. All values are given in pm.
BP86-D
PBE-D
rC1−C4 rN 2−C5 rC2−C6 rC3−C7 rN 1−C8
339 327 328 335 341
351 338 339 348 355
rN 1−C3 rC1−O1 rN 2−C4 rC2−C5 rN 3−C6 MAD
334 319 326 332 381 5
337 327 339 345 395 8
BLYP-D DAI 350 338 340 348 353 DAII 339 325 330 342 398 7
TPSS-D
B3LYP-D MP2
338 326 327 334 340
351 339 340 346 352
346 331 329 336 346
334 322 335 337 389 5
335 323 337 337 386 8
338 321 319 335 397 —
29
3. Assessment of Kohn–Sham density functional theory for ionic liquids
Table 3.7.: Comparison of intermolecular distances r of a [C2 mim][DCA] ion pair with a reactant of the Diels-Alder reaction for the DCACP approach. MAD is the mean absolute deviation to the MP2 values. All values are given in pm.
BP86DCACP
30
rC1−C4 rN 2−C5 rC2−C6 rC3−C7 rN 1−C8
363 356 363 367 366
rN 1−C3 rC1−O1 rN 2−C4 rC2−C5 rN 3−C6 MAD
337 328 349 350 405 19
PBEDCACP DAI 365 359 367 372 369 DAII 344 335 335 351 409 21
BLYPDCACP
MP2
374 368 373 374 373
346 331 329 336 346
338 333 357 388 478 36
338 321 319 335 397 —
3.2. Validation of Kohn–Sham density functional theory
3.2.5. Summary of data sets The results of all data sets highlight the important role of dispersion forces for ionic liquid systems. The error of common GGA, mGGA and hybrid functionals (MADBP 86 : 20.2 kJ/mol; MADBLY P : 23.9 kJ/mol; MADT P SS : 19.0 kJ/mol; MADB3LY P : 20.6 kJ/mol) is comparable to Hartree–Fock calculations (MADHF : 24.5 kJ/mol). Exceptions are only the PBE (MADP BE : 13.2 kJ/mol) and the PBE0 (MADP BE0 : 13.2 kJ/mol) functional for which a significant improvement can be observed compared to Hartree–Fock. Reliable results can be obtained if empirical dispersion corrections are employed in the Kohn–Sham density functional calculations like DFT-D (MADBP 86−D : 2.6 kJ/mol; MADP BE−D : 3.2 kJ/mol; MADBLY P −D : 1.4 kJ/mol; MADT P SS−D : 3.1 kJ/mol; MADB3LY P −D : 2.5 kJ/mol) or DCACP (MADBP 86DCACP : 3.3 kJ/mol; MADP BEDCACP : 5.9 kJ/mol; MADBLY PDCACP : 6.1 kJ/mol). The mean absolute deviation is reduced significantly and is partly in the error range of the selected MP2 reference. Overall, the results are improved marginally by introducing the exact Hartree–Fock exchange as in the B3LYP, PBE0, and B3LYP-D hybrid functionals compared to the corresponding GGA functionals. Therefore, the less time consuming GGA or mGGA functionals are preferable. Especially, the BLYP-D functional can be recommended in combination with the DFT-D approach. Also, the DCACPs for BP86 can be recommended for program packages in which the DFT-D approach is not implemented so far. Similar results were also reported by Izgorodina et al. in 2009 who highlighted the failure of the popular B3LYP functional, too.178 Additionally, Izgorodina et al. found a better performance for recently proposed functionals like M05-2X179 compared to commonly employed density functionals without a dispersion correction.
31
32
4. Structure and dynamics in a protic ionic liquid The structure and dynamics of the protic ionic liquid monomethylammonium nitrate (MMAN) are investigated by Car–Parrinello molecular dynamics simulations including a dispersion correction validated in chapter 3. Similarities and differences of MMAN compared to water and imidazolium-based ionic liquids are discussed. Parts of this chapter were published in J. Chem. Phys., 2010, 132, 124506 (publication 13).
Figure 4.1.: Ball-and-stick model of one MMAN ion pair with labels used throughout this chapter. The vector ~vCN 1 as well as the normal vector ~nanion of the anion plane are depicted as well.
4.1. Monomethylammonium nitrate — a protic ionic liquid One possible subset of ionic liquids are protic ionic liquids which are formed through the proton transfer from a Brønsted acid to a Brønsted base.180 As a result, protic ionic liquids possess a proton-donor and -acceptor site which can participate in a hydrogen
33
4. Structure and dynamics in a protic ionic liquid bond network. However, depending on the compounds present, the proton transfer may be incomplete and as a result, a mixture of two neutral liquids may be encountered. Therefore, MacFarlane and Seddon suggested 1% neutral species in the liquid as an upper limit for a protic ionic liquid.181 Another criterion to distinguish between ionic liquids and ionic-neutral mixtures is reflected in the classical Walden rule which relates the ionic mobility (represented by the equivalent conductivity) to the fluidity of the medium.182 Angell and coworkers observed that the difference between protic ionic liquids and aprotic ionic liquids vanishes in the Walden plot if ∆pKa exceeds the value of 10.183 Numerous applications of protic ionic liquids as solvents, energetic materials and electrolytes were published in the last years.123, 125, 167, 176, 184–200 Some features are unique like the high dielectric permittivity of some ammonium based ionic liquids,195 but protic and aprotic ionic liquids also share properties which are far from being understood. The fundamental understanding of ionic liquids is achieved easier with a compound which possesses a simple molecular structure because numerous complications are eliminated thereby. Especially, the protic ionic liquids investigated by P. Walden in 19144 possess virtually the simplest molecular structure of all known ionic liquids. Hence, these ammonium based protic ionic liquids provide an excellent starting point for fundamental research on ionic liquids by ab initio molecular dynamics (AIMD) simulations. AIMD simulations provide an optimal description of induction forces which play a significant role in ionic liquids, see section 2.2. Furthermore, important dispersive forces can be included by dispersion corrected approaches with which reliable results can be obtained, see section 3.2.5. Among the several substances investigated by Paul Walden is monomethylammonium nitrate (MMAN)4 which was selected for the following study of a protic ionic liquid. Previous AIMD simulations focused on imidazolium-based ionic liquids.74, 80, 81, 201–210 One further study investigated a hypothetical ionic liquid consisting of a silver-ethylene complex and tetrafluoroborate.211 Also AIMD simulations of water tetramethylammonium fluoride mixtures were reported.212 All previous AIMD simulations did not employ a dispersion corrected Kohn–Sham density functional theory approach.
4.2. Liquid structure of monomethylammonium nitrate Previous studies of the MMAN structure focused on the two different solid states.213–215 Raman spectra of the solid showed significant interactions of the anion with the ammo-
34
4.2. Liquid structure of monomethylammonium nitrate nium group as well as the methyl group of the cation.216 Hydrogen bonds between O and H1 were also detected.216 The following section will highlight structural features of the liquid state of MMAN.
4.2.1. Structure of counter ions Each cation shares two equidistant anions as nearest neighbors and vice versa in the crystal structure of MMAN.214 The question is whether or not this order breaks down after melting. Hints of a significant change between the solid and the liquid state of MMAN were given by NMR measurements of Wasylishen.217 The author found that the rotation of the anions about the C3 axis (~nanion ) is twice as fast as the end-over-end rotation of this symmetry axis in the solid state of MMAN while in the liquid state the end-over-end rotation of the anions C3 axis is faster than the rotation about this axis. The first insight into the liquid structure can be gained from radial pair distribution functions (RDF) which give the probability to find a particle at a certain distance from another reference particle and, therefore, contain the information of the average nearest neighbors distance. Approximately seven oppositely charged ions can be found in the first solvation shell (up to 600 pm) of one ion if the RDF between the center of masses is considered, see Fig. 4.2. Thus, MMAN does not consists of isolated ion pairs. 55 % (approximately four) of the anions in the first solvation sphere around the cation stay closer to the ammonium group than to the methyl group of the cation. Such a distribution is reasonable because a higher positive charge on the ammonium group than on the methyl group of the cation can be expected. Anions close to the ammonium group are situated most likely in an area at the direct elongation of an N-H1 bond, see Fig. 4.3 in which the spatial distribution function (SDF) of the counter ion mass centers is given. The SDF can be viewed as three dimensional version of the given RDF. Thus, the ammonium group contact shows directionality like a traditional hydrogen bond. In contrast, anions close to the methyl group are only slightly localized along the C-H2 bond showing no hint of a typical directional hydrogen bond. The orientation of the ions to each other characterize also the liquid structure. The deviation of the observed to the statistical angle distribution Γ(βi ) can be obtained by: Nobsv (βi ) Γ(βi ) = = Nstat (βi )
Nobsv (βi ) · sin(βi ) ·
n P
sin(βi )
i=1
n P
(4.1)
Nobsv (βi )
i=1
35
4. Structure and dynamics in a protic ionic liquid
Figure 4.2.: Center of masses RDF of cation and anion (black), cation and cation (red) as well as anion and anion (blue). Additionally, the RDF of the geometric centers of the cation and anion is given (green). The inset depicts the average number of counter ions within the solvation shell of an ion in dependence of the distance between the center of masses.
Figure 4.3.: SDF of the anion center of mass around the cation (cutoff: 600 pm between the center of masses) at 3.0 ppm (yellow) and 10.0 ppm (pink)
36
4.2. Liquid structure of monomethylammonium nitrate Nobsv (βi ) is the number of configurations with angles in the selected angle interval observed in the simulation while Nstat (βi ) is the number of configurations with angles in the selected angle interval of a statistical distribution. Nstat (βi ) takes account of the cone correction n n P P (1/ sin β) and contains a normalization factor ( sin(βi )/ Nobsv (βi )). A value of larger i=1
i=1
than one for Γ(βi ) means preferred orientations whereas a value of smaller than one means a deficiency of orientations. The angular distribution equals the statistical distribution for a value of one. Thus, this conditional distribution Γ(βi ) shows the agglomeration or the deficiency of certain angles weighted by the statistical occurrence. The ~vCN 1 vector of a cation and the normal vector ~nanion of the plane defined by the three oxygen atoms of an anion prefer a parallel orientation to each other, see Fig. 4.4, which means that the plane of the anion arranges perpendicular to the cation C-N1 bond. In order to gain insight into the influence of the functional groups of the cation, the ion pairs (see section 4.3.1 for a discussion of the selected criterion) are divided into three subclasses in the following investigation: • Ion pairs at least connected by one hydrogen bond (IPHB , green) according to a hydrogen bond distance cutoff criterion of 350 pm between the hydrogen bond donor atom and acceptor atom as well as a hydrogen bond angle cutoff criterion of 30◦ for the angle α enclosed by the vector from the hydrogen bond donor atom to the connecting hydrogen atom ~vN 1H1 and the vector of the connecting hydrogen atom to the hydrogen bond acceptor atom ~vH1O , see Fig. 4.5b for an illustration of α. The selection of these cutoff criteria are discussed in section 4.2.2. • Ion pairs without a hydrogen bond and with the anion being closer to the ammonium group (IPNH3 blue). • Ion pairs without a hydrogen bond and with the anion being closer to the methyl group (IPMe , red) Obviously, the strongest parallel arrangement of ~vCN 1 and ~nanion appears for IPHB , see Fig. 4.4. If one assumes that there is an almost continuous network for more than one counter ion pair, it follows that hydrogen bonding enhances the like ion orientation which will be discussed in section 4.2.3.
37
4. Structure and dynamics in a protic ionic liquid
Figure 4.4.: Distribution Γ(βi ) of the angle between the ~vCN 1 vector of a cation and the normal vector ~nanion of the plane defined by the three oxygen atoms of the anion. Both ions are separated by at most 600 pm regarding the center of mass. IPHB : ion pairs are connected via hydrogen bonds (green); IPNH3 : anion is closer the ammonium group than the methyl group (blue); IPMe : anion is closer to the methyl group (red) than the ammonium group.
38
4.2. Liquid structure of monomethylammonium nitrate
4.2.2. Hydrogen bonds The important role of hydrogen bonding is recognized for ionic liquids. For example, hydrogen bonds can depress the melting point and alter the viscosity of imidazolium-based ionic liquids, see section 2.1. Additionally, it was suggested that hydrogen bonds play an important role for the unusually high dielectric permittivity of protic ionic liquids.195 Furthermore, the ability to form and break hydrogen bonds can influence chemical reactions in ionic liquids like the Diels–Alder reaction.168, 173, 175–177, 218, 219 Previous studies of the similar protic ionic liquid monoethylammonium nitrate pointed to a three dimensional hydrogen bond network.124, 220, 221 Therefore, the following section study to what extend hydrogen bonding takes place in MMAN. Hydrogen bonds in MMAN are only possible between counter ions and not between equally charged ions because one ion possess only hydrogen bond donors (cation) or acceptors (anion). First evidence for hydrogen bonds in MMAN can be gained from the radial pair distribution function (RDF) given in Fig. 4.5a. The O-H1 (blue) and O-N1 (green) function show a well defined structure (significant peaks) which is a typical feature of strong hydrogen bonds. The RDFs of the anion-methyl group atoms (red, yellow) are much less pronounced indicating no or only weak hydrogen bonding.
Figure 4.5.: a: RDF illuminating the possibility of hydrogen bonds. b: Distribution Γ(αi ) of the angle α enclosed by the vector from the hydrogen bond donor atom to the connecting hydrogen atom ~vN 1H1 and the vector of the connecting hydrogen atom to the hydrogen bond acceptor atom ~vH1O .
The distribution Γ(αi ) of the angle α enclosed by the vector from the hydrogen bond donor atom to the connecting hydrogen atom ~vN 1H1 and the vector of the connecting
39
4. Structure and dynamics in a protic ionic liquid hydrogen atom to the hydrogen bond acceptor atom ~vH1O is presented in Fig. 4.5b, i.e., the distribution of the angle selected as cutoff criterion for hydrogen bonds. The directional arrangement by hydrogen bonds is obvious. Γ(αi ) matches the statistical distribution at about 30◦ . Therefore, an angle α of 30◦ was selected as hydrogen bond cutoff criterion. Please note, that the hydrogen bond strength depends significantly on the distance between the hydrogen bond donor atom and hydrogen bond acceptor atom222–224 while a correlation can not be observed for the hydrogen bond angle and hydrogen bond strength.224 Therefore, a hydrogen bond distance cutoff criterion of 350 pm was selected which was proposed by Luzar and Chandler225, 226 and is commonly used in molecular dynamics simulations. Additionally, the RDF of the hydrogen bond donor atom N1 and acceptor atom O has also a value of about one at 350 pm, see Fig. 4.5a. Further evidence of strong directional hydrogen bonds is apparent from the SDFs of the oxygen atoms around the cation as well as the hydrogen atoms around the anion given in Fig. 4.6. The oxygen atoms O show a broad distribution at H2 while they are strongly localized at H1 (Fig. 4.6a). Complementary to this, the H1 atoms are strongly localized near the oxygen atoms (Fig. 4.6b). The H2 atoms are also localized close to the oxygen atoms, but in larger proximity (Fig. 4.6c). This either reflects intra-cation effects or may be a feature of weak hydrogen bonds.227 Therefore, the possibility of such hydrogen bonds can not be ruled out, also by the comparison of the O-C RDF and the O-N1 RDF in Fig. 4.5a and the SDF of C and N1 in Fig. 4.6d. Altogether, strong directional hydrogen bond contacts can only be observed between the anion and the ammonium group of the cation.
Figure 4.6.: a: SDF of O at 20 ppm (yellow) and 60 ppm (pink); b: SDF of H1 at 20 ppm (yellow) and 60 ppm (pink); c: SDF of H2 at 15 ppm (yellow) and 20 ppm (pink); d: SDF of N1 (blue) and C (red) at 20 ppm
The average hydrogen bond contact numbers will be discussed in the following section. While monomethylammonium provides three hydrogen bond donor atoms H1 on the am-
40
4.2. Liquid structure of monomethylammonium nitrate monium group, on average only 1.8 anions are detected to be hydrogen bonded to one cation (cutoff of dN 1O ≤ 350 pm and α ≤ 30◦ ). Either one H1 proton remains unbounded or two H1 protons of the same cation form a hydrogen bond to one anion. The latter can be ruled out for MMAN because only 0.2 % of the contact ion pairs are connected by more than one hydrogen bond. Thus, the cation possesses on average 1.2 (40 %) H1 atoms available for further hydrogen bonds. Interestingly, this constitutes another parallel to liquid water. Besides the rather involved debate on the actual number of hydrogen bonds in water,228, 229 it is clear that water also exhibits free coordination sites in its liquid state. Of course, the number of hydrogen bonds in molecular dynamics simulations reacts very sensitive to the choice of the cutoff criteria.230 Therefore, AIMD simulations of neat water were carried out and the same cutoff criteria as for MMAN were employed to determine the number of free hydrogen bond coordination sites of water. On average 0.39 (20 %) hydrogen bond donor as well as acceptor sites remain unoccupied in water at 300 K which is significant lower than for neat MMAN at 400 K. However, the number of free hydrogen bond coordination sites is temperature dependent for water and increases with increasing temperature.229 Hence, it is questionable to compare these properties of pure water and MMAN as neat water is liquid up to 373 K while MMAN melts at 384 K under atmospheric pressure.231 However, water as well as MMAN are only interesting as solvents in the liquid state. Therefore, it can be concluded that MMAN has on average more free hydrogen bond coordination sites than water.
4.2.3. Structure of like ions The spatial distribution function (SDF) of the cation’s center of mass around another cation exhibits four preferred positions, see Fig. 4.7a. Three of the positions are located close to the methyl group while the last one is situated in front of the ammonium group along the ~vCN 1 vector. Comparison of the like ion SDF with the cation-anion distribution in Fig. 4.3 reveals that these positions are the vacancies of the cation-anion distribution. An analogous observation is obtained for the anion-anion distribution. Neighboring anions prefer the position along the ~nanion vector which is just the empty space of the SDF function of the counter ion atoms, compare Fig. 4.6b-d and Fig. 4.7b. Similarly to the counter ions SDF, the RDFs of like ions show a first minimum at about 600 pm, see Fig. 4.2. These minima at 592 pm (anion-anion) and 593 pm (cation-cation) possess a g(r) value larger than one indicating a division into two subshells for the first solvation shell by like ions.
41
4. Structure and dynamics in a protic ionic liquid
Figure 4.7.: SDF of cations (a) and anions (b) around themselves at 20 ppm, respectively.
The impact of hydrogen bonds upon cation-anion arrangement was shown in section 4.2.1. The question arises whether the influence of the hydrogen bond arrangement reaches from one ion to a neighboring like ion. The cation-cation orientation will be discussed first. Both subshells of the like ions are characterized by different structural features, see angle distribution of the cations given in Fig. 4.8a. The ~vCN 1 vectors of the inner subshell arrange themselves most likely in an angle larger than 90◦ if all cations of this subshell are considered, see red solid line in Fig. 4.8a. The outer subshell is similar except that this solvation subshell resemble more the statistical distribution, i.e. more values are close to one, see red dotted line in Fig. 4.8a. Cation pairs (with one cation being the reference cation of the RDF) connected via one anion, which is hydrogen bonded to both HB of them, are denoted THB C . 47 % of the hydrogen bonded trimeric clusters TC are found in the inner subshell and 53 % of THB C are located in the outer subshell. Interestingly, HB these TC trimers behave differently depending on whether they belong to the inner or to the outer subshell, compare blue straight and blue dotted line in Fig. 4.8a. While ◦ THB C clusters of the inner subshell are arranged such that they hold angles between 50 and 110◦ , the clusters belonging to the outer shell occupy angles larger than 90◦ . As a result, the influence of hydrogen bonding on the overall cation-cation orientation is only pronounced weakly, compare black and green line in Fig. 4.8a. The most significant difference between all cation pairs (black line) and all THB C clusters (green line) in the first like ion solvation shell can be observed below 60◦ . This mutual orientation of two ~vCN 1 vectors is less preferred by THB C clusters.
42
4.2. Liquid structure of monomethylammonium nitrate
Figure 4.8.: Angular distribution Γ(βi ) between the ~vCN 1 vector of two cations (a) and between the normal vectors ~nanion of two anions (b).
Next the distribution of the angle enclosed by the two ~nanion vectors of one anion pair is discussed. The anion pairs in the outer subshell prefer a parallel arrangement slightly, see red dotted line in Fig. 4.8b. The inner subshell behavior is governed by a parallel arrangement as well as a perpendicular configuration, see red solid line in Fig. 4.8b. Opposed to the cation behavior, more anion-anion pairs connected via a hydrogen bonded cation (THB A ) can be found in the inner subshell (59%). Again hydrogen bonds show an inverted impact in the inner subshell and in the outer subshell, compare blue solid line and blue dotted line in Fig. 4.8b. The anions are oriented in a perpendicular manner in the inner subshell while a dominant parallel orientation is observed in the outer subshell. Similar to the cation-cation angular distribution, the impact of hydrogen bonds on the anion-anion orientation in the complete first solvation shell is pronounced weakly. Only a slightly preferred perpendicular arrangement due to hydrogen bonds is visible, compare green line and black line in Fig. 4.8b. As the overall hydrogen bond impact on the cation-cation as well as anion-anion orientation vanishes nearly it is likely that the orientation of the hydrogen bonded like ion pairs plays a negligible role for the high dielectric permittivity observed for similar protic ionic liquids.195 Small relative movements of the ionic charge centers due to stretching or shortening of hydrogen bonds may be another contribution to polarization. Recently, Izgorodina et al. discussed the important role of ionic polarization in imidazolium-based ionic liquids.232 Further investigations seem to be necessary to understand the role of hydrogen bonds for the dielectric permittivity of protic ionic liquids.
43
4. Structure and dynamics in a protic ionic liquid
4.2.4. Nano-scale segregation Nano-scale segregation, also called microheterogeinity, was found in several imidazoliumbased ionic liquids.17–20 Smallest amphiphiles were observed in monoethylammonium nitrate (EAN) which has only a slightly longer apolar chain than MMAN.123–125 The question arises if the apolar chain of MMAN is too short for nano-scale segregation. The preferred locations of the cations near another cation in Fig. 4.7a suggest that small apolar regions within MMAN may be possible. However, almost no peak at short distances can be observed for the C-C RDF, see orange line in Fig. 4.9. Although the first peak of the N1-N1 RDF (blue line) appears later due to the positive charge located at the ammonium group, this peak is much more structured than the C-C peak. This is also the case for the first peak of the N1-C RDF, see Fig. 4.9. These results are in contrast to results of classical molecular dynamics simulations of EAN124 in which a well defined peak in the C-C RDF of the terminal methyl groups can be observed at short distance. Thus, it seems that the methyl group is too short for nano-scale segregation.
Figure 4.9.: RDF of cation-atoms. C-C (orange), N1-C (green) and N1-N1 (blue.)
4.3. Ion pairing and ion dynamics The following section will focus on ion dynamics, e.g., the lifetime of an ion pair or the rotational time of ions. Furthermore, the influence of different functional groups of the cation on ion dynamics is highlighted.
44
4.3. Ion pairing and ion dynamics
4.3.1. Determining ion pair lifetimes Spohr and Patey observed a correlation between ion pairing and charge asymmetry in a recent molecular dynamics simulations study.92 The electrical conductivity initially increases while the shear viscosity decreases if the charge is moved off center. However, conductivity decreases and shear viscosity increases rapidly if the charge asymmetry exceeds a critical value.92 Unfortunately, it is nearly impossible to obtain a comparable value of charge asymmetry for ionic liquids due to the large variety of ions forming ionic liquids. However, the observed correlation between ion pairing and charge asymmetry stress the important role of ion pairing besides e.g. ion size ratios to design ionic liquids with a low shear viscosity.91, 92, 233 It also shows that there is no simple linear relationship between the strength of the ion pairing and macroscopic properties such as the shear viscosity. Therefore, a comparable value for ion pairing will be helpful to design ionic liquids with a low viscosity. A powerful tool to study ion pairing and ion dynamics is the autocorrelation function which was employed successfully to study hydrogen bond dynamics210, 225, 234, 235 as well as ion pair association in the model systems of Spohr and Patey.92 Autocorrelation functions of the following form were used:234 CX (t) =
hhi (t)hj (0)i hhj (0)i
(4.2)
in which hj (0) or hi (t) is one if a selected event can be observed at time t or zero otherwise. The index i and j distinguish between two possible events, e.g. if the starting ion pair conformation is IPHB , then j = IPHB . If the event is ion pairing for i and j, CX (t) represents a measure for the probability that an ion pair is still associated after a selected time t for which the denominator ensures that CC (0) = 1. The subscript X indicates either the intermittent (I) or continuous (C) or a re-associating intermittent (R) version of the function. A continuous autocorrelation function is set to zero after hi (t) equals zero for the first time while an intermittent function allows values of one for hi (t) after hi (t) was zero. The re-associating intermittent function is introduced in order to study different association phenomena. It starts to count only after hi (t) equals zero for the first time. Please note that the lifetime of an ion pair is dependent on the definition of an ion pair. One possibility to select ion pairs is that two counter ions are defined as an ion pair which are in closest distance to each other compared to all other ions. Such a definition of an ion pair seems unreasonable for MMAN because about seven counter ions are situated in
45
4. Structure and dynamics in a protic ionic liquid nearly the same distance of an ion, see Fig. 4.2. Which counter ion should be selected for an ion pair if more than one counter ion are located in the same distance to an ion? A more reasonable criterion is a definition of an ion pair by a cutoff radius in which all counter ions are selected as ion pairs if the distance between the ions is within the radius of the first counter ion solvation shell. Of course, many ions belong to more than one ion pair with such a criterion but it can be expected that all counter ions located in the first solvation shell of one ion influence the solvated ion significant in opposite to counter ions outside the first solvation shell. This is supported by an investigation of Lynden-Bell who showed that the solvent screening of ionic liquids is essentially complete outside the first solvation shell.103 Thus, the first solvation shell criterion distinguishes between weak and strong interacting counter ion associates in contrast to the nearest neighbor criterion for which no significant differences of the physiochemical properties can be observed for defined ion pairs compared to further counter ions of the first solvation shell. Therefore, the first solvation shell criterion was selected to define ion pairs which are separated at most 600 pm regarding the center of mass because the RDF of the counter ions center of mass shows a minimum at this distance, see black line in Fig. 4.2. The center of mass was chosen to determine the position of the ions because a translation is defined as a change of the center of mass. Long living ion pairs exists within the AIMD simulations of MMAN. After 14.5 ps only about 50 % of the ion pairs are dissociated for the first time, see solid black line in Fig. 4.10. Furthermore, 38 % of the dissociated ion pairs recombine while only a small part of 12 % have left the first counter ion solvation shell after 14.5 ps. Long living contact ion pairs were detected in the similar protic ionic liquid monoethylammonium nitrate in which ca. 8 % of the ion pairs exhibit a lifetime larger than 100 ps.185
4.3.2. Ion pair lifetimes depending on initial ion pair conformation In order to gain insight into the behavior of the functional groups, the ions pairs are divided into three subclasses which were already introduced in section 4.2.1, i.e., IPHB (colored green), IPNH3 (colored blue), and IPMe (colored red). The selected subdivision provides additional information about the ion pair dynamics so that the counter ion association can be investigated in dependence of the functional groups of the cation. Ion pairs with IPMe as initial conformations display the shortest continuous lifetime, while those which start from IPHB conformations exist longest according to the continuous function, see red and green solid lines in Fig. 4.10. These results infer more loosely bonded
46
4.3. Ion pairing and ion dynamics
Figure 4.10.: Autocorrelation functions of ion pair associates. Different colors indicate the dependence on the initial conformation. straight lines: continuous function; dotted and dashed lines: intermittent function and re-association intermittent function.
ion pairs as well as a higher partner fluctuations for ion pairs starting from IPMe than for those with the initial conformations of IPNH3 or of IPHB ion pairs. The intermittent functions (dotted lines) decay only to about 90 % of their initial value showing a high degree of ion pair association independent of the initial ion pair conformation. Therefore, the ions of MMAN are trapped in long lived cages of counter ions.
4.3.3. Lifetime of a particular ion pair conformation The CX functions of a particular ion pair conformation without allowing a change of the ion pair conformation are shown in Fig. 4.11 to elucidate the lifetime of an ion pair conformation. The lifetime of these functions is obviously much shorter than the general ion pair lifetime discussed in the previous subsection 4.3.2. The shortest continuous lifetime is obtained for IPHB , see green straight line in Fig. 4.11: After about 0.5 ps, nearly all anions break their hydrogen bond for the first time. IPNH3 hold a lifetime up to 3.5 ps. The longest continuous lifetime appears for IPMe which are continuously associated up to 10.5 ps. This suggests that IPMe keep the best memory of their initial conformation. It is important not to confuse this with the observations of the previous
47
4. Structure and dynamics in a protic ionic liquid subsection 4.3.2. The autocorrelation function of ion pairs were considered there while the autocorrelation function of ion pair conformation is considered here. Contrary to the fast decay of the IPHB conformation function, these ion pairs remigrate fastest into the initial position (see dashed green line in Fig. 4.11). An analogy to the idea of a fluctuating hydrogen bond network225 as assumed for water seems apparent.
Figure 4.11.: Autocorrelation functions CX of ion pairs with the ion pair keeping the start conformation. straight line: continuous function CC ; dashed line: reassociation intermittent function CR ; red: IPMe ; green: IPHB ; blue: IPNH3
4.3.4. Dynamics of the ion pair conformations A clear sign of a memory deficit is provided by considering the conformation dynamics. It is apparent immediately that IPMe exists longer than the other ion pair conformations, compare decay of the straight red line to the green dashed (IPHB ) and the blue dotted (IPNH3 ) lines in Fig. 4.12. According to chemical intuition, the change between two sides (compare green and blue straight line as well as red dotted and red dashed line) proceeds slower than the change between hydrogen bonded and not hydrogen bonded (green dotted and blue dashed line). Furthermore, the transfer to the methyl side occurs faster than the transfer to the ammonium side, see increase of red dashed and red dotted lines in Fig. 4.12.
48
4.3. Ion pairing and ion dynamics
Figure 4.12.: Autocorrelation functions of ion pairs in a certain conformation starting from the announced conformation, see legend.
If at a given time, two particular conformation functions show the same behavior independent of the initial state, a memory loss can be postulated. This phenomenon can be observed for IPMe which start either from the IPMe conformation (red lines in Fig. 4.12) or which begin from the IPNH3 conformation (blue lines in Fig. 4.12), i.e., the red lines and the blue lines match each other at approximately 11 ps. Please note the conjunction of the red and blue functions, i.e. the memory loss of the initial conformation, occurs only 0.5 ps after nearly all anions leave the IPMe state for the first time. Opposed to this, the ion pair conformation dynamics starting from IPHB , which have the shortest continuous lifetime, still miss the other functions at about 14.5 ps and therefore seem more dependent on the initial state.
4.3.5. Conformation memory loss of ion pairs To put the previous observations on solid grounds, a number representing the initial conformation memory within a certain correlation process is introduced. As all information about the initial conformation should be lost if a statistical ratio is reached, the following relation Θkl can be defined as a initial conformation memory function (ICMF): Θkl (t) = 1 −
CI (t)k · Øl CI (t)l · Øk
(4.3)
49
4. Structure and dynamics in a protic ionic liquid Ø is the average number of an ion pair conformation in the liquid and CI (t) are the intermittent autocorrelation functions. The index l corresponds to an autocorrelation function of equation 4.2 with i=j, while the index k is an autocorrelation function of equation 4.2 with i6=j. The total memory deficit of the initial state can be obtained if k includes all states with i6=j. Θkl considers diffusion and is zero if the system shows statistical distribution, i.e., it has lost the memory about the particular initial conformation. Θkl is one if the initial information of the investigated system is still contained in all observed particles at the time t. Because Θkl undergoes statistical fluctuations due to the size of the system, the initial conformation memory loss of the liquid was defined if Θkl is smaller than 0.1, i.e., at least 90% of the investigated ion pairing processes do not depend on their initial conformation. It is obvious from Fig. 4.13 that the ICMF of the IPMe initial conformation decays in a simple manner while the other ICMF of IPHB as well as of IPNH3 are more complicated and might bury more complex processes. The initial conformation memory loss is reached after about 11 ps for IPNH3 as well as for IPMe , see blue and red line in Fig. 4.13a. The decay of the IPMe function (red line) behaves nearly linear, while the decay of the IPNH3 ICMF starts very fast but then slows down between 4 ps and 8 ps until it meets the IPMe function. The ICMF decays slowest for the initial conformation IPHB such that it still depends on the initial conformation after 14.5 ps.
Figure 4.13.: a: Initial conformation memory functions (ICMF) of ion pairs j; b: Initial conformation memory functions starting from i to j.
50
4.3. Ion pairing and ion dynamics The ICMF of two conformations is shown in Fig. 4.13b. Changing the initial conformation from IPNH3 to IPHB results in the fastest decay. The ICMFs starting with a IPMe conformation decay almost equivalently inferring that this functional group has smallest impact on the following conformations and that this process is just governed by simple diffusion. The function describing the IPHB to IPMe change (dark green line in Fig. 4.13b) first decays nearly linear, while after about 10 ps it stays at values between 0.2 and 0.3. This can be interpreted as if some process in MMAN induces a long time memory of the initial ion pair conformation IPHB . Similar to the total IPHB ICMF, this might be explained with a fast fluctuation of hydrogen bonds close to the ammonium group between IPHB and IPNH3 preventing the diffusion of the anions from IPHB to IPMe . Unfortunately, the simulation time is too short to estimate how long this state is preserved in the liquid. However, all other ICMFs of Fig. 4.13b decay to zero long time before most ion pairs are disconnected for the first time, compare Fig. 4.10. Hence, the picture of ions rattling in a long lived cage is supported which was proposed for 1-ethyl-3-methyl-imidazolium nitrate.236 The emerging model contemplates an ion pair which is conserved in a cage because the ion pairs have a long lifetime. However, there are many fluctuations and conformational changes reflected in the short conformation lifetimes and the decay of the ICMFs. Therefore, the ion pair is rattling in a cage, see Fig. 4.14 for an illustration by snapshots. Clusters larger than ion pairs may also be feasible due to the long lifetimes of ion pairs in MMAN. Paul Walden found hints for clusters larger than ion pairs in several ammonium based protic ionic liquids.4 Furthermore, Kennedy and Drummond found larger aggregated ion clusters in several ammonium based protic ionic liquids.237 A recent theoretical investigation of Ludwig has given first hints why clusters consisting of eight cations and seven anions can be mainly found in electrospray ionization mass spectra of the investigation of Kennedy and Drummond.238 Unfortunately, the box size of the MMAN simulations prevents investigations on ion clusters larger than ion pairs.
4.3.6. Rotation of ions Dynamic macroscopic properties of liquids are important for chemical engineering. Unfortunately, AIMD simulations run on a too short time scale to obtain reliable quantities for most easily experimentally accessible properties like the viscosity. However, the short time scale of the rotational dynamics allows the study by AIMD simulations as well as by NMR measurements. Wasylishen investigated the ion dynamics of MMAN at 393 K in
51
4. Structure and dynamics in a protic ionic liquid
Figure 4.14.: Illustration of the ion rattling in long lived cages by snapshots of the MMAN trajectory. While all counter ions of the cation stay in the first solvation shell, a fluctuation of the ion pair conformations can be observed. Same colors correspond to same anions/atoms.
52
4.4. Hydrogen bond dynamics 1986.217 He determined the effective rotational correlation times τef f of selected vectors of the ions by 14 N-NMR and 17 O-NMR measurements. Unfortunately, a direct comparison of his NMR-results and the results of the MMAN simulations is not possible because the temperature in both investigations is different. Nevertheless, the rotational correlation time τ can be obtained from the MMAN trajectory by integrating the rotational time-correlation function Φ(t) over time. Φ(t) is given by:239 Φ(t) = hP2 (~ε(t) · ~ε(0))i
(4.4)
in which P2 (x) is the second Legendre polynomial �~ε is the investigated unit vector. � and η2 Please note, that τef f is related to τ by τef f = 1 + 3 τ . It is assumed in the following discussion that the quadrupole asymmetry parameter η is zero. The rotational correlation time τ of ~vN 2O is larger than of ~nanion in the MMAN simulations which is in agreement with the NMR measurements, see table 4.1. However, the in-plane rotations of the anion relative to the overall rotations of ~nanion at 400 Kelvin (τ~nanion /τ~vN 2O = 0.88) become faster compared to 393 Kelvin (τ~nanion /τ~vN 2O = 0.73). One reason for this observation might be that the activation barrier for hydrogen bond breaking becomes less important compared to the asymmetric shape of the anion. In an in-plane rotation, all hydrogen bonds must break while for the overall rotations of ~nanion one hydrogen bond can be preserved. However, Wasylishen investigated MMAN in which the acidic protons (H1) of the cation were replaced by deuterium. Thus, it can not be excluded that dynamical differences observed in the NMR measurements and the AIMD simulations might originate from this substitution which increases the melting point of MMAN from 384 K231 to 391 K.217 The longest rotational correlation time was found for ~vCN 1 , see table 4.1. Overall, the decay of Φ(t) supports the picture of ions rattling in long lived cages (subsection 4.3.5) because Φ(t) is below 0.1 for all investigated vectors after about 10 ps, see Fig. 4.15. Thus, the anion can rotate rather freely.
4.4. Hydrogen bond dynamics The ion pair dynamics discussed in section 4.3 clearly reveals that the ion pair conformation with the fastest fluctuations (IPHB ) preserves the information of the initial state for the longest duration and not the conformation with the longest continuous lifetime, namely the one initially starting from IPMe conformation. This is counter intuitive, because one expects a quick memory decay from fast fluctuations. In order to study the
53
4. Structure and dynamics in a protic ionic liquid
Figure 4.15.: Rotational time-correlation function Φ(t) of ~vCN 1 (red), ~nanion (blue) and ~vN 2O (green)
Table 4.1.: Calculated rotational correlation times τ from the MMAN simulations (T=400 K) and the effective rotational correlation times τef f from the experimental investigation of Wasylishen (T=393 K; H1-atoms were replaced by deuterium.).217
τ τef f
54
~vCN 1 1.71 3.28
~nanion 1.35 2.45
~vN 2O 1.54 3.34
4.4. Hydrogen bond dynamics time evolution of the hydrogen bond network, four different cases of hydrogen bonding between the same counter ions in relation to the initial conformation were defined. • Ion pairs sharing the same hydrogen atom and oxygen atom as in the initial state (HBHO CA ) • Ion pairs with the same hydrogen atom, but a different oxygen atom as in the initial state (HBH CA ) • Ion pairs keeping the same oxygen but changing the hydrogen atom as compared to the initial hydrogen bond state (HBO CA ) • Ion pairs changing both the hydrogen atom as well as the oxygen atom as compared to the initial hydrogen bond state (HBCA ) There are two kind of hydrogen bonds between different counter ions in relation to the initial conformation: • The hydrogen atom is bonded to a new oxygen atom from a new anion (HBH C) • Ion pairs keeping only the same oxygen atom of the anion but changing the cation as compared to the initial hydrogen bond state (HBO A ). This state might already be occupied at the starting point because one oxygen atom has two hydrogen bond donor sites. Therefore, HBO A will be excluded in the following discussion. All hydrogen bonds break within 0.5 ps, see red line in Fig. 4.16a which shows the continuous autocorrelation function of HBHO CA . However, the reforming is nearly as fast as the breaking, see dark green line in Fig. 4.16a showing the re-associating function CR (t) of HBHO CA . Interestingly, the oxygen atoms of the hydrogen bonds change faster than the hydrogen atoms, compare dark blue and magenta line in Fig. 4.16a. This can be rationalized in terms of one proton siting between two oxygen atoms (see the SDF function in Fig. 4.6b) such that a jump from one state to the other takes place via a very low energy barrier while the acceptor oxygen is located at the direct N1-H1 bond elongation for the same reason because a certain degree of directionality of the hydroge bond is observed. Changing the proton proceeds thus via a higher potential barrier than changing the acceptor oxygen. The interchange of different oxygen atoms from the same anion proceeds too fast to loose the initial information of the hydrogen bonded ion pair conformation. Hence, such an interchange may be one origin of the long time memory observed for the hydrogen bonded ion pair conformation IPHB , see section 4.3.
55
4. Structure and dynamics in a protic ionic liquid Additionally, the hydrogen atom of a hydrogen bond connects to a new oxygen atom from an other anion faster than the hydrogen atom changes between the same ion pair, compare yellow and magenta line in Fig. 4.16a. A bifurcated hydrogen bond240 in which the hydrogen atom is bonded to two oxygen atoms can be ruled out because CI (t) of HBH CA (dark blue line) increases for the first few picoseconds significantly faster than CI (t) of HO HBO CA (magenta line). The fast decay until 3 ps of the ICMF starting from HBCA to HBH CA (dark blue line in Fig. 4.16b) can also be explained by a fast proton hopping between the two neighboring hydrogen bond acceptor sites of the anion. However, the decay of this ICMF stops after about 3 ps. This behavior points to an energy barrier preventing the hydrogen atom from reaching the other hydrogen bond acceptor sites of the anion within 3 ps. The diffusion of the cation or anion may be sufficient fast to reach this third oxygen atom after about 9 ps. The other hydrogen bond ICMFs show nearly linear decay until 9 ps which might be originated in one key process involved in the memory loss of the initial conformation. It is likely that this constitutes the rotation of the cation’s ammonium group. Unfortunately, CI (t) of HBHO CA decays below a value of 0.1 after 9 ps, see light green line Fig. 4.16a. Therefore, all ICMFs are very sensitive to statistical fluctuations after about 9 ps and the significant fluctuations can be attributed to insufficient sampling.
Figure 4.16.: a: Autocorrelation functions of the hydrogen bond association; b: Initial conformation memory functions (ICMF) of hydrogen bonded ion pairs.
56
4.5. Comparison to imidazolium-based ionic liquids
4.5. Comparison to imidazolium-based ionic liquids Analyzing the ion dynamics of MMAN reveals ion associates of two counter ions whose lifetime exceeds the simulation time by far. Thus, the ions are conserved in a cage. However, there are many fluctuations and conformational changes in the first counter ion solvation shell, see Fig. 4.14 for an illustration. Additionally, all investigated rotational correlation times of the ions are below 2 ps. Hence, the ions seem to rattle in a cage of counter ions. Similar properties were also observed for imidazolium-based ionic liquids99, 236, 241, 242 for which a fast hydrogen bond dynamics and rotation of the anions was found in comparison to the lifetime of ions in the first counter ion solvation shell. Furthermore, hydrogen bonds between the cation and anion are established in MMAN similar to imidazolium-based ionic liquids and both liquids possess a fast hydrogen bond dynamics. However, the hydrogen bonds in MMAN show a large degree of directionality, see Fig. 4.5b, 4.6a, and 4.6b, in opposite to imidazolium-based ionic liquids.210, 243
57
58
5. Water in protic ionic liquids A mixture of the protic ionic liquid monomethylammonium nitrate (MMAN) with 1.6 wt % water is investigated from Car–Parrinello molecular dynamics simulations. Structure, polarization, and dynamics of this mixture is compared to neat water and neat MMAN. Additionally, similarities and differences to mixtures of imidazolium-based ionic liquids and water are discussed. Parts of this chapter were submitted recently in a publication (publication 20).
Figure 5.1.: Ball-and-stick model of the investigated molecules with atom labels used throughout this chapter
5.1. Water — A typical impurity of ionic liquids An important topic in ionic liquid research are impurities affecting chemical and physical properties of ionic liquids.244–250 Water is one of the typical impurities in ionic liquids because these low melting salts tend to absorb water from their environment.63, 244, 251 Most of the ionic liquids currently studied are water stable in opposite to the chloroaluminate(III) ionic liquids which were studied most widely in the 80s and 90s.6 However, even small amounts of water can change the properties of ionic liquids significantly.244, 252, 253
59
5. Water in protic ionic liquids The viscosity decrease caused by water is a well-known effect of water impurities in ionic liquids.244, 254–259 Contrary to this, ionic liquids were reported in which water impurities induces gelation.260 Recently, Spohr and Patey have shown with ionic liquid model systems that water tends to replace the counter ions from the ion solvation shell in ionic liquids with small ion size disparity leading to a faster diffusion of the lighter ion-water clusters.261 However, water can increase viscosity of ionic liquids if the ion size disparity is too large or if strong directional ion pairs are found. Spohr and Patey attributed this behavior to extended water-anion chains and strongly bound water-anion-cation clusters.261 One might be anxious that the hygroscopic nature of ionic liquids could limit the usage of ionic liquids as solvents for water sensitive reactions. Especially, the larger molar ratio of water in ionic liquids than in common solvents strengthens this concern. Nevertheless, the interplay of ionic liquids and water might reduce the reactivity of water with other solutes significantly. For instance, PCl3 can be stored in ionic liquids with air contact without any hydrolysis.262 Several further examples of an altered water reactivity in ionic liquids compared to water in organic solvents were reported in the literature.263–267 These experimental results suggest a changed electronic structure of water in ionic liquids. Therefore, water will be an interesting choice to study the influence of ionic liquids on solutes by ab initio molecular dynamics simulations in which, in contrast to classical molecular dynamics simulations, the electronic structure is treated on the fly. While several classical molecular dynamics studies of water ionic liquid mixtures can be found in the literature,258, 268–277 only one AIMD study of one imidazolium-based ion pair solved in water208 and one AIMD study of water tetramethylammonium fluoride mixtures212 were reported so far. Most AIMD studies of ionic liquids focused on neat ionic liquids.74, 80, 81, 202–204, 209, 210, 278 Only a few AIMD studies of solute ionic liquid mixtures were reported up to now.201, 205–207 In the following chapter, the results of Car-Parrinello molecular dynamics simulations of a mixture consisting of 48 monomethylammonium nitrate (MMAN) ion pairs and four water molecules will be presented. Much more studies of water imidazolium-based ionic liquids mixtures than of water protic ammonium-based ionic liquid mixtures were reported.26 However, the water protic ammonium-based ionic liquid mixtures show some interesting features. For instance, previous studies of pure protic ammonium-based ionic liquids and neat water have highlighted similar properties for both liquids.180, 220, 221, 279–281 Additionally, an experimental study of a mixture of water and monoethylammonium nitrate (EAN), a protic ionic liquid similar to MMAN, has shown that both liquids are completely miscible and has suggested an interaction between water and the cation with
60
5.2. Liquid structure a comparable strength as found in the neat liquids.281 Furthermore, water protic ionic liquid mixtures create dielectric environments which resemble those of neat ionic liquids over an appreciable composition range.195 The causes for some unique features of the water protic ammonium-based ionic liquid mixtures are assumed or are still unknown. Therefore, a MMAN water mixture was selected for an investigation by AIMD simulations.
5.2. Liquid structure Previous experimental and computational studies of water impurities in imidazoliumbased ionic liquids indicated that water molecules are isolated from each other and bound to the anion via hydrogen bonds.251, 269 Isolated water molecules were observed in the investigated mixture, too. However, a significant difference between imidazolium-based ILs and MMAN was found. While water in imidazolium-based ionic liquids is more strongly bound to the anion via hydrogen bonds,251, 269 it is connected more strongly to the cation in MMAN. This can be seen in the radial pair distribution function (RDF) of the atoms participating in the hydrogen bond see Fig. 5.2. The RDF contains the information of the average nearest neighbors distance. Experimental and theoretical studies have shown that the distance between atoms participating in a hydrogen bond can be employed to assign the hydrogen bond strength.222–224 As can be seen in Fig. 5.2a and table 5.1, the average distance of nearest neighbors N1 (cation) and O2 (water) is the shortest observed distance between a hydrogen bond donor atom and a hydrogen bond acceptor atom. Surprisingly, this distance is even shorter than the distance between the hydrogen bond donor atom of the cation (N1) and the hydrogen bond acceptor atom of the anion (O1). The same trend can also be observed for the distance between the hydrogen bond acceptor atom and the connecting hydrogen atom, see Fig. 5.2b and table 5.1. Therefore, the strongest hydrogen bonds in MMAN with low water content can be found between a water molecule and a cation. Nitrate is known as one of the anions forming the strongest hydrogen bonds with water for imidazolium-based ionic liquids.251 As the cation is even stronger hydrogen bonded to water than the anion, the nearly tetrahedral solvation structure of water in MMAN is not unexpected, see Fig. 5.3. This hydrogen bond coordination of water in MMAN is a significant difference to the situation in imidazolium-based ionic liquids. In these ionic liquids, water molecules form two hydrogen bonds to the anions, but do
61
5. Water in protic ionic liquids
Table 5.1.: Average distance of nearest neighbors between the hydrogen bond acceptor atom (X) and the hydrogen bond donor atom (Y ) hdX−Y i as well as the distance between the hydrogen bond acceptor atom (X) and the connecting hydrogen atom hdY −H i. The index W indicates intermolecular values obtained for pure water. All distances are given in pm.
hdO2−N 1 i
(H2 O-cat)
hdO1−O2 i
(an-H2 O)
hdO1−N 1 i (an-cat)
279
289
286
hdOW −OW i
(neat H2 O)
hdO2−H1 i
(H2 O-cat)
hdO1−H3 i
hdO1−H1 i (an-cat)
(neat H2 O)
277
175
186
183
179
(an-H2 O)
hdOW −HW i
Figure 5.2.: RDF of hydrogen bond donor atoms Y and hydrogen bond acceptor atoms X (a) as well as hydrogen bond acceptor atoms X and the connecting hydrogen atom (b). Atom labels are shown in Fig. 5.1.
62
5.3. Influence of MMAN on water not interact specifically with the cations.268 Instead, the cations are involved mainly in hydrogen bonds with the anions. As a result, the most acidic hydrogen atom in imidazolium-based ionic liquids can be observed in the position of the green spheres in Fig. 5.3. A tetrahedral solvation structure might be also found in other protic ionic liquids because the strength of the Brønsted acid in this subclass of ionic liquids is much larger than in imidazolium-based ionic liquids. As a result, strong directional hydrogen bonds might be observed for protic ionic liquids which implies a specific (local) packing of the structures. The significant Brønsted acidity and hydrogen bond directionality allow a strong coordination of the cation to water in contrast to imidazolium-based ionic liquids in which the weak hydrogen bond directionality74, 80, 81, 210 might be the most characteristic feature of the loose coordination of water to the cation. Based on these results, it seems questionable whether, in protic ionic liquids, the anion has the same all-dominant influence on hydrophilicity as in imidazolium-based ionic liquids.63, 244, 251 An additional important impact of the cation is to be expected in protic ionic liquids. This is also suggested by an experimental study of Herfort and Schneider.281 They used the Dimroth-Reichardt scale, which is based on the solvatochromic absorption band of the pyridinium N-phenoxide betaine, to estimate the polarity of pure water, pure monoethylammonium nitrate (EAN) and mixtures of both liquids. As the shift of the absorption band wavelength do not differ significantly in all measurements, Herfort and Schneider concluded that the counter-ion interaction in pure EAN is replaced by an interaction of comparable strength between the cation and water in water EAN mixtures. Unfortunately, a systematic study of the cation influence on the hydrophilicity and water solvation is still missing for protic ionic liquids.
5.3. Influence of MMAN on water The reactivity is changed by the solvation of ILs. For instance, the acidity order of HNO3 and H3 O+ is reversed in monoethylammonium nitrate compared to aqueous solution.282 The reason for this and further examples of a changed reactivity of water in ILs is far from being understood. Thus, the following study aims to elucidate how ILs change the molecular and electronic structure of water.
63
5. Water in protic ionic liquids
Figure 5.3.: Spatial distribution function (SDF) of O1 (red), H1 (pink), and N1 (blue) at 70% of the average density. The green spheres illustrate the preferred position of the most acidic proton of imidazolium-based ionic liquids reported by Hanke et al.268
5.3.1. Intramolecular bonds First hints for significantly changed properties of water at the molecular level can be seen in a comparison of the power spectra of neat water and water dissolved in MMAN, see Fig. 5.4. Obviously, the signal of the O-H stretching vibration at 2800 cm−1 – 3500 cm−1 is narrowed and shifted to larger wavenumbers for water dissolved in MMAN compared to pure water at 2800 cm−1 – 3500 cm−1 . This points to a stronger oxygen-hydrogen bond of water in MMAN than in neat water which might inhibit reactions in which the cleavage of this bond plays a role. However, in the course of a reaction, the solvation effects of MMAN on all reactants are important and might cancel each other out. Furthermore, the shift at 2800 cm−1 – 3500 cm−1 indicates that hydrogen bonds between water molecules and anions are weaker than hydrogen bonds in pure water. A comparison of the average distance of nearest neighbors, obtained by the RDF, confirms this because the distance between the hydrogen bond donor and acceptor atom of the water-anion hydrogen bond is increased by 12 pm compared to the water-water hydrogen bond of pure water, see table 5.1. Also, the distance between the hydrogen bond acceptor atom and the connecting hydrogen atom is increased by 7 pm for the water–anion hydrogen bond compared to the hydrogen bonds in neat water. In opposite to the stretching vibrations, the bending vibration of
64
5.3. Influence of MMAN on water water (about 1400 cm−1 – 1800 cm−1 ) shifts toward smaller wavenumbers in the MMAN water mixture. Shifts of the stretching vibrations of water to larger wavenumbers and of the bending vibrations of water to lower wavenumbers are known from typical salts.283 Further differences in the power spectra (300 cm−1 – 400 cm−1 and 700 cm−1 – 1000 cm−1 ) originate from intermolecular vibrations.
Figure 5.4.: Comparison of the power spectra of neat water (blue) and of water dissolved in MMAN (red)
5.3.2. Hydrogen bond network and dynamics The availability of free hydrogen bond donor and acceptor sites as well as the hydrogen bond dynamics are also important for the reactivity of water. Long living hydrogen bonds and few free hydrogen bond coordination sites decrease the ability of water to link to reactants via hydrogen bonds. Furthermore, it is interesting how the hydrogen bond network of water and of MMAN interact with each other since previous studies have pointed toward similar hydrogen bond networks in pure water and in pure protic ammonium-based
65
5. Water in protic ionic liquids ionic liquids.220, 221 However, both liquids have a significant difference: While one water molecule possesses hydrogen bond donor as well as hydrogen bond acceptor sites, an ion of MMAN has either hydrogen bond donor sites (cation) or acceptor sites (anion). Therefore, the hydrogen bond donor sites of water can link only to an anion while the hydrogen bond acceptor sites of water can connect solely to a cation. In the further discussion, the same hydrogen bond cutoff criteria were selected as in the investigation of neat MMAN in chapter 4 which were a distance of 350 pm between the hydrogen bond acceptor and the hydrogen bond donor atom as well as 30◦ for the angle α enclosed by the vector from the hydrogen bond donor atom to the connecting hydrogen atom and the vector of the connecting hydrogen atom to the hydrogen bond acceptor atom, see Fig. 5.5 for an illustration of α. On average, 0.68 (34%) hydrogen bond acceptor sites and 1.17 (59%) hydrogen bond donor sites of water in MMAN were occupied. This seems unexpected at first sight because stronger water-cation hydrogen bonds than water-anion hydrogen bonds suggest misleadingly a stronger occupation of the hydrogen bond acceptor sites of water. However, nitrate has six hydrogen bond linking sites, two free electron pairs at each oxygen atom, while monomethylammonium has only three possible hydrogen bond linking sites. Thus, the anion forms weaker hydrogen bonds with water, but is more flexible than the cation which might contribute significantly to the lower number of free hydrogen bond donor sites than free acceptor sites of water. The hydrogen bond lifetime was calculated by integration of the corresponding continuous autocorrelation function (eq. 4.2) over time, see Fig. 5.5 for an illustration of all obtained hydrogen bond autocorrelation functions. The lifetime of cation-water hydrogen bonds is 65.0 fs while anion-water hydrogen bonds have a shorter lifetime of 54.5 fs. The cation-anion hydrogen bond lifetime of 58.6 fs is between the lifetimes of both water-ionic liquid hydrogen bond types. Thus, the hydrogen bond lifetimes accord with the strength of the hydrogen bonds discussed in section 5.2 and supports the strong interplay of water with the cation in protic ionic liquids in opposite to imidazolium-based ionic liquids. 81 % of the water hydrogen bond coordination sites are occupied in neat water at 300 K. Furthermore, the hydrogen bond lifetime of 146.9 fs is significantly larger than the hydrogen bonds in the MMAN water mixture at 400 K. However, the number of free hydrogen bond coordination sites as well as the hydrogen bond lifetime are temperature dependent for water.229, 284–286 Nevertheless, water as well as MMAN can only be applied as solvents in the liquid state. Thus, following significant differences can be concluded for water in both compounds: Water in MMAN at 400 K has more free hydrogen bond
66
5.3. Influence of MMAN on water donor and acceptor sites as well as a faster hydrogen bond dynamics than neat water at 300 K. Furthermore, the hydrogen bond dynamics at the hydrogen bond donor sites of water in MMAN is slightly faster than at the hydrogen bond acceptor sites in the same mixture. Overall, the hydrogen bond dynamics are comparable for all hydrogen bonds in the investigated water MMAN mixture pointing to a good incorporation of water into the hydrogen bond network of MMAN.
Figure 5.5.: Autocorrelation functions of the hydrogen bonds in the investigated water MMAN mixture at 400 K (solid lines) and neat water at 300 K (dashed line). The ball-and-stick model illustrates the angle α selected as cutoff criterion of a hydrogen bond.
5.3.3. Dipole The electronic structure is also important for the reactivity of a compound besides the intermolecular bond strength or the hydrogen bond dynamics. A significant orbital change affects the reactivity of a compound. Unfortunately, it is difficult to obtain a depiction of one static orbital from a simulation because a simulation is an investigation of a dynamical system so that only average values should be discussed. Therefore, the study of the distribution of quantities influenced by the orbitals seems more reasonable. One such
67
5. Water in protic ionic liquids quantity is the dipole moment which is a physical indicator of the electronic and atomic structure and, thus, sensitive to both electronic polarization and structural relaxation. Local dipole moments of AIMD simulations can be derived on the basis of maximally localized Wannier centers (MLWCs).287–289 First, the MLWCs denoting the center of charge of a two electrons orbital are assigned to the molecules. Subsequently, the dipole moment |µ| of a molecule is calculated according to: v !2 u 3 n m uX X X 2r + q r (5.1) |µ| = t ij
i=1
j=1
k ik
k=1
in which the index i runs over all components (x,y,z) of the molecules dipole vector with n MLWCs and m nuclei of the charge q. The coordinate components rij of the MLWCs and rik of the atoms are the corresponding component of the distance vector between the geometric center of a molecule and the MLWC or nucleus, respectively. Interestingly, the dipole moment of water in MMAN is shifted toward smaller values (depolarization) compared to neat water, see Fig. 5.6. The decreased dipole moment of water in MMAN might contribute to the observed property that water protic ionic liquid mixtures create dielectric environments which resemble those of neat ionic liquids over an appreciable composition range because neat water has a larger relative dielectric permittivity than neat protic ionic liquids.195 Smaller local dipole moments will result in a lower dielectric permittivity if everything else is unchanged. Kelkar, Shi and Maginn suggested a smaller dipole moment of water in imidazolium-based ionic liquids than in neat water before.274 An agreement of the classical molecular dynamics simulations and the experiment could be observed for the excess molar volume and enthalpy of mixing for water imidazolium-based ionic liquid mixtures if the dipole moment of water is decreased compared to force fields developed for neat water. The small dipole moment of water in aprotic as well as in protic ionic liquids surprises because one expects a stronger polarization of a water molecule by ions than by water. However, a water molecule has on average 1.37 more hydrogen bonds per molecule in neat water (3.22 hydrogen bonds per water molecule) than water in MMAN (1.85 hydrogen bonds per water molecule) which seems to explain this unexpected behavior. The important role of hydrogen bonds for the polarization of water can also be observed in the mixture of MMAN and water. Water molecules bonded to a cation with at least one hydrogen bond show an increased dipole moment compared to the total dipole moment distribution, compare orange and red line in Fig. 5.6. Also, water molecules connected at least with one hydrogen bond to an anion show this trend, but less distinctly. This
68
5.4. Influence of water on MMAN might result from the weaker anion-water hydrogen bond compared to the cation-water one which was discussed in section 5.2. Therefore, it seems that the strong directional hydrogen bond network in neat water polarizes a water molecule stronger than a solvent consisting of charged molecules. One reason might be especially for ionic liquids that strong electrostatic screening reduces the effective ion charge.16, 99–103, 290, 291
Figure 5.6.: Dipole moment distribution of neat water (blue), of water in MMAN (red), of water in MMAN for which at least one hydrogen bond connects the water molecule to a cation (orange), and of water in MMAN for which at least one hydrogen bond connects the water molecule to an anion (green). All dipole moment distributions have a resolution of 0.1 D.
5.4. Influence of water on MMAN As discussed in section 5.1 even small amounts of water can change the properties of ionic liquids. The following section will discuss structural, dynamical, and electronic influences of water on MMAN.
69
5. Water in protic ionic liquids
5.4.1. Structure Previous experimental studies have shown that even low water concentrations change the surface structure of hydrophobic imidazolium-based ionic liquids by reorientation of the cations.292, 293 Similar to imidazolium-based ionic liquids, alkyl chains of ammonium-based protic ionic liquids are oriented toward the gas phase.294 In contrast to the imidazolium ring protons being connected rather rigidly to the ring plane, the MMAN cation protons participating in hydrogen bonds can rotate freely around the C-N molecular axis. Therefore, a larger flexibility of the cation for the solvation of water seems reasonable for ammonium-based protic ionic liquids. Furthermore, the interaction is mediated mainly by the anion in imidazolium-based ionic liquids whereas the cation plays a vital role in protic ionic liquids, see section 5.2. Thus, the influence of water on the cation as well as anion structures are elucidated in the following. The differences between the cation-anion RDFs of neat MMAN and the water MMAN mixture are negligible, see Fig. 5.7. A more significant influence of water on the liquid structure can be observed in the angle distribution Γ(βi ) of selected vectors of counter ion pairs and of like ions, see Fig. 5.8, 5.9, and 5.10. Γ(βi ) is the deviation of the observed to the statistical angle distribution which was introduced in section 4.2.1. Please note, that the term ion pair is used for two associated counter ions separated at most 600 pm regarding the center of mass, see section 4.3.1 for a discussion. The ~vCN 1 vector of a cation and the normal vector ~nanion of the plane defined by the three oxygen atoms of an anion of an ion pair prefer an angle to each other which is smaller in the water MMAN mixture than in neat MMAN, compare black lines in Fig. 5.8a. However, the deviations are small and might depend on the type of the ion pair. Therefore, the ion pairs are divided into three subclasses (IPHB , IPNH3 , IPMe ) already applied in chapter 4. The most distinct trend can be observed for IPMe for which water impurities enhance a parallel arrangement, see red line in Fig. 5.8b. IPHB and IPNH3 show various small differences between neat MMAN and the water MMAN mixture which makes comparison of the role of water for the different ion associates difficult. Therefore, the mean value Υ of the difference between Γ(βi ) of neat MMAN (ΓIL (βi )) and the MMAN water mixture (Γmix (βi )) was calculated for a comparison. n P |ΓIL (βi ) − Γmix (βi )| i=1 (5.2) Υ= n Υ provides a general comparable number for the water impact on the orientation of two vectors to each other because Γ(βi ) is statistical weighted.
70
5.4. Influence of water on MMAN
Figure 5.7.: Center of masses RDF of cation and anion (green), of cation and cation (red), as well as of anion and anion (blue) for neat MMAN and the investigated MMAN water mixture
Figure 5.8.: Distribution Γ(βi ) of the angle between the ~vCN 1 vector of a cation and the normal vector ~nanion of the plane defined by the three oxygen atoms of the anion. Both ions are separated by at most 600 pm regarding the center of mass.
71
5. Water in protic ionic liquids Υ for IPHB and IPNH3 is 0.026 which is significantly smaller than Υ for IPMe (0.0381). The similar influence of water on IPHB and IPNH3 can be explained by the fast fluctuation between IPHB and IPNH3 , see section 4.3.5, which prevents the reorientation of the ions due to the directional hydrogen bonds between cations and anions. The slower fluctuation between IPHB and IPMe , see section 4.3.5, allows a stronger directional impact of the hydrogen bonds of water for IPMe than for IPNH3 resulting in the strongest structural influence of water for IPMe . However, Υ is smaller for all ion pairs (0.018) than of each ion pair subclass pointing to a competing influence of the water impurities on the ion pair conformations over the whole range of the angle enclosed by ~vCN 1 and ~nanion . The angle distribution of the cations to each other in neat MMAN prefer to orient in certain values around 0 ◦ , 90 ◦ and 180 ◦ , the angle distribution in the water MMAN mixture increases continuously from parallel to antiparallel orientation, especially for cations in the outer subshell of the first like ion solvation shell of one cation, see Fig. 5.9. As a result, a stronger impact of water can be observed in the outer subshell than for the inner subshell, see table 5.2. Table 5.2.: Υ for the first solvation shell consisting of like ions.
all like ions cation 0.023 anion 0.035
1st subshell 0.024 0.030
2nd subshell 0.030 0.038
In the presence of water, the normal vector ~nanion of one anion is more likely to be parallel relative to ~nanion of an anion in the inner as well as outer subshell of the first solvation shell consisting of like ions, see Fig. 5.10, resulting in a stronger impact of water on the anion-anion orientation than on the cation-cation orientation, see table 5.2. This might be explained by the larger number of directional hydrogen bonds between water and anions than between water and cations (section 5.3.2). Therefore, water affects more the anion orientation than the cation orientation. However, one should be careful with a general conclusion for protic ionic liquids because nitrate possesses two times the number of hydrogen bond acceptor sites than monometylammonium hydrogen bond donor sites. Indeed, only 5.5 % of the cations are connected to water by a hydrogen bond whereas 9.6 % of the anions participate in a hydrogen bond with water. The impact of water should be larger on the cation orientation than on the anion orientation for protic ionic
72
5.4. Influence of water on MMAN
Figure 5.9.: Distribution Γ(βi ) of the angle between the ~vCN 1 vector of two cations.
liquids with the same number of hydrogen bond donor and acceptor sites because the strongest hydrogen bonds can be found between the cation and water, see section 5.2.
5.4.2. Rotation of ions A comparison of rotational time-correlation functions Φ(t) (eq. 4.4) of neat MMAN and the investigated MMAN water mixture is shown in Fig. 5.11. The rotational correlation time τ which can be obtained by the integration of Φ(t) over time increases for the vector ~vCN 1 of a cation and for the normal vector ~nanion of an anion for the MMAN water mixture compared to the neat ionic liquid, see table 5.3. Solely, the rotational time of the vector ~vN 2O of an anion is unaffected by water impurities as the correlation function decays slower below 3.5 ps and faster afterwards. As a result, the anion in-plane rotation (~vN 2O ) and the anion overall rotation (~nanion ) are nearly on the same time scale so that the dynamics of the nitrate ion is more spherical in the MMAN water mixture than in neat MMAN. Table 5.3.: Calculated rotational correlation times τ of neat MMAN and the MMAN water mixture
~vCN 1 MMAN 1.71 MMAN + H2 O 1.92
~nanion 1.35 1.56
~vN 2O 1.54 1.52
73
5. Water in protic ionic liquids
Figure 5.10.: Distribution Γ(βi ) of the angle between the normal vector ~nanion of two anions defined by the plane of the three oxygen atoms of an anion.
Figure 5.11.: Rotational time-correlation function Φ(t) of ~vCN 1 (red), ~nanion (blue) and ~vN 2O (green). dashed line: neat MMAN; solid line: MMAN water mixture
74
5.5. Comparison to imidazolium-based ionic liquids
5.4.3. Electronic structure Impurities like water can affect the viscosity of an ionic liquid significantly or reduce the electrochemical stability window of the ionic liquid.244, 254–259 The question arises if impurities change the electronic structure of the ionic liquid ions and thus, influence properties like the dipole distribution of the ions. The calculated dipole moment of an overall charged molecule is dependent on the selected reference point. Nevertheless, a carefully selected reference point like the geometric center provides comparability. As can be seen in Fig. 5.12, the dipole moment distribution of all ions in neat MMAN and in the investigated MMAN water mixture do not differ significantly. Only the cations in the MMAN water mixture show a slightly increased dipole moment. Mentionable differences of the MMAN water mixture compared to neat MMAN can be observed for ions connected via a hydrogen bond to water for which the anions show a slightly decreased dipole moment while the dipole moment of the cations increases. Therefore, water has a nearly negligible impact on the charge distribution of the anions while a small polarizing influence of water can be observed for the cations.
5.5. Comparison to imidazolium-based ionic liquids Analyzing the trajectory of the protic ionic liquid MMAN with 1.6 wt % water impurities reveals significant differences compared to water imidazolium-based ionic liquid mixtures. The strongest hydrogen bonds and the longest lifetime of a hydrogen bond can be observed between the cation and the water molecules in the investigated mixture while the anions of imidazolium-based ionic liquids are strongest connected to water in water imidazolium-based ionic liquid mixtures.251, 269 Overall, all hydrogen bonds in the water MMAN mixture have a comparable lifetime and strength resulting in a good incorporation of water into the hydrogen bond network of MMAN resulting in a tetrahedral hydrogen bond coordination of water which is a significant difference compared to water in imidazolium based ionic liquids, see Fig. 5.3. Therefore, one might expect a larger dipole moment of water in the investigated mixture compared to neat water due to the good hydrogen bond network incorporation of water and the strongly charged vicinity of the protic ionic liquid. However, the opposite is observed, see Fig. 5.6. The depolarization of water in MMAN as well as in imidazolium-based ionic liquids274 might result from strong electrostatic screening which reduces the effective ion charge.16, 99–103, 290, 291
75
5. Water in protic ionic liquids
Figure 5.12.: Dipole distribution of monomethylammonium in neat MMAN (purple), in MMAN with water impurities (red), and in MMAN with water impurities where at least one hydrogen bond connects the cation to a water molecule (orange). Furthermore, the dipole distribution of nitrate in neat MMAN (cyan), in MMAN with water impurities (blue), and in MMAN with water impurities where at least one hydrogen bond connects the anion to a water molecule (green). All dipole moment distributions have a resolution of 0.1 D. The geometric center of these ions was selected as reference point for the dipole moment calculation.
76
6. Pnicogen bonds This chapter presents an investigation into non-covalent interactions of the phosphorus group. Trends of the pnicogen bond strength as well as the cause for the unexpectedly strong non-covalent interactions will be discussed. Parts of this chapter were submitted recently in a publication (publication 17).
6.1. Bond strength of the non-covalent interaction In the past decades a lot of progress has been achieved in the design of miniaturized systems. For instance, the manufacture of computer chips employing optical technologies, e.g. photo-templating, is well established. However, optical procedures are limited to approximately 50 nm. Alternatively, nanostructures may be formed by means of self assembly systems. Besides the arrangement of the molecular building blocks by hydrogen bonds or inorganic metal-ligand bonds, unexpected strong chalcogen-chalcogen interactions or halogen bonds have captured interest as connectors.295–303 A large number of selective locks and keys increase the variety of possible complex structures. However, the utility of strong nonbonding interactions is not solely limited to the nanoscale. A targeted arrangement of these linkers even allows the design of self-healing rubber-like materials.304 These selected examples illustrate the importance to gain knowledge of directional molecular interactions. Indications for a P–P nonbonding interaction were observed in a 13 C{1 H}–NMR spectrum of a synthesized C2 –symmetric ortho–carbaborane derivative by Bauer et al.,305 see Fig. 6.1. Owing to the low natural abundance of 13 C, only one of both cage carbon atoms is NMR active, which causes a break of the C2 symmetry and renders the phosphorus atoms chemically and magnetically inequivalent. As a result, a sophisticated coupling pattern of higher order can be found in the NMR spectrum, see Fig. 6.1. The marked peaks can be attributed to the P· · · P through-space coupling. In a 13 C{1 H, 31 P}–NMR spectrum the signals coincide to give a singlet verifying this theory. Unfortunately, no evidence for a 1 JP P 0 coupling can be found in a 31 P–NMR spectrum since both phos-
77
6. Pnicogen bonds phorus atoms are magnetically equivalent which results in a singlet. Further examples of P–P nonbonding interaction can be found in previously reported NMR spectra.306–309 One might expect that the coupling may result of a repulsive interaction from the lone pairs of electrons at phosphorus. However, αP 0 C 0 C bond angles in the solid-state structure are 114.1◦ and 116.3◦ indicating an attractive interaction instead of a repulsive one because this angle is decreased compared to the unsubstituted compound. Furthermore, compressed bond angles of 112.2/112.9◦ and 112.1/113.2◦ can be found in similar compounds.310, 311 The indications for an attractive P· · · P interaction are remarkable because no acceptor region for lone pairs of electrons at phosphorus can be envisioned. Sundberg et al. observed hyperconjugation of the lone pair of electrons at phosphorus with the adjacent phosphorus-carbon bond (LPP −→ σP∗ C ) for similar carbaborane compounds by employing a natural bond orbital (NBO) analysis.312 They suggested a stable minimum structure due to the repulsive interaction of the lone pairs of electrons at phosphorus and the attractive hyperconjugation found in the NBO analysis. Further proof for an attractive pnicogen interaction can be found between nitrogen and phosphorus in several compounds.313 In the crystal structure of the ferrocene compound 1a (Fig. 6.2) the distance between N and P is 244 pm which is significantly below the sum of their van der Waals radii of 344 pm. One might argue that this could result from crystal packing. However, a comparison of 1a and 1b shows that 1a is 19.6 kJ/mol more stable than 1b (BLYP-D(RI)/TZVPP) which again indicates an attractive interaction of the pnicogen atoms. The interaction between two phosphorus(III) compounds is investigated for a large variety of substituents at phophorus, see Fig. 6.3, to elucidate trends of the bond strength and the causes of the attractive interaction. The P· · · P distance of all investigated compounds is lower than the sum of the van der Waals radii of phosphorus (380 pm), see table 6.1, which indicates an attractive interplay. Furthermore, the dissociation energy is up to 27.8 kJ/mol, which is comparable to a moderately strong hydrogen bond.240 Two trends in the P–P nonbonding interaction are observed: • An electron-withdrawing group perpendicular to the P· · · P axis seems to decrease the interaction, for example 6 (-CH3 ) −→ 5 (-Br) ≈ 7 (-CCH) −→ 3 (-Cl) −→ 4 (-CN) −→ 2 (-F). • The P–P nonbonding interactions are strongest if a good leaving group like -Br is the substituent along the P· · · P axis, for example 18 (-Br) −→ 6 (-Cl) −→ 22 (-CCH) −→ 12 (-F) −→ 21 (-CH3). An exception are the structures with a
78
6.1. Bond strength of the non-covalent interaction
Figure 6.1.:
13 C{1 H}–NMR
signals of measured (top) and simulated (bottom) spectrum for the shown carbaborane
Figure 6.2.: Ball-and-stick model of the two investigated conformations of compound 1
79
6. Pnicogen bonds hydrogen substituent perpendicular to the P· · · P axis for which the inverse trend can be observed. However, the number of investigated compounds is not sufficiently large enough to draw a general conclusion for the trends of the pnicogen interaction.
Table 6.1.: Distance of the interacting atoms d in pm (dashed line in Fig. 6.3 and 6.9), dissociation energy ED (CBS/CCSD(T)//TZVPP/SCS-MP2) in kJ/mol, NBO delocalization/hyperconjugation energy EN BO of lone pairs of electrons LP into anti-bonding orbitals σ ∗ in kJ/mol and Wiberg bond order BOW of the interacting atoms. Furthermore, interaction energies E in kJ/mol and contributions of interactions p in % of the total attractive (electrostatic + induction + dispersion) interaction energy. Eel /pel : electrostatic; Eind /pind : induction; Edisp /pdisp : dispersion
2 3 4 5 6 7 8 9 10 11 12 13 14 15 16 17 18 19 20
80
d 372 340 328 331 337 314 299 355 326 345 351 317 261 333 326 325 328 309 301
ED EN BO 3.9 5.1 11.5 23.7 9.4 27.4 15.6 36.9 19.9 30.4 15.4 45.4 15.8 85.7 8.8 11.4 7.7 24.3 12.6 21.1 17.9 14.6 13.7 33.5 27.8 220.9 12.9 31.7 10.4 31.0 16.7 48.0 21.3 43.7 16.5 57.6 15.1 88.6
BOW Eel pel Eind pind Edisp pdisp 0.016 −4.0 33.6 −1.2 10.1 −6.7 56.3 0.040 −13.7 38.9 −3.1 8.8 −18.4 52.3 0.038 −9.1 22.5 −8.4 20.8 −22.9 56.7 0.050 −18.7 37.9 −5.6 11.3 −25.1 50.8 0.044 −36.7 54.9 −5.4 8.1 −24.8 37.1 0.059 −32.8 46.1 −7.4 10.4 −31.0 43.5 0.121 −44.9 55.5 −12.3 15.2 −23.7 29.3 0.015 −7.7 34.4 −1.7 7.6 −13.0 58.0 0.045 −8.5 22.4 −8.4 22.1 −21.1 55.5 0.031 −11.4 34.0 −3.4 10.1 −18.7 55.8 0.030 −28.8 55.6 −3.5 6.8 −19.5 37.6 0.060 −32.0 48.2 −6.5 9.8 −27.9 42.0 0.361 −135.4 58.0 −55.3 23.7 −42.7 18.3 0.038 −16.7 39.9 −4.1 9.8 −21.1 50.4 0.039 −10.0 23.0 −9.0 20.7 −24.5 56.3 0.051 −22.8 39.1 −7.2 12.3 −28.3 48.5 0.057 −43.1 54.8 −7.2 9.1 −28.4 36.1 0.067 −37.0 46.2 −9.1 11.4 −34.0 42.4 0.115 −42.6 54.0 −12.2 15.5 −24.1 30.5 Continued on next page
6.1. Bond strength of the non-covalent interaction Table 6.1 – continued from previous page 21a 22 23 24 25 26 27 28a 28b 29 30
d 376 354 301 354 — 303 350 350 344 334 199
ED EN BO 16.9 5.9 19.0 14.9 11.6 4.5 8.8 26.8 16.4 — 14.3 12.7 16.8 — 4.0 3.4 5.5 5.6 13.1 14.5 20.0 24.9
BOW 0.009 0.020 0.011 0.031 — 0.017 — 0.004 0.005 0.019 0.021
Eel −20.1 −27.1 −7.3 −2.9 −7.4 −20.2 −28.1 −2.7 −3.5 −12.5 −32.9
pel Eind 47.5 −2.1 51.6 −3.1 32.4 −0.3 10.8 −6.7 25.0 −4.8 45.5 −2.4 39.1 −19.7 38.6 −0.3 37.6 −0.5 43.1 −1.8 73.9 −4.8
pind 5.0 5.9 1.3 25.0 16.2 5.4 27.4 4.3 5.4 6.2 10.8
Edisp pdisp −20.1 47.5 −22.3 42.5 −14.9 66.2 −17.2 64.2 −17.4 58.8 −21.8 49.1 −24.1 33.5 −4.0 57.1 −5.3 57.0 −14.7 50.7 −6.8 15.3
Figure 6.3.: Ball-and-stick model of investigated compounds with a P· · · P interaction
81
6. Pnicogen bonds A simple relation like a correlation of bond strength with bond length can be excluded, see Fig. 6.4. However, a correlation of bond strength and the distance of the phosphorus atoms can be observed for compound groups which are characterized by the substituent type perpendicular to the P· · · P axis. The strongest dependence of the dissociation energy on the bond length have substituents with a π-bond (-CN, -CCH) while the bond strength of the methyl substituent group is least dependent on the bond length, see Fig. 6.4 and table 6.2. Therefore, one can assume that the observed strong interaction of the pnicogen compounds could arise from an interaction of one phosphorus atom with the substituents perpendicular to the P· · · P axis of the second molecule. To exclude this possibility, further dimers of compound 21a are investigated. The illustration of 21b and 21c in Fig. 6.5 shows that the interaction in these structures is mainly caused by an interaction of the methyl protons with the lone pair of electrons at phosphorus. Thus, the phosphorus-substituent interactions are expected to be most distinct for 21b and 21c. However, 21a shows the largest dissociation energy ED (21a: 16.9 kJ/mol; 21b: 8.0 kJ/mol; 21c: 8.9 kJ/mol). These results verify that the interplay between the pnicogen compounds involves essentially a close contact between both phosphorus atoms which should contribute at least a significant attractive contribution to the interaction energy of both molecules. Table 6.2.: Linear correlation functions ED = m ∗ d + n for compound groups characterized by the substituent type perpendicular to the P· · · P axis.
substituent type m in kJ·mol−1 ·pm−1 hydrogen atom (-H) −0.317 substituents with π-bond (-CN, -CCH) −0.434 halogen atom (-F, -Cl, -Br) −0.260 methyl group (-CH3 ) −0.088
n in kJ·mol−1 110.5 151.2 101.0 49.7
6.2. Cause of the attractive interaction A covalent contribution might be one cause for the significant attractive interaction of the phosphorus atoms which can be investigated by the Wiberg bond order.314 No correlation of bond order and bond strength can be found, see table 6.1. Nonetheless, these
82
6.2. Cause of the attractive interaction
Figure 6.4.: Dissociation energy ED versus distance d of the interacting atoms. The dashed lines illustrate linear correlations of compound groups characterized by the substituent type perpendicular to the P· · · P axis. green: hydrogen atoms; red: substituents with a π-bond; blue: halogen atoms; black: methyl group
Figure 6.5.: Ball-and-stick model of investigated structures of 21
83
6. Pnicogen bonds results indicate a significant difference of 8, 14, and 20 compared to all other investigated compounds: Noteworthy covalent contributions can only be observed for compounds with hydrogen substituents perpendicular to the P· · · P axis whereas the other pnicogen bonds have a bond order significantly smaller than 0.1. This difference might be one reason for previously mentioned inverse trends of 8, 14, and 20 compared to other investigated phosphorus compounds. Unfortunately, these results do not reveal any cause of the attractive interaction of most pnicogen bonds. A possible model for the P–P nonbonding interaction might be a negative hyperconjugation of the lone pair of electrons at phosphorus LPP with the anti-bonding orbital σP∗ 0 X 0 at the adjacent phosphorus and the substituent along the P· · · P axis, see Fig. 6.6 for an illustration. Sundberg et al. found such an interplay between phosphorus atoms312 and the same model was proposed for chalcogen interactions,315 halogen bonds316 and hydrogen bonds.317 To prove this assumption, a natural bond orbital analysis318 was carried out. An increased charge transfer from LPP into σP∗ 0 X 0 is observed for better leaving groups X 0 , compare for example EN BO of 21 (-CH3 ), 12 (-F), 6 (-Cl), and 18 (-Br) in table 6.1. However, the compounds with hydrogen substituents perpendicular to the P· · · P axis are exceptions. Furthermore, the hyperconjugation does not correlate with the bond strength which was also found for chalcogen interactions.319, 320 Therefore, additional interactions must play a role for the pnicogen bonds. Subsequently, the electrostatic potential of halogen, chalcogen and pnicogen compounds (Fig. 6.7) were compared to obtain a hint for interactions which might affect the pnicogen bond strength. An increased σ hole (positive cap) is observed from fluorine (Fig. 6.7i) to iodine (Fig. 6.7l) for the halogen compounds which is in agreement with previous studies.321–323 The two reported arrangements of halogen bonds (see for example 28a and 28b in Fig. 6.9) can be explained in terms of the electrostatic potential.322 In 28a, the XR vector is slightly shifted parallel to the X 0 R0 vector and αRX···X 0 is between 140◦ and 160◦ . In 28b, the positively charged σ hole of one halogen atom is linked to the negatively charged belt of the other one and the angle αRX···X 0 is 90◦ . Please note, that the arrangement in 28a is similar to that observed for all previously discussed phosphorus compounds shown in Fig. 6.3 for which the angle αRP ···P 0 is about 165◦ . The arrangement of chalcogen atoms can also be rationalized by the electrostatic potential on the surface of the monomer. A positively charged belt is found in the plane of the substituents at sulfur, selenium and tellurium (Fig. 6.7f-h), while a negatively charged peak is located above and below this plane. This might explain the preferred conformation of the chalcogen dimers investigated by Bleiholder et al.319, 320 The plot of the electrostatic potential for
84
6.2. Cause of the attractive interaction
Figure 6.6.: Hyperconjugation of the occupied lone pair of electrons at phosphorus LPP with the unoccupied anti-bonding orbital σP∗ 0 X 0 at the adjacent phosphorus and the substituent along the P· · · P axis for 6. The shown natural bonding orbitals were obtained by a natural bond orbital analysis.
phosphorus shows a negatively charged spot at which the lone pair of electrons is expected (Fig. 6.7b). Interestingly, this spot is surrounded by a positively charged region which is small for nitrogen (Fig. 6.7a) while the negatively charged region is much less pronounced for arsenic than for phosphorus, compare Fig. 6.7b and 6.7c. The negatively charged region even vanishes in antimony, see Fig. 6.7d, which might be the reason why no stable dimer with pnicogen interactions can be found for antimony, see structure 25 in Fig. 6.9. The electrostatic potentials of the pnicogen atoms reflect the well-known inert pair effect324 and indicate that the pnicogens can be electron donors as well as acceptors similar to the halogens and chalcogens. However, the narrow positive belt is located very close to the lone pair of electrons and the substituents. Thus, the interaction of a lone pair of electrons with the positively charged belt of a second molecule implies a perturbation of the adjacent lone pair of electrons and repulsion between both lone pairs of electrons is expected. It becomes obvious that the lone pairs of electrons avoid each other if the geometry of the dimers is considered. The angle αRP ···P 0 of ca. 165◦ for the investigated phosphorus compounds is more than 50◦ larger than the tetrahedral angle which is large enough for the lone pairs of electrons to evade each other and small enough for the lone pairs of electrons
85
6. Pnicogen bonds
Figure 6.7.: Electrostatic potential at the isodensity surface with 0.003 electrons for bohr3 N(CF3 )3 (a), P(CF3 )3 (b), As(CF3 )3 (c), Sb(CF3 )3 (d), O(CF3 )2 (e), S(CF3 )2 (f), Se(CF3 )2 (g), Te(CF3 )2 (h), CF4 (i), CF3 Cl (j), CF3 Br (k) and CF3 I (l)
86
6.2. Cause of the attractive interaction to interact with the positively charged belt at phosphorus, see Fig. 6.8. Additionally, the plot of the electron localization function325, 326 (ELF) reveals evading lone pairs of electrons. It seems like the lone pair of electrons has two different interacting sites, one of electrostatic and another one of charge-transfer type, which deforms the lone pair of electrons. Therefore, a large contribution of dispersion forces can be expected additionally to electrostatic interactions for pnicogen bonds.
Figure 6.8.: left: Electrostatic potential at the isodensity surface with 0.017 electrons for bohr3 17; right: Electron localization function (ELF) at the isodensity surface of 0.85 (yellow) and 0.90 (pink) for 17
To prove this assumption, the symmetry-adapted perturbation theory98 (SAPT) was employed. The electrostatic and dispersion forces are of comparable strength while induction forces play a minor role in the phosphorus interaction, see table 6.1. The contribution of induction forces increases with a better leaving group along the P· · · P axis (for example 9 (-F) → 3 (-Cl) → 15 (-Br)), which is in correlation with the charge transfer determined by the NBO analysis. Obviously, electrostatic interactions are mainly responsible for strong pnicogen bonds, see table 6.1. This may be due to an optimal distribution of positively and negatively charged regions at the phosphorus atom. A comparison of the bond strength of different pnicogen atoms reveal that the phosphorus and nitrogen compounds exhibit the strongest interaction, compare ED of 3 (P· · · P) and 23 (N· · · N) with ED of 24 (As· · · As) in table 6.1. The strength of the non-covalent interaction can be increased compared to pnicogen bonds between equal elements if two different pnicogens interact with each other, compare ED of 26 (N· · · P) and 27 (P· · · Sb) with ED of 3 (P· · · P) and 23 (N· · · N) in table 6.1. Nevertheless, one should be caution with a gener-
87
6. Pnicogen bonds alization because only few examples of compounds were investigated in which nitrogen, arsenic or antimony participate in a pnicogen bond.
Figure 6.9.: Ball-and-stick model of investigated structures
Chalcogen interactions (29) show a comparable bond strength to the pnicogen bonds while the dissociation energy of the P–P nonbonding interactions are larger than in the investigated structures with halogen bonds (28a and 28b), see table 6.1. Please note, that this study compares only interacting atoms with same substituents (-Cl). Significantly stronger halogen bonds than in this investigation were reported.327, 328 Interestingly, pnicogen-pnicogen, chalcogen-chalcogen, and the halogen-halogen interactions show a similar involvement of the intermolecular forces, see table 6.1. However, the pnicogen interactions exhibits a significant difference compared to that of halogen or chalcogen. While the strength of the interaction energy increases in the group of halogens and chalcogens,319, 320, 328–330 the pnicogen interaction is strongest for nitrogen and phosphorus. Nevertheless, the pnicogen interactions share many properties with chalcogen or halogen bonds while e.g. hydrogen bonds have a larger proportion of electrostatic forces, see compound 30 in table 6.1. In conclusion, the pnicogen bonds have a comparable strength to moderate hydrogen bonds and might act as a new conceivable molecular linker. The P–P nonbonding interaction can be characterized as follows:
88
6.2. Cause of the attractive interaction • The pnicogen lone pairs of electrons avoid each other and interact mainly with the positively charged belt surrounding the lone pairs of electrons at the pnicogens, see Fig. 6.8. • Both lone pairs of electrons cannot avoid a repulsive interaction completely. This repulsive interplay can be reduced by a better leaving group along the P· · · P bond axis, which allows a larger negative hyperconjugation of the lone pair of electrons into a σ ∗ anti-bonding orbital, see Fig. 6.6 for illustration. Furthermore, the pnicogen bond strength can be increased by an electron-donating group perpendicular to the P· · · P bond axis. As only a small surface area at the pnicogens is left for the positively and negatively charged region, the charge distribution seems to be essential for the strength of the pnicogen bonds. The optimal charge distribution may be at nitrogen and phosphorus for which the strongest interactions in the nitrogen group can be found.
89
90
7. Summary An impressive number of ions can be combined to ionic liquids,1, 2 low melting salts with various fascinating properties. The scope of these compounds was barely recognized until the development of air and water stable imidazolium-based ionic liquids in 1992.5 Since then, the interest in ionic liquids has increased greatly. As a successful tool for the investigation of ionic liquid systems has been proven carefully selected computational approaches which can even predict unnoticed properties of these liquids.22–28 This thesis has combined various static quantum chemistry approaches as well as classical and ab initio molecular dynamics simulations to highlight molecular features of ionic liquids contributing to the fascinating properties of these liquids. It was shown that the substitution of the most acidic proton at the C2-atom by a methyl group in the 1,3-dialkylimidazolium cation decreases the mobility of the counter ion significantly. Thus, the critical displacement, necessary for melting, is connected to a larger activation energy in 1,2,3-trialkylimidazolium-based ionic liquids than in 1,3dialkylimidazolium-based ionic liquids which explains the increased melting point of the C2-methyl-substituted compounds. Furthermore, this example illustrates the validity of the energy landscape paradigm38 for ionic liquids. Based on these results, the intermolecular forces of ionic liquids were compared to a typical salt to study their influence on the potential energy surface. A significant influence of dispersion forces on interaction energy and equilibrium distance was observed for diverse ionic liquids as opposed to a typical salt for which dispersion forces play a negligible role. This results in a shallower energy landscape of ionic liquids compared to typical salts. Therefore, one cause for the low melting point of ionic liquids stems from the important contribution of dispersion forces in the intermolecular interaction. This is supported by a recent investigation which shows that the ratio of total ion pair binding energy to its dispersion component correlates well with the melting point of ionic liquids.107 The study of the intermolecular forces in ionic liquids points to a drawback of ab initio molecular dynamics simulations in which the electronic structure is calculated commonly by Kohn–Sham density functional theory. This approach accounts for electro-
91
7. Summary static, exchange and induction forces very well but fails for the description of dispersion forces.108–113 Therefore, several commonly used density functionals, among them B3LYP, as well as two empirical dispersion corrected approaches were validated. The large error of common functionals matches Hartree–Fock calculations. The accuracy of Kohn–Sham density functional theory calculations is solely comparable to second-order Møller–Plesset perturbation theory calculations if empirical dispersion corrections are employed in the Kohn–Sham density functional theory approach. Hence, dispersion-corrected Kohn–Sham density functional theory approaches are recommended strongly for static quantum chemistry investigations or ab initio molecular dynamics simulation studies of ionic liquid systems. One of the proposed empirical dispersion corrections, which includes the empirical dispersion correction in a dispersion-corrected atom-center dispersion potential, was employed in ab initio molecular dynamics simulations of protic ionic liquid systems. The simulations of neat monomethylammonium nitrate reveal long-lived ion associates of two counter ions whose lifetime exceeds the simulation time by far. Therefore, the ions are conserved in a cage. However, there are many fluctuations and conformational changes in the first counter ion solvation shell. Thus, the ions seem to rattle in a cage of counter ions which was also observed for imidazolium-based ionic liquids.99, 236, 241, 242 Furthermore, the hydrogen bonds in monomethylammonium nitrate show a large degree of directionality, in opposite to imidazolium-based ionic liquids.210, 243 The ab initio molecular dynamics simulations of monomethylammonium nitrate with small water impurities reveal strongest hydrogen bonds and the longest lifetime of a hydrogen bond between the cation and the water molecules. In contrast, the anions of imidazolium-based ionic liquids are strongest connected to water in mixtures of them.251, 269 Overall, all hydrogen bonds in the water monomethylammonium nitrate mixture have a comparable lifetime and strength resulting in a good incorporation of water into the hydrogen bond network of monomethylammonium nitrate. The resulting tetrahedral hydrogen bond coordination of water is a significant difference compared to water in imidazolium-based ionic liquids.269 Hence, one might expect a larger dipole moment of water in the investigated mixture compared to neat water due to the good hydrogen bond network incorporation of water and the strongly charged vicinity of the protic ionic liquid. However, water in monomethylammonium nitrate is depolarized compared to pure water which was also observed for water imidazolium-based ionic liquid mixtures.274 Therefore, strong electrostatic screening might reduce the effective ion charge in protic as well as in aprotic ionic liquids.16, 99–103, 290, 291
92
Furthermore, a non-covalent interaction between elements of the nitrogen group (pnicogens) was characterized. The pnicogen bonds have a comparable strength to moderately strong hydrogen bonds like in pure water and, therefore, might be a suitable new molecular linker. Strong non-covalent bonds can be achieved by a good leaving group along the bond axis as well as an electron-donating group perpendicular to this axis. The attractive interaction is induced mainly by electrostatic interactions of the lone pair of electrons of one pnicogen atom with a positively charged belt surrounding the lone pair of electrons at the other pnicogen atom. However, both lone pairs of electrons are not able to avoid a repulsive interaction. Thus, a significant contribution of dispersion forces was observed in the pnicogen bonds as well.
93
94
A. Computational details A.1. Computational details of section 2.1 A.1.1. Relaxed dissociation energies of table 2.1 The programs provided by the Turbomole331 suite were applied for structure optimization with the second-order Møller–Plesset perturbation theory (MP2) calculations and the TZVPP332 basis set. The resolution of identity approximation333, 334 (RI) was employed in all calculations. Additionally, the frozen core approximation was applied in which all orbitals with an energy below 3.0 a.u. were considered as core orbitals. The convergence criterion was increased to 10−8 Hartree in all calculations. Additionally, all given energies were counterpoise corrected with the procedure of Boys and Bernardi335 in order to account for the basis set superposition errors (BSSEs).
A.1.2. Relaxed dissociation energies of table 2.2 and potential energy surface of Fig. 2.3 The programs provided by the Turbomole331 suite were applied to obtain minimum structures with MP2 and the cc-pVTZ336, 337 basis set. Spin component scaled MP2104 (SCS-MP2) single point calculations were carried out on the optimized structures with the larger aug-cc-pVTZ336, 337 basis set. Several computational studies have shown the remarkable performance of the SCS-MP2 approach compared to CCSD(T) calculations for intermolecular interactions.104–106 All given single point energies were counterpoise corrected with the procedure of Boys and Bernardi335 in order to account for the basis set superposition errors (BSSEs). Additionally, the convergency criterion was increased to 10−8 Hartree in all calculations. MP2 as well as SCS-MP2 calculations were applied in combination with the RI-technique333, 338 and the frozen core approximation in which all orbitals with an energy below 3.0 a.u. were considered as core orbitals.
95
A. Computational details
A.1.3. Classical molecular dynamics simulations The classical molecular dynamics simulations were carried out by Gregor Bruns and Jens Thar with the following setup: Molecular dynamics simulations were performed using the program package GROMACS 3.3.1.339–341 The simulated systems consisted of a cubic box with an edge length of 4520 pm ([C2 C1 mim][Cl]) or 4350 pm ([C2 mim][Cl]) enclosing 343 ion pairs. The systems were equilibrated for 1 nanosecond in the NPT ensemble, using the Parrinello–Rahman coupling scheme.342, 343 Simulations were performed in the NVT ensemble for 10 ns with a timestep of 1 fs and were kept at an average temperature of 460 K, employing a Nose–Hoover thermostat344 with a relaxation time of 1 ps. If available, force field parameters were taken from the work of Liu.345 Missing parameters were complemented by the AMBER all atom force field.346 Explicit electrostatic interactions were considered up to a cut-off radius of 1.2 nm, and, thereafter, approximated by the particle mesh Ewald (PME) method.347, 348 In order to obtain atomic point charges for the force field, structures were optimized using Ahlrich’s TZVP basis set and the general-gradientcorrected PBE functional by the Turbomole program suite. The resolution of identity approximation349, 350 was employed for DFT calculations. Molecular RESP charges were derived from a Hartree–Fock 6-31G(d) single point calculation at the optimized structures using the GAUSSIAN code.351 The RESP charges were scaled by a factor of 0.85. The scaling of partial charges in classical molecular dynamics simulations with nonpolarizable force fields was proposed in the literature.80, 99–101 Scaled charges and geometries are listed in table A.1 and A.2. A density of 1013.76 kg/m3 for [C2 mim][Cl] was obtained at 460 K. Fannin and coworkers reported a density of 1137.8 kg/m3 for [C2 mim][Cl] at 333 K and an extrapolation method for the density at different temperatures.352 The extrapolated density is 1037 kg/m3 which is only 2% above the value of our simulation. Furthermore, the qualitative shape of the spatial distribution function of the chloride anion of [C2 mim][Cl] is in very good agreement with ab initio molecular dynamics simulations. The density of [C2 C1 mim][Cl] was 924.52 kg/m3 at 460 K.
A.2. Computational details of section 2.2 A.2.1. SAPT calculations The programs provided by the Turbomole331 suite were applied for structure optimization with the MP2 method and the cc-pVTZ336, 337 basis set. The MP2 calculations were
96
A.2. Computational details of section 2.2
Table A.1.: Scaled RESP charges in a.u. employed in the classical molecular dynamics simulations of [C2 mim][Cl]. The coordinates of the molecule used in the calcultion of the partial charges are given in pm.
atom x [pm] y [pm] z [pm] q [a.u.] C 0.0497603 25.3195314 −242.4663879 −0.1565730 N 124.0322969 −41.5568599 −183.7261370 0.0839094 C 113.7736643 −9.7452398 −53.4411288 −0.0900244 N −13.0738815 26.3295585 −27.7083545 0.2087511 C −86.0240262 17.0626613 −144.7141509 −0.2149970 C 250.5214827 −84.8092752 −249.8396786 0.0978452 C −65.9214778 65.2850932 103.6256995 −0.3341100 H −191.6444094 41.0498631 −148.9251000 0.2284411 H −17.5173480 −44.5461832 −347.5776560 0.2148460 H 194.5343004 −12.5493056 18.9415577 0.2032650 H 17.7253106 84.7652158 171.5709998 0.1556903 H −125.5197375 156.6201497 92.8986397 0.1556904 H −128.1995166 −15.4876182 144.0645074 0.1556903 H 288.3441215 −170.6736713 −192.6091611 0.0560311 H 322.0399671 −2.0126935 −239.1626711 0.0560311 C 232.1749792 −121.5025227 −396.0069940 −0.2463990 H 329.5142215 −153.3863268 −435.5441377 0.0919708 H 162.4012942 −205.3031412 −409.4057476 0.0919708 H 199.0054889 −35.9951860 −456.5261924 0.0919708
97
A. Computational details
Table A.2.: RESP charges in a.u. employed in the classical molecular dynamics simulations of [C2 C1 mim][Cl]. The coordinates of the molecule used in the calcultion of the partial charges are given in pm.
atom x [pm] y [pm] z [pm] q [a.u.] C 3.2655247 −31.3818178 −239.6520132 −0.166104 N 129.8974625 −37.1045947 −184.0159735 0.011055 C 123.0586169 0.2131502 −53.9601293 0.212477 N −6.3783823 29.7339044 −27.4427705 0.124477 C −82.0177210 10.3322019 −141.6155376 −0.244928 C 255.1496137 −76.3170509 −253.8511056 0.094082 C −58.6521448 72.9743213 102.5806630 −0.234897 H −188.9788155 27.6158589 −143.4571036 0.234232 H −15.9374430 −56.8723261 −343.0497191 0.220398 C 235.9681898 10.7461585 41.4433576 −0.358094 H 2.3838919 154.8488690 142.4878794 0.127465 H −161.0514063 108.9276472 88.3856486 0.127465 H −59.4899437 −11.0164837 173.3078283 0.127465 H 298.6713450 −160.2747084 −197.7154033 0.064037 H 324.3375989 8.8645905 −246.9565544 0.064037 C 233.3628218 −115.6705367 −398.9388950 −0.291212 H 330.6179541 −143.2269532 −441.7915683 0.103353 H 167.3578894 −202.9243352 −408.8286913 0.103353 H 193.6037883 −32.7022333 −458.9892054 0.103353 H 319.4602356 −53.3661232 10.8244207 0.142662 H 273.5368865 114.1968450 47.4859784 0.142662 H 205.1806735 −19.8002826 142.3207488 0.142662
98
A.2. Computational details of section 2.2 applied in combination with the RI-technique333, 338 and the frozen core approximation in which all orbitals with an energy below 3.0 a.u. were considered as core orbitals. The convergence criterion was increased to 10−8 Hartree in all calculations. The symmetryadapted perturbation theory98 (SAPT) calculations were carried out with the aug-ccpVDZ336, 337 basis set employing the MOLPRO353 -program package. The interaction energies obtained by the SAPT approach can be expressed as: 2 2 2 2 1 + Eind−ex + Edisp + Edisp−ex + Eind Etot = Eel1 + Eex
(A.1)
1 Etot is the total interaction energy, Eel1 accounts for electrostatic interaction, Eex results 2 from exchange of electrons of unperturbed monomers, Eind originates from the damped 2 permanent and induced multipole moment interaction, Eind−ex is the additional exchange 2 repulsion due to induction interaction, Edisp originates from damped instantaneous electric 2 multipole moment interaction and Edisp−ex is the additional exchange repulsion due to 98 2 2 dispersion interaction. To obtain the induction forces we add up Eind and Eind−ex . The 2 2 dispersion forces were calculated by summing Edisp and Edisp−ex .
A.2.2. Interaction potential of two ion pairs (Fig. 2.8) The programs provided by the Turbomole331 suite were applied in all calculations. Minimum structures were obtained employing the MP2 method. Furthermore, Hartree– Fock (HF) and spin component scaled MP2104 (SCS-MP2) single point calculations were carried out. The TZVPP332 basis set was used throughout and all energies were counterpoise corrected with the procedure of Boys and Bernardi335 in order to account for the basis set superposition errors (BSSEs). Additionally, the convergence criterion was increased to 10−8 Hartree in all calculations. MP2 as well as SCS-MP2 calculations were applied in combination with the RI-technique333, 334 and the frozen core approximation in which all orbitals with an energy below 3.0 a.u. were considered as core orbitals. Several computational studies show the remarkable performance of the SCS-MP2 approach compared to CCSD(T) calculations for intermolecular interactions.104–106 Please note, that intermolecular interaction energies employing the SCS-MP2 approach tend to underestimate CCSD(T) results. Therefore, the energy difference of SCS-MP2 and HF provides a minimal contribution of dispersion forces in the interplay.
99
A. Computational details
A.3. Computational details of section 3.2 The programs provided by the Turbomole331 suite were applied for the non-dispersioncorrected Kohn–Sham density functional theory, HF and MP2 calculations while the ORCA-program354 was applied for calculations employing the dispersion correction proposed by Grimme (DFT-D134 ). To provide comparability, the VWN-V LDA correlation part of the functional was selected in both program packages. The TZVPP332 basis set was used throughout and all energies were counterpoise corrected with the procedure of Boys and Bernardi335 in order to account for the basis set superposition errors (BSSEs). Additionally, the convergency criterion was increased to 10−8 Hartree for all calculations. MP2 calculations were applied in combination with the RI-technique333, 334, 338 and the frozen core approximation. The frozen core orbitals were attributed by default settings which means all orbitals with an energy below 3.0 au were considered as core orbitals. The CCSD(T) single point calculations on the MP2/TZVPP optimized structures were carried out with the cc-pVTZ336, 337, 355 basis set employing the MOLPRO353 program package. Calculations employing the PBE,148, 149 PBE–D,134, 148, 149 BLYP,117, 118 BLYP– D,117, 118, 134 BP86,117, 150 BP86–D,117, 134, 150 TPSS,151 TPSS–D134, 151 functionals were carried out with the RI approximation.349, 350, 356 The performance of the B3LYP117–119 and the PBE0148, 149, 152 hybrid functional was also investigated. Calculations employing the dispersion correction proposed by Lilienfeld et. al 141 (DCACP) were carried out with the CPMD-program.357 Kohn–Sham orbitals were expanded in a plane wave basis with a kinetic energy cutoff of 70 Ry. Norm conserving pseudo-potentials of the Troullier-Martin type were taken with pseudization radii shown in table A.3.153, 358 Core-valence interaction of all atoms were treated by s,p,d and f-potentials. The pseudopotentials were applied in the Kleinman-Bylander representation359 with the angular momentum as a local potential shown in table A.3. The box length was set to 35.0 bohr in each calculation.
A.4. Computational details of chapter 4 A.4.1. Monomethylammonium nitrate 48 mono-methylammonium nitrate ion pairs were simulated applying periodic boundary conditions with a box length of 1811.5×1976.1×1772.3 pm. All ab initio molecular dynamics simulations were based on the Car–Parrinello method360 and were performed with the CPMD code.357 The general gradient-corrected density functional BP86117, 150
100
A.4. Computational details of chapter 4
Table A.3.: Angular momentum l and pseudization radii r in a.u. of the local potential for the corresponding elements and functionals
lBP 86 H p C d N d O d
rBP 86 lP BE 0.5000 p 0.7159 d 0.6031 d 1.1200 d
rP BE lBLY P 0.3828 p 0.7159 d 0.6031 d 1.1200 p
rBLY P 0.5000 0.7159 1.1200 see ref.153
was chosen and the Kohn–Sham orbitals were expanded in a plane wave basis with a kinetic energy cutoff of 70 Ry. Norm conserving pseudopotentials of the Troullier-Martins type358 from the R¨othlisberger group153, 155 were applied which include a dispersion correction. These pseudopotentials were taken with the pseudization radii listed in table A.4 and were applied in the Kleinman-Bylander representation.359 Table A.4.: Pseudization radii for all angular momenta of each atom type applied in the Car–Parrinello molecular dynamics simulations of MMAN.
s p d
H C N O 0.5000 1.0000 1.1200 1.1200 0.5000 1.0000 1.1200 1.1200 — 0.7159 0.6031 1.1200
In order to obtain a starting structure, Jens Thar performed classical molecular dynamics simulations in the framework of the program package GROMACS 3.3.1339–341 for which the Amber all atom force field was employed.346 Atomic RESP charges were derived from a Hartree–Fock 6-31G(d) single point calculation on one configuration and scaled with a factor of 0.64, see table A.5. Equilibration of the system in the NPT ensemble lasted 1.4 ns with a time step of 1 fs. The average pressure of 1 bar was controlled by a Parrinello–Rahman342, 343 coupling scheme, while Nos´e-Hoover chain thermostats344 as implemented in GROMACS 3.3.1 with a relaxation time of 1 ps maintained the average temperature of 373 K. Explicit electrostatic interactions were considered up to a cut-off radius of 0.8 nm and, thereafter, approximated by particle mesh Ewald summation.347, 348
101
A. Computational details
Table A.5.: Charges in a.u. as used in the classical molecular dynamics simulations of MMAN. The coordinates of the reference structure are given in pm.
atom x [pm] y [pm] z [pm] q [a.u.] N 0.0000 0.0000 0.0000 −0.066560 H 0.0000 0.0000 100.8000 0.155264 C 135.7645 0.0000 −48.0000 0.011968 H 135.7645 0.0000 −153.0000 0.039424 H 187.1005 88.9165 −11.7000 0.039424 H 187.1005 −88.9165 −11.7000 0.039424 H −47.5176 −82.3029 −33.6000 0.155264 H −47.5176 82.3029 −33.6000 0.155264 O 200.0000 0.0000 150.0000 −0.289152 N 200.0000 0.0000 290.0000 0.337984 O 321.2436 0.0000 360.0000 −0.289152 O 078.7564 0.0000 360.0000 −0.289152
For the equilibrium simulations, the system was thermostated at 400 K using Nos´eHoover chain thermostats.344, 361, 362 The equilibration period was carried out for 5.0 ps with Nos´e-Hoover chain thermostats coupled to each ionic degree of freedom. A relaxation period of 1.92 ps followed. Subsequently, the system was simulated in a NVT ensemble with an average temperature of 400.2 K for 19.35 ps. A fictional electron mass of 400 a.u. and a timestep of 0.097 fs was used throughout all Car–Parrinello molecular dynamics simulations.
A.4.2. Water 128 water molecules were simulated applying periodic boundary conditions with a cubic box length of 1564.0 pm. All ab initio molecular dynamics simulations were based on the Car–Parrinello method360 and were performed with the CPMD code.357 The general gradient-corrected density functional BLYP117, 118 was chosen and the Kohn–Sham orbitals were expanded in a plane wave basis with a kinetic energy cutoff of 70 Ry. Recent investigations concluded that dispersion forces have an important impact on structure and density of water.165, 166, 363 Norm conserving pseudopotentials of the Troullier-Martins
102
A.5. Computational details of chapter 5 type358 from the R¨othlisberger group153, 155 were applied to consider dispersion forces. These pseudopotentials were applied in the Kleinman-Bylander representation.359 A fictional electron mass of 400 a.u. and a time step of 0.097 fs was used throughout all CPMD simulations. The starting structure was obtained from a previous CPMD simulation of 128 water molecules without dispersion corrected pseudopotentials. The system was thermostated at 300 K using Nos´e-Hoover chain thermostats.344, 361, 362 The equilibration period was carried out for 1.45 ps with Nos´e-Hoover chain thermostats coupled to each ionic degree of freedom. A relaxation period of 2.90 ps followed. Subsequently, the system was simulated in a NVT ensemble with an average temperature of 299.9 K for 36.96 ps.
A.5. Computational details of chapter 5 All ab initio molecular dynamics simulations were based on the Car–Parrinello method360 and were performed with the CPMD code.357 48 monomethylammonium nitrate ion pairs with four water molecules were simulated applying periodic boundary conditions with a box length of 1811.5×1976.1×1772.3 pm. The general gradient-corrected density functional BP86117, 150 was chosen and the Kohn–Sham orbitals were expanded in a plane wave basis with a kinetic energy cutoff of 70 Ry. Pseudopotentials from the R¨othlisberger group153, 155 were taken with the pseudization radii listed in table A.4 and were applied in the Kleinman–Bylander representation.359 A fictional electron mass of 400 a.u. and a time step of 0.097 fs was used throughout all CPMD simulations. In order to obtain a starting structure, four water molecules were added to the final structure of the Car–Parrinello molecular dynamics simulations of 48 monomethylammonium nitrate ion pairs, see section A.4.1 for computational details of these simulations. For the equilibrium simulations, the system was thermostated at 400 K using Nos´e–Hoover chain thermostats.344, 361, 362 The equilibration period was carried out for 2.75 ps with Nos´e–Hoover chain thermostats coupled to each ionic degree of freedom. A relaxation period of 1.64 ps followed. Subsequently, the system was simulated in a NVT ensemble with an average temperature of 400.1 K for 25.25 ps. The computational details of the ab initio molecular dynamics simulations of neat water and neat MMAN were already presented in section A.4.1 and A.4.2.
103
A. Computational details
A.6. Computational details of chapter 6 The programs provided by the Turbomole331 suite were applied for structure optimization. Structure 1a and 1b were optimized with the BLYP-D117, 118, 134 functional and the TZVPP364 basis set employing the resolution of identity approximation (RI).349, 350, 365 All other minimum structures were obtained employing the SCS-MP2104 approach with the TZVPP364 basis set in which relativistic effects for Sb are considered by a relativistic pseudopotential. SCS-MP2 calculations were applied in combination with the frozen core approximation. The frozen core orbitals were attributed by default settings in which orbitals with an energy below 3.0 a.u. were considered as core orbitals. The symmetry-adapted perturbation theory98 (SAPT) and CCSD(T) single point calculations were carried out with the cc-pVTZ336, 337, 366, 367 basis set employing the MOLPRO353 program package. Additionally, MP2 single point calculations were carried out with the Turbomole331 suite using a cc-pVTZ336, 337, 366, 367 and a cc-pVQZ336, 337, 366, 367 basis set. These basis sets include a relativistic pseudopotential for As, Br and Sb. The MP2 calculations employed the RI technique333, 334, 338 and the frozen core approximation. CCSD(T) and MP2 energies were counterpoise corrected with the procedure of Boys and Bernardi335 in order to eliminate the basis set superposition errors (BSSEs). The convergency criterion was increased to 10−8 Hartree in all calculations. All given dissociation energies ED of chapter 6 were calculated at the CCSD(T)/CBS level. The contribution of higher order correlation energy was determined by the scheme outlined in section 3.2.1. All calculated energies for the basis set extrapolation are listed in table A.6. The Gaussian03351 program was employed for the natural bond orbital analysis318 with the TZVP332 basis set and the second-order Møller–Plesset perturbation theory. The CPMD code357 was used to determine the electron localization function (ELF).325, 326 The LDA-functional was chosen for the wavefunction optimization and the Kohn–Sham orbitals were expanded in a plane wave basis with a kinetic energy cutoff of 200 Ry. Norm conserving pseudo-potentials of the Goedecker type368, 369 were applied in the Kleinman– Bylander representation.359 The box length was set to 22.0 bohr.
104
A.6. Computational details of chapter 6
Table A.6.: Calculated dissociation energies ED of investigated compounds in kJ/mol. All listed energies are single point energy calculations on structures obtained by the SCS-MP2104 approach with a TZVPP364 basis set.
2 3 4 5 6 7 8 9 10 11 12 13 14 15 16 17 18 19 20 21a 21b 21c 22 23 24 25 26 27
MP2 cc-pVTZ cc-pVQZ 1.8 3.4 10.2 14.1 10.9 14.3 15.0 20.1 18.5 21.7 17.6 21.9 14.3 18.1 6.9 9.8 7.9 11.2 10.6 14.7 14.8 17.9 14.3 18.2 21.8 29.9 12.0 16.4 12.8 16.3 17.5 22.9 20.5 24.0 19.7 24.4 14.4 18.1 15.6 17.8 7.1 8.1 7.8 8.9 17.9 20.4 10.4 13.7 8.1 11.6 12.4 17.7 16.5 20.9 13.3 19.3 Continued on
CCSD(T) CBS cc-pVTZ CBS 4.6 1.1 3.9 16.9 4.8 11.5 16.8 3.5 9.4 23.8 6.8 15.6 24.0 14.4 19.9 25.0 8.0 15.4 20.9 9.2 15.8 11.9 3.8 8.8 13.6 2.0 7.7 17.7 5.5 12.6 20.2 12.5 17.9 21.0 7.0 13.7 35.8 13.8 27.8 19.6 5.3 12.9 18.9 4.3 10.4 26.8 7.4 16.7 26.6 15.2 21.3 27.8 8.4 16.5 20.8 8.7 15.1 19.4 13.1 16.9 8.8 6.3 8.0 9.7 7.0 8.9 22.2 14.7 19.0 16.1 5.9 11.6 14.2 2.7 8.8 21.6 7.2 16.4 24.1 6.7 14.3 23.7 6.4 16.8 next page
105
A. Computational details Table A.6 – continued from previous page
28a 28b 29 30
106
MP2 cc-pVTZ cc-pVQZ 3.1 4.3 4.2 5.9 10.7 14.8 18.7 19.7
CBS 5.2 7.1 17.8 20.4
CCSD(T) cc-pVTZ CBS 1.9 4.0 2.6 5.5 6.0 13.1 18.3 20.0
List of abbreviations AIMD
ab initio molecular dynamics
aug-cc-pVnZ
augmented correlation consistent valence n-tuple-ζ basis set
BSSE
basis set superposition error
cc-pVnZ
correlation consistent valence n-tuple-ζ basis set
CBS
complete basis set limit
CCSD(T)
coupled cluster theory including singles, doubles and non-iterative triples
DCACP
dispersion-corrected atom-center dispersion potential
DFT-D
Kohn–Sham density funtional theory with an additive empirical dispersion correction term
GGA
generalized gradient approximation
HF
Hartree–Fock
ICMF
initial conformation memory function (equation 4.3)
MAD
mean absolute deviation
MLWC
maximally localized Wannier centers
MMAN
monomethylammonium nitrate
MP2
second-order Møller–Plesset perturbation theory
RDF
radial distribution function
RESP
restrained electrostatic potential
RI
resolution of identity approximation; also called density fitting
SAPT
symmetry-adapted perturbation theory
107
List of abbreviations SCS-MP2
spin-component-scaled second-order Møller–Plesset perturbation theory
SDF
spatial distribution function
TZVPP
split-valence triple-ζ basis set
108
List of publications Following articles were published in international journals during the dissertation time: 1. J. Thar, S. Zahn, and B. Kirchner; When Is a Molecule Properly Solvated by a Continuum Model or in a Cluster Ansatz? A First-Principles Simulation of Alanine Hydration, J. Phys. Chem. B, 112, (2008), 1456–1464 2. S. Zahn, F. Uhlig, J. Thar, C. Spickermann, and B. Kirchner; Intermolecular Forces in an Ionic Liquid ([Mmim][Cl]) versus Those in a Typical Salt (NaCl); Angew. Chem. Int. Ed., 47, (2008), 3639–3641; Angew. Chem., 120, (2008), 3695–3697 3. S. Zahn and B. Kirchner; Validation of dispersion corrected DFT-approaches for ionic liquid systems, J. Phys. Chem. A, 112, (2008), 8430–8435 4. C. Spickermann, J. Thar, S. B. C. Lehmann, S. Zahn, J. Hunger, R. Buchner, P. A. Hunt, T. Welton, and B. Kirchner; Why are ionic liquid ions mainly associated in water? A Car–Parrinello study of 1-ethyl,3-methyl-imidazolium chloride water mixture., J. Chem. Phys., 129, (2008), 104505 5. S. G´omez-Ruiz, S. Zahn, B. Kirchner, W. B¨ohlmann, and E. Hey-Hawkins; PP Bond Cleavage of Tetraphenyltetraphosphane-1,4-diide Facilitated by Nickel(0), Chem. Eur. J., 14, (2008), 8980–8985 6. S. Zahn, G. Bruns, J. Thar, and B. Kirchner; What keeps ionic liquids in flow?, Phys. Chem. Chem. Phys., 10, (2008), 6921–6924 7. S. Zahn, W. Reckien, B. Kirchner, H. Staats, J. Matthey, and A. L¨ utzen; Towards Allosteric Receptors – Adjustment of the Rotation Barrier of [2,2’]-Bipyridine Derivatives, Chem. Eur. J., 15, (2009), 2572–2580 8. W. Zhao, F. Leroy, B. Heggen, S. Zahn, B. Kirchner, S. Balasubramanian, and F. M¨ uller-Plathe; Are There Stable Ion-Pairs in Room-Temperature Ionic Liquids?
109
List of publications Molecular Dynamics Simulations of 1-n-Butyl-3-methylimidazolium Hexafluorophosphate, J. Am. Chem. Soc., 131, (2009), 15825–15833 9. P. Nockemann, M. Pellens, K. Van Hecke, L. Van Meervelt, J. Wouters, B. Thijs, E. Vanecht, T. N. Parac-Vogt, H. Mehdi, S. Schaltin, J. Fransaer, S. Zahn, B. Kirchner, and K. Binnemans; Cobalt(II) Complexes of Nitrile-Functionalized Ionic Liquids, Chem. Eur. J., 16, (2010), 1849–1858 10. P. J. di Dio, S. Zahn, C. B. W. Stark, and B. Kirchner; Understanding Selectivities in Ligand-free Oxidative Cyclizations of 1,5- and 1,6-Dienes with RuO4 from Density Functional Theory, Z. Naturforsch., 65b, (2010), 367–375 11. K. Zeckert, S. Zahn, and B. Kirchner; Tin-lanthanoid donor-acceptor bonds, Chem. Commun., 46, (2010), 2638–2640 12. S. Zahn and B. Kirchner; Ionic Liquids, IAS Series, 3, (2010), 97–104 13. S. Zahn, J. Thar, and B. Kirchner; Structure and dynamics of the protic ionic liquid mono-methylammonium nitrate ([CH3 NH3 ][NO3 ]) from ab initio molecular dynamics simulations, J. Chem. Phys., 132, (2010), 124506 14. K. Wendler, J. Thar, S. Zahn, and B. Kirchner; Estimating the Hydrogen Bond Energy, J. Phys. Chem. A, 114, (2010), 9529–9536 15. M. Br¨ ussel, S. Zahn, E. Hey-Hawkins, and B. Kirchner; Theoretical Investigation of Solvent Effects and Complex Systems: Toward the calculations of bioinorganic systems from ab initio molecular dynamics simulations and static quantum chemistry, Adv. Inorg. Chem., 62, (2010), 111–142 16. S. G´omez-Ruiz, R. Frank, B. Gallego, S. Zahn, B. Kirchner, and E. Hey-Hawkins; Making and breaking of P–P bonds with low-valent transition metal complexes, Eur. J. Inorg. Chem., 2011, (2011), 739–747 17. S. Zahn, R. Frank, E. Hey-Hawkins, and B. Kirchner; Pnicogen Bonds: A New Molecular Linker?, Chem. Eur. J., 17, (2011), 6034–6038 18. P. Heretsch, A. B¨ uttner, L. Tzagkaroulaki, S. Zahn, B. Kirchner, and A. Giannis; Exo-Cyclopamine – A Stable and Highly Potent Cyclopamine-Derivative, Chem. Commun., 47, (2011), 7362–7364
110
19. K. C. Lethesh, K. Van Hecke, L. Van Meervelt, P. Nockemann, B. Kirchner, S. Zahn, T. N. Parac-Vogt, W. Dehaen, and K. Binnemans; Nitrile-functionalized pyridinium, pyrrolodinium and piperidinium ionic liquids, J. Phys. Chem. B, 115, (2011), 8424–8438 20. R. Wilcken, M. Zimmermann, A. Lange, S. Zahn, B. Kirchner, and F. M. Boeckler; A novel approach to addressing methionine in molecular design through directed sulfur-halogen bonds, J. Chem. Theory Comput., 7, (2011), 2307–2315 21. S. Zahn, K. Wendler, L. Delle Site, and B. Kirchner; Depolarization of water in protic ionic liquids, Phys. Chem. Chem. Phys., 13, (2011), 15083–15093 22. K. Wendler, S. Zahn, F. Dommert, R. Berger, C. Holm, B. Kirchner, and L. Delle Site; Locality and Fluctuations: Trends in imidazolium-based Ionic Liquids and beyond, J. Chem. Theory Comput., submitted
111
112
Conference contributions Talks 1. Dynamics and intermolecular forces in ionic liquids from theoretical considerations; Winterschool SPP 1191; 2008; Leipzig 2. Dispersion forces in ionic liquids; Theoretical studies of ionic liquids (Workshop SPP 1191); 2008; Darmstadt 3. Was h¨alt ionische Fl¨ ussigkeiten fl¨ ussig?; Leibniz-Institut f¨ ur Troposph¨arenforschung e.V.; 2008; Leipzig 4. Kr¨afte in ionischen Fl¨ ussigkeiten; Wasserstoffbr¨ ucken in Ionischen Fl¨ ussigkeiten – molekulare Fl¨ ussigkeiten im Vergleich zu Ionischen Fl¨ ussigkeiten (Workshop SPP 1191); 2008; Leipzig 5. Structure, dynamics and intermolecular forces in ionic liquids; International Bunsen Discussion Meeting – Influence of Ionic Liquids on chemical and physicochemical reactions; 2008; Clausthal–Zellerfeld 6. Dynamics of a protic ionic liquid; Workshop SPP 1191; 2009; Leipzig 7. Dynamics of a protic ionic liquid; Winterschool SPP 1191; 2009; Warnem¨ unde 8. Wasser und Ionische Fl¨ ussigkeiten: Gr¨ une Chemie mittels Computerchemie; Umwelt 2010 - Von der Erkenntnis zur Entscheidung; 2010; Dessau Rosslau
Posters 1. W. Reckien, S. Zahn, A. L¨ utzen, M. Sokolowski, Th. Bredow, B. Kirchner; SFB 624 Internationales Symposium: Templates and chemistry beyond; ”Theoretical investigation of template systems”; 2007; Bonn
113
Conference contributions 2. B. Kirchner, A. P. Seitsonnen, S. Zahn, F. Uhlig, S. Lehmann, Ch. Spickermann, J. Thar; Er¨offnungsveranstaltung der Graduiertenschule der Universit¨at Potsdam: Chemische Reaktionen in gr¨ unen L¨osemitteln - nachhaltige Prozesse verstehen und optimieren; ”Genesis of ionic liquis”; 2007; Potsdam 3. S. Zahn, F. Uhlig, J. Thar, S. B. C. Lehmann, Ch. Spickermann, and B. Kirchner; Er¨offnungsveranstaltung der Graduiertenschule der Universit¨at Potsdam: Chemische Reaktionen in gr¨ unen L¨osemitteln - nachhaltige Prozesse verstehen und optimieren; ”How ionic are ionic liquids”; 2007; Potsdam 4. S. Zahn and B. Kirchner; First annual meeting of the SPP 1191; ”Dynamics and intermolecular forces in ionic liquids from theoretical considarations”; 2007; Bamberg 5. B. Kirchner, S. Zahn, J. Thar, C. Spickermann and S. B. C. Lehmann ; Antragskolloquium SPP-1191; ”Dynamics and intermolecular forces in ionic liquids from theoretical considarations”; 2008; Bamberg 6. S. Zahn, J. Thar and B. Kirchner; Theoretical studies of ionic liquids; ”Intermolecular forces and structures in ionic liquids”; 2008; Darmstadt 7. S. Zahn, J. Thar, C. Spickermann, S. B. C. Lehmann and B. Kirchner; EUCHEM 2008 – Conference on Molten Salts and Ionic Liquids; ”Structure, dynamics and forces in ionic liquids”; 2008; Kopenhagen 8. S. Zahn, R. Frank and B. Kirchner; 44. Symposium f¨ ur Theoretische Chemie; ”Intermolecular forces in ionic liquids”; 2008; Ramsau am Dachstein 9. S. Zahn, J. Thar, C. Spickermann, S. B. C. Lehmann and B. Kirchner; International Bunsen Discussion Meeting – Influence of Ionic Liquids on chemical and physicochemical reactions; ”Structure, dynamics and forces in ionic liquids”; 2008; Clausthal–Zellerfeld 10. S. Zahn, J. Thar, C. Spickermann, S. B. C. Lehmann and B. Kirchner; SPP 1191 Meeting 2009; ”Structure, dynamics and forces in ionic liquids”; 2009; Bamberg 11. S. Zahn, J. Thar, C. Spickermann, G. Bruns, M. Brehm and B. Kirchner; 2nd German-Indian Symposium on Frontiers of Chemistry; “Ionic liquids from theoretical investigations“; 2009; Leipzig
114
12. S. Zahn, J. Thar, C. Spickermann, G. Bruns, M. Brehm and B. Kirchner; International Bunsen Discussion Meeting – Molecular Transformations and Dynamics in Complex Molecular Environments; “Ionic liquids from theoretical investigations“; 2009; Leipzig 13. S. B. C. Lehmann, M. Brehm, M. Kohagen, S. Zahn, C. Spickermann, J. Thar, M. Roatsch, M. Sch¨oppke, B. Kirchner; Zwischenkolloquium SPP 1191 “Ionic liquids from theoretical investigations“; 2009; Potsdam 14. S. B. C. Lehmann, M. Brehm, M. Kohagen, S. Zahn, C. Spickermann, J. Thar, M. Roatsch, M. Sch¨oppke, B. Kirchner; Winterschool SPP 1191; “Ionic liquids from theoretical investigations“; 2009; Rostock 15. S. Zahn, M. Kohagen, M. Brehm, J. Thar, C. Spickermann, B. Kirchner; EUCHEM 2010 – Conference on Molten Salts and Ionic Liquids; “Structure and dynamics of ionic liquids”; 2010; Bamberg 16. S. B. C. Lehmann, M. Brehm, S. Zahn, C. Spickermann, M. Kohagen, J. Thar, M. Sch¨oppke, M. Roatsch, H. Weber, F. Uhlig, P. Reuther, R. St¨ uwe, T. Voigt, B. Kirchner; SPP 1191 Meeting 2010; “Ionic liquids from theoretical investigations”; 2010; Berlin
115
116
Danksagung Mein besonderer Dank gilt meiner Betreuerin, Prof. Barbara Kirchner, f¨ ur ihre Unterst¨ utzung und F¨orderung w¨ahrend meiner Promotion. Die angenehme Arbeitsatmosph¨are in ihrer Arbeitsgruppe trug massgeblich zum Erfolg dieser Arbeit bei. Auch m¨ochte ich Prof. Barbara Kirchner f¨ ur die M¨oglichkeit danken, eigenen Projekten und Ideen nachgehen zu k¨onnen. Ferner danke ich Prof. Koen Binnemans f¨ ur das anfertigen des 2. Gutachtens, die gute und unkomplizierte Zusammenarbeit sowie seine Unterst¨ utzung in der Promotionszeit. Prof. Markus Reiher danke ich daf¨ ur, dass er mich auf die Promotionsstelle in Leipzig als Alternative zu Jena hinwies und mich bei Prof. Kirchner empfohlen hat. Sicherlich w¨are die Promotion nicht so gut verlaufen, wenn ich in Jena geblieben w¨are. Der Arbeitsgruppe von Prof. Kirchner danke ich f¨ ur die zahlreichen kritischen, produktiven Diskussionen und die angenehme Atmosph¨are. Besonders hervorheben m¨ochte ich Jens Thar, von dem ich sehr viel w¨ahrend meiner Zeit in Leipzig gelernt habe. Ich w¨ unsche ihm und Uta alles Gute. Die gemeinsame Wildwassertour oder der Ausflug ins Elbsandsteingebirge sind zweifelsohne einige der sch¨onsten Momente meiner Promotionszeit gewesen. Rainer Wilcken und Katharina Scholze danke ich f¨ ur das kritische Lesen meiner Promotion und ihre hilfreichen Anmerkungen. Katharina m¨ochte ich dar¨ uber hinaus danken, dass sie mir die Evangelische Studentengemeinde in Leipzig gezeigt hat. Viele unvergessliche Momente erlebte ich dort und fand einen Ausgleich neben der wissenschaftlichen Arbeit. So traf ich unter anderem Frank Martin, der mich f¨ ur die philosphische Literatur begeistern konnte. Fr¨ uher w¨are ich nie darauf gekommen, wie spannend ein Buch von Ivan Illich oder Karl Popper sein kann. Auch m¨ochte ich den zahlreichen Freunden in der ESG Leipzig f¨ ur die vielen Spiele-/Filmabende danken, jene Momente, wo man einfach mal abschalten durfte und das innere Kind wecken konnte. Schlussendlich m¨ochte ich besonders meinen Eltern danken, die mich immer unterst¨ utzt haben und mir gleichzeitig den Freiraum gaben, eigene Wege zu gehen.
117
118
Bibliography [1] Wasserscheid, P.; Keim, W. Angew. Chem. Int. Ed. 2000, 39, 3772–3789. [2] Plechkova, N. V.; Seddon, K. R. Chem. Soc. Rev. 2008, 37, 123–150. [3] Earle, M. J.; Esperan¸ca, J. M. S. S.; Gilea, M. A.; Canongia Lopes, J. N.; Rebelo, L. P. N.; Magee, J. W.; Seddon, K. R.; Widegren, J. A. Nature 2006, 439, 831–834. [4] Walden, P. Bull. Acad. Sci. St Petersburg 1914, 405–422. [5] Wilkes, J. S.; Zaworotko, M. J. J. Chem. Soc., Chem. Commun. 1992, 965–967. [6] Welton, T. Chem. Rev. 1999, 99, 2071–2084. [7] Wasserscheid, P.; Welton, T. Ionic Liquids in Synthesis; Wiley-VCH, Weinheim, 2003. [8] Davis, J. H. Chem. Lett. 2004, 33, 1072–1077. [9] Welton, T. Coord. Chem. Rev. 2004, 248, 2459–2477. [10] Binnemans, K. Chem. Rev. 2005, 105, 4148–4204. [11] Hough, W. L.; et al. New J. Chem. 2007, 31, 1429–1436. [12] Pˆarvulescu, V. I.; Hardacre, C. Chem. Rev. 2007, 107, 2615–2665. [13] Binnemans, K. Chem. Rev. 2007, 107, 2592–2614. [14] Armand, M.; Endres, F.; MacFarlane, D. R.; Ohno, H.; Scrosati, B. Nat. Mater. 2009, 8, 621–629. [15] Giernoth, R. Angew. Chem. Int. Ed. 2010, 49, 2834–2839. [16] Kossmann, S.; Thar, J.; Kirchner, B.; Hunt, P. A.; Welton, T. J. Chem. Phys. 2006, 124, 174506.
119
Bibliography [17] Wang, Y.; Voth, G. A. J. Am. Chem. Soc. 2005, 127, 12192–12193. [18] Canongia Lopes, J.; P´adua, A. J. Phys. Chem. B 2006, 110, 3330–3335. [19] Triolo, A.; Russina, O.; Bleif, H.-J.; Di Cola, E. J. Phys. Chem. B 2007, 111, 4641–4644. [20] Xiao, D.; Rajian, J. R.; Cady, A.; Li, S.; Bartsch, R. A.; Quitevis, E. L. J. Phys. Chem. B 2007, 111, 4669–4677. [21] Emel’yanenko, V. N.; Verevkin, S. P.; Heintz, A. J. Am. Chem. Soc. 2007, 129, 3930–3937. [22] Wang, Y.; Jiang, W.; Yan, T.; Voth, G. A. Acc. Chem. Res. 2007, 40, 1193–1199. [23] P´adua, A. A. H.; Costa Gomes, M. F.; Canongia Lopes, J. N. A. Acc. Chem. Res. 2007, 40, 1087–1096. [24] Lynden-Bell, R. M.; Del P´opolo, M. G.; Youngs, T. G. A.; Kohanoff, J.; Hanke, C. G.; Harper, J. B.; Pinilla, C. C. Acc. Chem. Res. 2007, 40, 1138–1145. [25] Bhargava, B. L.; Balasubramanian, S.; Klein, M. L. Chem. Commun. 2008, 3339– 3351. [26] Kirchner, B. Top. Curr. Chem. 2009, 290, 213–262. [27] Maginn, E. J. J. Phys.: Condens. Matter 2009, 21, 373101. [28] Izgorodina, E. I. Phys. Chem. Chem. Phys. 2011, 13, 4189–4207. [29] Turner, E.; Pye, C.; Singer, R. J. Phys. Chem. A 2003, 107, 2277–2288. [30] Tsuzuki, S.; Tokuda, H.; Hayamizu, K.; Watanabe, M. J. Phys. Chem. B. 2005, 109, 16474–16481. [31] Lehmann, S. B. C.; Roatsch, M.; Sch¨oppke, M.; Kirchner, B. Phys. Chem. Chem. Phys. 2010, 12, 7473–7486. [32] Huang, X.; Braams, B. J.; Bowman, J. M. J. Phys. Chem. A 2006, 110, 445–451. [33] Sheldon, R. Chem. Commun. 2001, 2399–2407.
120
Bibliography [34] Yoshida, Y.; Muroi, K.; Otsuka, A.; Saito, G.; Takahashi, M.; Yoko, T. Inorg. Chem. 2004, 43, 1458–1462. [35] Ye, C.; Shreeve, J. M. J. Org. Chem. 2004, 69, 6511–6513. [36] Pringle, J. M.; Golding, J.; Forsyth, C. M.; Deacon, G. B.; Forsyth, M.; MacFarlane, D. R. J. Mater. Chem. 2002, 12, 3475–3480. [37] MacFarlane, D. R.; Golding, J.; Forsyth, S.; Forsyth, M.; Deacon, G. B. Chem. Commun. 2001, 1430–1431. [38] Goldstein, M. J. Chem. Phys. 1969, 51, 3728–3739. [39] Stillinger, F. H.; Weber, T. A. Sience 1984, 225, 983–989. [40] Frauenfelder, H.; Sligar, S. G.; Wolynes, P. G. Science 1991, 254, 1598–1603. [41] Abkevich, V. I.; Gutin, A. M.; Shakhnovich, E. I. J. Chem. Phys. 1994, 101, 6052– 6062. [42] Stillinger, F. H. Science 1995, 267, 1935–1939. [43] Malandro, D. L.; Lacks, D. J. J. Chem. Phys. 1997, 107, 5804–5810. [44] Schulz, M. Phys. Rev. B 1998, 57, 11319–11333. [45] Malandro, D. L.; Lacks, D. J. Phys. Rev. Lett. 1998, 81, 5576–5579. [46] Sastry, S.; Debenedetti, P. G.; Stillinger, F. H. Nature 1998, 393, 554–557. [47] Angell, A. Nature 1998, 393, 521–524. [48] Xia, X.; Wolynes, P. G. Proc. Natl. Acad. Sci. 2000, 97, 2990–2994. [49] Schrøder, T. B.; Sastry, S.; Dyre, J. C.; Glotzer, S. C. J. Chem. Phys. 2000, 112, 9834–9840. [50] Angelani, L.; Di Leonardo, R.; Ruocco, G.; Scala, A.; Sciortino, F. Phys. Rev. Lett. 2000, 85, 5356–5359. [51] Sastry, S. Nature 2001, 409, 164–167. [52] Martinez, L. M.; Angell, C. A. Nature 2001, 410, 663–667.
121
Bibliography [53] Debenedetti, P. G.; Stillinger, F. H. Nature 2001, 410, 259–267. [54] Rivera, A.; R¨ossler, E. A. Phys. Rev. B 2006, 73, 212201. [55] Rivera, A.; Brodin, A.; Pugachev, A.; R¨ossler, E. A. J. Chem. Phys. 2007, 126, 114503. [56] Leys, J.; Rajesh, R. N.; Menon, P. C.; Glorieux, C.; Longuemart, S.; Nockemann, P.; Pellens, M.; Binnemans, K. J. Chem. Phys. 2010, 133, 034503. [57] Lindemann, F. A. Phys. Z. 1910, 11, 609–612. [58] Gilvary, J. J. Phys. Rev. 1956, 102, 308–316. [59] Martin, C. J.; O’Connor, D. A. J. Phys. C 1977, 10, 3521–3526. [60] Hunt, P. A. J. Phys. Chem. B 2007, 111, 4844–4853. [61] Wilkes, J. S.; Levisky, J. A.; Wilson, R. A.; Hussey, C. L. Inorg. Chem. 1982, 21, 1263–1264. [62] Ngo, H. L.; LeCompte, K.; Hargens, L.; McEwen, A. B. Thermochim. Acta 2000, 357, 97–102. [63] Huddleston, J. G.; Visser, A. E.; Reichert, W. M.; Willauer, H. D.; Broker, G. A.; Rogers, R. D. Green Chem. 2001, 3, 156–164. [64] K¨olle, P.; Dronskowski, R. Inorg. Chem. 2004, 43, 2803–2809. [65] Lecocq, V.; Graille, A.; Santini, C. C.; Baudouin, A.; Chauvin, Y.; Basset, J. M.; Arzel, L.; Bouchu, D.; Fenet, B. New J. Chem. 2005, 29, 700–706. [66] Suarez, P. A. Z.; Selbach, V. M.; Dullius, J. E. L.; Einloft, S.; Piatnicki, C. M. S.; Azambuja, D. S.; de Souza, R. F.; Dupont, J. Electrochim. Acta 1997, 42, 2533– 2535. [67] Law, G.; Watson, P. Langmuir 2001, 17, 6138–6141. [68] Doma´ nska, U.; Marciniak, A. J. Chem. Thermodyn. 2005, 37, 577–585. [69] Fredlake, C.; Crosthwaite, J.; Hert, D.; Aki, S.; Brennecke, J. J. Chem. Eng. Data 2004, 49, 954–964.
122
Bibliography [70] Dzyuba, S. V.; Bartsch, R. A. ChemPhysChem 2002, 3, 161–166. [71] Arce, A.; Rodriguez, O.; Soto, A. J. Chem. Eng. Data 2004, 49, 514–517. [72] Berthod, A.; Ruiz-Angel, M. J.; Huguet, S. Anal. Chem. 2005, 77, 4071–4080. [73] Bonhˆote, P.; Dias, A.-P.; Papageorgiou, N.; Kalyanasundaram, K.; Gr¨atzel, M. Inorg. Chem. 1996, 35, 1168–1178. [74] Bhargava, B.; Balasubramanian, S. Chem. Phys. Lett. 2006, 417, 486–491. [75] Micaelo, N.; Baptista, A.; Soares, C. J. Phys. Chem. B 2006, 110, 14444–14451. [76] Qiao, B.; Krekeler, C.; Berger, R.; Delle Site, L.; Holm, C. J. Phys. Chem. B 2008, 112, 1743–1751. [77] Li, H.; Boatz, J. A.; Gordon, M. S. J. Am. Chem. Soc. 2008, 130, 392–393. [78] Hardacre, C.; Holbrey, J. D.; McMath, S. J.; Bowron, D. T.; Soper, A. K. J. Chem. Phys. 2003, 118, 273–278. [79] Hardacre, C.; McMath, S. E. J.; Nieuwenhuyzen, M.; Bowron, D. T.; Soper, A. K. J. Phys.: Condens. Matter 2003, 15, S159–S166. [80] B¨ uhl, M.; Chaumont, A.; Schurhammer, R.; Wipff, G. J. Phys. Chem. B 2005, 109, 18591–18599. [81] Del P´opolo, M.; Lynden-Bell, R.; Kohanoff, J. J. Phys. Chem. B 2005, 109, 5895– 5902. [82] Noack, K.; Schulz, P. S.; Paape, N.; Kiefer, J.; Wasserscheid, P.; Leipertz, A. Phys. Chem. Chem. Phys. 2010, 12, 14153–14161. [83] Bayly, C. I.; Cieplak, P.; Cornell, W. D.; Kollman, P. A. J. Phys. Chem. 1993, 97, 10269–10280. [84] Svishchev, I. M.; Kusalik, P. G. J. Chem. Phys. 1993, 99, 3049–3058. [85] Urahata, S. M.; Ribeiro, M. C. C. J. Chem. Phys. 2004, 120, 1855–1863. [86] Sun, J.; Forsyth, M.; MacFarlane, D. R. J. Phys. Chem. B 1998, 102, 8858–8864.
123
Bibliography [87] McFarlane, D. R.; Sun, J.; Golding, J.; Meakin, P.; Forsyth, M. Electrochim. Acta 2000, 45, 1271–1278. [88] L´opez-Martin, I.; Burello, E.; Davey, P. N.; Seddon, K. R.; Rothenberg, G. ChemPhysChem 2007, 8, 690–695. [89] Fang, S.; Yang, L.; Wei, C.; Peng, C.; Tachibana, K.; Kamijima, K. Electrochem. Commun. 2007, 9, 2696–2702. [90] Izgorodina, E. I.; Forsyth, M.; MacFarlane, D. R. Aust. J. Chem. 2007, 60, 15–20. [91] Spohr, H. V.; Patey, G. N. J. Chem. Phys. 2008, 129, 064517. [92] Spohr, H. V.; Patey, G. N. J. Chem. Phys. 2009, 130, 104506. [93] Fumino, K.; Wulf, A.; Ludwig, R. Angew. Chem. Int. Ed. 2008, 47, 8731–8734. [94] Zahn, S.; Bruns, G.; Thar, J.; Kirchner, B. Phys. Chem. Chem. Phys. 2008, 10, 6921–6924. [95] Yan, T.; Burnham, C. J.; Del P´opolo, M. G.; Voth, G. A. J. Phys. Chem. B 2004, 108, 11877–11881. [96] Ballone, P.; Pinilla, C.; Kohanoff, J.; Del P´opolo, M. G. J. Phys. Chem. B 2007, 111, 4938–4950. [97] Santos, L. M. N. B. F.; Canongia Lopes, J. N.; Coutinho, J. A. P.; Esperan¸ca, J. M. S. S.; Gomes, L. R.; Marrucho, I. M.; Rebelo, L. P. N. J. Am. Chem. Soc. 2007, 129, 284–285. [98] Jeziorski, B.; Moszynski, R.; Szalewicz, K. Chem. Rev. 1994, 94, 1887–1930. [99] Morrow, T. I.; Maginn, E. J. J. Phys. Chem. B 2002, 106, 12807–12813. [100] Bhargava, B. L.; Balasubramanian, S. J. Chem. Phys. 2007, 127, 114510. [101] Youngs, T. G. A.; Hardacre, C. ChemPhysChem 2008, 9, 1548–1558. [102] Schmidt, J.; Krekeler, C.; Dommert, F.; Zhao, Y.; Berger, R.; Delle Site, L.; Holm, C. J. Phys. Chem. B 2010, 114, 6150–6155. [103] Lynden-Bell, R. M. Phys. Chem. Chem. Phys. 2010, 12, 1733–1740.
124
Bibliography [104] Grimme, S. J. Chem. Phys. 2003, 118, 9095–9102. [105] Tekin, A.; Jansen, G. Phys Chem Chem Phys 2007, 9, 1680–1687. [106] Antony, J.; Grimme, S. J. Phys. Chem. A 2007, 111, 4862–4868. [107] Bernard, U. L.; Izgorodina, E. I.; MacFarlane, D. R. J. Phys. Chem. C 2010, 114, 20472–20478. [108] Kristy´an, S.; Pulay, P. Chem. Phys. Lett. 1994, 229, 175–180. [109] P´erez-Jord´a, J. M.; Becke, A. D. Chem. Phys. Lett. 1995, 233, 134–137. [110] Meijer, E. J.; Sprik, M. J. Chem. Phys. 1996, 105, 8684–8689. [111] Tsuzuki, S.; L¨ uthi, H. P. J. Chem. Phys. 2001, 114, 3949–3957. [112] Johnson, E. R.; Wolkow, R. A.; DiLabio, G. A. Chem. Phys. Lett. 2004, 394, 334–338. [113] Sherrill, C. D. J. Chem. Phys. 2010, 132, 110902. [114] Kohn, W.; Sham, L. J. Phys. Rev. A 1965, 140, 1133–1138. [115] Zhang, Y.; Pan, W.; Yang, W. J. Chem. Phys. 1997, 107, 7921–7925. [116] Jensen, F. Introduction to Computational Chemistry; Chichester; John Wiley & Sons, 2007. [117] Becke, A. D. Phys. Rev. A 1988, 38, 3098–3100. [118] Lee, C.; Yang, W.; Parr, R. G. Phys. Rev. B 1988, 37, 785–789. [119] Becke, A. D. J. Chem. Phys. 1993, 98, 5648–5652. [120] Sinnokrot, M. O.; Sherrill, C. D. J. Am. Chem. Soc. 2004, 126, 7690–7697. [121] Podeszwa, R.; Bukowski, R.; Szalewicz, K. J. Phys. Chem. A 2006, 110, 10345– 10354. [122] Grimme, S.; Antony, J.; Schwabe, T.; M¨ uck-Lichtenfeld, C. Org. Biomol. Chem. 2007, 5, 741–758.
125
Bibliography [123] Atkin, R.; Warr, G. G. J. Phys. Chem. B 2008, 112, 4164–4166. [124] Umebayashi, Y.; Chung, W.-L.; Mitsugi, T.; Fukuda, S.; Takeuchi, M.; Fujii, K.; Takamuku, T.; Kanzaki, R.; Ishiguro, S.-I. J. Comput. Chem. Jpn. 2008, 7, 125– 134. [125] Greaves, T. L.; Kennedy, D. F.; Mudie, S. T.; Drummond, C. J. J. Phys. Chem. B 2010, 114, 10022–10031. [126] Hohenberg, P.; Kohn, W. Phys. Rev. B 1964, 136, 864–871. [127] Johnson, E. R.; Mackie, I. D.; DiLabio, G. A. J. Phys. Org. Chem. 2009, 22, 1127–1135. [128] Andersson, Y.; Langreth, D. C.; Lundqvist, B. I. Phys. Rev. Lett. 1996, 76, 102–105. [129] Elstner, M.; Hobza, P.; Frauenheim, T.; Suhai, S.; Kaxiras, E. J. Chem. Phys. 2001, 114, 5149–5155. [130] Wu, Q.; Yang, W. J. Chem. Phys. 2002, 116, 515–524. [131] Kamiya, M.; Tsuneda, T.; Hirao, K. J. Chem. Phys. 2002, 117, 6010–6015. [132] Grimme, S. J. Comput. Chem. 2004, 25, 1463–1473. [133] Zimmerli, U.; Parrinello, M.; Koumoutsakos, P. J. Chem. Phys. 2004, 120, 2693– 2699. [134] Grimme, S. J. Comput. Chem. 2006, 27, 1787–1799. ˇ y, J.; Hobza, P.; Salahub, D. R. J. Comput. Chem. 2007, 28, [135] Jureˇcka, P.; Cern´ 555–569. [136] Chai, J.-D.; Head-Gordon, M. Phys. Chem. Chem. Phys. 2008, 10, 6615–6620. [137] Grimme, S.; Antony, J.; Ehrlich, S.; Krieg, H. J. Chem. Phys. 2010, 132, 154104. [138] Hepburn, J.; Scoles, G.; Penco, R. Chem. Phys. Lett. 1975, 36, 451–456. [139] Ahlrichs, R.; Penco, R.; Scoles, G. Chem. Phys. 1977, 19, 119–130. ˇ ˇ [140] Sindelka, M.; Spirko, V.; Jungwirth, P. J. Chem. Phys. 2002, 117, 5113–5123.
126
Bibliography [141] von Lilienfeld, O. A.; Tavernelli, I.; Rothlisberger, U.; Sebastiani, D. Phys. Rev. Lett. 2004, 93, 153004. [142] DiLabio, G. A. Chem. Phys. Lett. 2008, 455, 348–353. [143] Dion, M.; Rydberg, H.; Schr¨oder, E.; Langreth, D. C.; Lundqvist, B. I. Phys. Rev. Lett. 2004, 92, 246401. [144] Lee, K.; Murray, E. D.; Kong, L.; Lundqvist, B. I.; Langreth, D. C. Phys. Rev. B 2010, 82, 081101. [145] Lundqvist, B. I.; Andersson, Y.; Shao, H.; Chan, S.; Langreth, D. C. Int. J. Quantum Chem. 1995, 56, 247–255. ´ [146] Angy´ an, J. G.; Gerber, I. C.; Savin, A.; Toulouse, J. Phys. Rev. A 2005, 72, 012510. [147] Grimme, S. J. Chem. Phys. 2006, 124, 034108. [148] Perdew, J. P.; Wang, Y. Phys. Rev. B 1992, 45, 13244–13249. [149] Perdew; Burke; Ernzerhof Phys. Rev. Lett. 1996, 77, 3865–3868. [150] Perdew, J. P. Phys. Rev. B 1986, 33, 8822–8824. [151] Tao, J.; Perdew, J. P.; Staroverov, V. N.; Scuseria, G. E. Phys. Rev. Lett. 2003, 91, 146401. [152] Perdew, J. P.; Ernzerhof, M.; Burke, K. J. Chem. Phys. 1996, 105, 9982–9985. [153] Lin, I.-C.; Coutinho-Neto, M. D.; Felsenheimer, C.; von Lilienfeld, O. A.; Tavernelli, I.; Rothlisberger, U. Phys. Rev. B 2007, 75, 205131. [154] Antony, J.; Grimme, S. Phys. Chem. Chem. Phys. 2006, 8, 5287–5293. [155] Lin, I.-C.; Rothlisberger, U. Phys. Chem. Chem. Phys. 2008, 10, 2730–2734. [156] Hunt, P. A.; Gould, I. R. J. Phys. Chem. A 2006, 110, 2269–2282. [157] Pimienta, I. S. O.; Elzey, S.; Boatz, J. A.; Gordon, M. S. J. Phys. Chem. A 2007, 111, 691–703. [158] Tsuzuki, S.; Mikami, M.; Yamada, S. J. Am. Chem. Soc. 2007, 129, 8656–8662.
127
Bibliography [159] Tsuzuki, S.; Arai, A. A.; Nishikawa, K. J. Phys. Chem. B 2008, 112, 7739–7747. [160] Umebayashi, Y.; Hamano, H.; Tsuzuki, S.; Canongia Lopes, J. N.; P´adua, A. A. H.; Kameda, Y.; Kohara, S.; Yamaguchi, T.; Fujii, K.; i. Ishiguro, S. J. Phys. Chem. B 2010, 114, 11715–11724. ˇ [161] Hobza, P.; Sponer, J. J. Am. Chem. Soc. 2002, 124, 11802–11808. ˇ ˇ y, J.; Hobza, P. Phys. Chem. Chem. Phys. 2006, 8, [162] Jureˇcka, P.; Sponer, J.; Cern´ 1985–1993. [163] Halkier, A.; Helgaker, T.; Jørgensen, P.; Klopper, W.; Koch, H.; Olsen, J.; Wilson, A. K. Chem. Phys. Lett. 1998, 286, 243–252. [164] Canongia Lopes, J. N.; Deschamps, J.; P´adua, A. A. H. J. Phys. Chem. B 2004, 108, 2038–2047. [165] Lin, I.-C.; Seitsonen, A. P.; Coutinho-Neto, M. D.; Tavernelli, I.; Rothlisberger, U. J. Phys. Chem. B 2009, 113, 1127–1131. [166] Schmidt, J.; VandeVondele, J.; Kuo, I.-F. W.; Sebastiani, D.; Siepmann, J. I.; Hutter, J.; Mundy, C. J. J. Phys. Chem. B 2009, 113, 11959–11964. [167] Jaeger, D. A.; Tucker, C. E. Tetrahedron Lett. 1989, 30, 1785–1788. [168] Fischer, T.; Sethi, A.; Welton, T.; Woolf, J. Tetrahedron Lett. 1999, 40, 793–796. [169] Lee, C. W. Tetrahedron Lett. 1999, 40, 2461–2464. [170] Earle, M. J.; McCormac, P. B.; Seddon, K. R. Green Chem. 1999, 1, 23–25. [171] Zulfiqar, F.; Kitazume, T. Green Chem. 2000, 2, 137–139. [172] Ludley, P.; Karodia, N. Tetrahedron Lett. 2001, 42, 2011–2014. [173] Aggarwal, A.; Lancaster, N. L.; Sethi, A. R.; Welton, T. Green Chem. 2002, 4, 517–520. [174] Kumar, A.; Pawar, S. S. J. Org. Chem. 2004, 69, 1419–1420. [175] Vidiˇs, A.; Ohlin, C. A.; Laurenczy, G.; K¨ usters, E.; Sedelmeier, G.; Dyson, P. J. Adv. Synth. Catal. 2005, 347, 266–274.
128
Bibliography [176] Janus, E.; Goc-Maciejewska, I.; Lo˙zy´ nski, M.; Pernak, J. Tetrahedron Lett. 2006, 47, 4079–4083. [177] Acevedo, O.; Jorgensen, W.; Evanseck, J. J. Chem. Theory Comput. 2007, 3, 132– 138. [178] Izgorodina, E. I.; Bernard, U. L.; MacFarlane, D. R. J. Phys. Chem. A 2009, 113, 7064–7072. [179] Zhao, Y.; Schultz, N. E.; Truhlar, D. G. J. Chem. Theory Comput. 2006, 2, 364– 382. [180] Greaves, T. L.; Drummond, C. J. Chem. Rev. 2008, 108, 206–237. [181] MacFarlane, D. R.; Seddon, K. R. Aust. J. Chem. 2007, 60, 3–5. [182] Walden, P. Z. Phys. Chem. 1906, 55, 207–249. [183] Yoshizawa, M.; Xu, W.; Angell, C. A. J. Am. Chem. Soc. 2003, 125, 15411–15419. [184] Hirao, M.; Sugimoto, H.; Ohno, H. J. Electrochem. Soc. 2000, 147, 4168–4172. [185] Weing¨artner, H.; Knocks, A.; Schrader, W.; Kaatze, U. J. Phys. Chem. A 2001, 105, 8646–8650. [186] Picquet, M.; Tkatchenko, I.; Tommasi, I.; Wasserscheid, P.; Zimmermann, J. J. Adv. Synth. Catal. 2003, 345, 959–962. [187] Xu, W.; Angell, C. A. Science 2003, 302, 422–425. [188] Susan, M. A. B. H.; Noda, A.; Mitsushima, S.; Watanabe, M. Chem. Commun. 2003, 938–939. [189] Noda, A.; Susan, M. A. B. H.; Kudo, K.; Mitsushima, S.; Hayamizu, K.; Watanabe, M. J. Phys. Chem. B 2003, 107, 4024–4033. [190] Atkin, R.; Warr, G. G. J. Am. Chem. Soc. 2005, 127, 11940–11941. [191] Markusson, H.; Beli`eres, J.-P.; Johansson, P.; Angell, C. A.; Jacobsson, P. J. Phys. Chem. A 2007, 111, 8717–8723.
129
Bibliography [192] Nuthakki, B.; Greaves, T. L.; Krodkiewska, I.; Weerawardena, A.; Burgar, M. I.; Mulder, R. J.; Drummond, C. J. Aust. J. Chem. 2007, 60, 21–28. [193] Martinelli, A.; Matic, A.; Jacobsson, P.; B¨orjesson, L.; Fernicola, A.; Panero, S.; Scrosati, B.; Ohno, H. J. Phys. Chem. B 2007, 111, 12462–12467. [194] Kanzaki, R.; Uchida, K.; Hara, S.; Umebayashi, Y.; Ishiguro, S.-i.; Nomura, S. Chem. Lett. 2007, 36, 684–685. [195] Huang, M.-M.; Weing¨artner, H. ChemPhysChem 2008, 9, 2172–2173. [196] Zhao, C.; Burrell, G.; Torriero, A. A. J.; Separovic, F.; Dunlop, N. F.; MacFarlane, D. R.; Bond, A. M. J. Phys. Chem. B 2008, 112, 6923–6936. [197] Greaves, T. L.; Weerawardena, A.; Krodkiewska, I.; Drummond, C. J. J. Phys. Chem. B 2008, 112, 896–905. [198] Chen, D.; Schmitkamp, M.; Franci`o, G.; Klankermayer, J.; Leitner, W. Angew. Chem. Int. Ed. 2008, 47, 7339–7341. [199] Byrne, N.; Angell, C. A. Chem. Commun. 2009, 1046–1048. [200] Mamontov, E.; Luo, H.; Dai, S. J. Phys. Chem. B 2009, 113, 159–169. [201] Del P´opolo, M. G.; Kohanoff, J.; Lynden-Bell, R. M. J. Phys. Chem. B 2006, 110, 8798–8803. [202] Bagno, A.; D’Amico, F.; Saielli, G. ChemPhysChem 2007, 8, 873–881. [203] Kirchner, B.; Seitsonen, A. P. Inorg. Chem. 2007, 46, 2751–2754. [204] Ghatee, M. H.; Ansari, Y. J. Chem. Phys. 2007, 126, 154502. [205] Bhargava, B. L.; Balasubramanian, S. J. Phys. Chem. B 2007, 111, 4477–4487. [206] Bhargava, B. L.; Saharay, M.; Balasubramanian, S. Bull. Mater. Sci. 2008, 31, 327–334. [207] Bhargava, B. L.; Balasubramanian, S. J. Phys. Chem. B 2008, 112, 7566–7573. [208] Spickermann, C.; Thar, J.; Lehmann, S. B. C.; Zahn, S.; Hunger, J.; Buchner, R.; Hunt, P. A.; Welton, T.; Kirchner, B. J. Chem. Phys. 2008, 129, 104505.
130
Bibliography [209] Wang, Z.; Zhang, L.; Chen, X.; Cukier, R. I.; Bu, Y. J. Phys. Chem. B 2009, 113, 8222–8226. [210] Thar, J.; Brehm, M.; Seitsonen, A. P.; Kirchner, B. J. Phys. Chem. B 2009, 113, 15129–15132. [211] Jiang, D.; Dai, S. J. Phys. Chem. B 2008, 112, 10202–10206. [212] Mallik, B. S.; Siepmann, J. I. J. Phys. Chem. B 2010, 114, 12577–12584. [213] Ishida, H.; Ikeda, R.; Nakamura, D. Chem. Lett. 1982, 11, 1943–1946. [214] Mylrajan, M.; Srinivasan, T. K. K.; Sreenivasamurthy, G. J. Crystallogr. Spectrosc. Res. 1985, 15, 493–500. [215] Mylrajan, M.; Srinivasan, T. K. K. J. Raman Spectrosc. 1987, 18, 365–371. [216] Jayasooriya, U. A.; Kettle, S. F. A.; Mortimer, R.; Eckert, J.; McGuire, N. K. J. Chem. Soc., Faraday Trans. 1992, 88, 1631–1636. [217] Wasylishen, R. E. Can. J. Chem. 1986, 64, 773–776. [218] Xu, J.-M.; Liu, B.-K.; Wu, W.-B.; Qian, C.; Wu, Q.; Lin, X.-F. J. Org. Chem. 2006, 71, 3991–3993. [219] Sun, H.; Zhang, D.; Wang, F.; Liu, C. J. Phys. Chem. A 2007, 111, 4535–4541. [220] Evans, D. F.; Chen, S.-H.; Schriver, G. W.; Arnett, E. M. J. Am. Chem. Soc. 1981, 103, 481–482. [221] Fumino, K.; Wulf, A.; Ludwig, R. Angew. Chem. Int. Ed. 2009, 48, 3184–3186. [222] Espinosa, E.; Molins, E.; Lecomte, C. Chem. Phys. Lett. 1998, 285, 170–173. [223] Grabowski, S. J. J. Phys. Chem. A 2001, 105, 10739–10746. [224] Wendler, K.; Thar, J.; Zahn, S.; Kirchner, B. J. Phys. Chem. A 2010, 114, 9529– 9536. [225] Luzar, A.; Chandler, D. Nature 1996, 379, 55–57. [226] Luzar; Chandler Phys. Rev. Lett. 1996, 76, 928–931.
131
Bibliography [227] Steiner, T.; Desiraju, G. R. Chem. Commun. 1998, 891–892. [228] Wernet, P.; et al. Science 2004, 304, 995–999. [229] Lehmann, S. B. C.; Spickermann, C.; Kirchner, B. J. Chem. Theory Comput. 2009, 5, 1650–1656. [230] Kumar, R.; Schmidt, J. R.; Skinner, J. L. J. Chem. Phys. 2007, 126, 204107. [231] Ishida, H.; Ikeda, R.; Nakamura, D. J. Chem. Soc., Faraday Trans. 2 1985, 2, 963–973. [232] Izgorodina, E. I.; Forsyth, M.; Macfarlane, D. R. Phys. Chem. Chem. Phys. 2009, 11, 2452–2458. [233] Malvaldi, M.; Chiappe, C. J. Phys.: Condens. Matter 2008, 20, 035108. [234] Rapaport, D. C. Mol. Phys. 1983, 50, 1151–1162. [235] Lee, H.-S.; Tuckerman, M. E. J. Chem. Phys. 2007, 126, 164501. [236] Del P´opolo, M.; Voth, G. J. Phys. Chem. B 2004, 108, 1744–1752. [237] Kennedy, D. F.; Drummond, C. J. J. Phys. Chem. B 2009, 113, 5690–5693. [238] Ludwig, R. J. Phys. Chem. B 2009, 113, 15419–15422. [239] Lipari, G.; Szabo, A. J. Am. Chem. Soc. 1982, 104, 4546–4559. [240] Steiner, T. Angew. Chem. Int. Ed. 2002, 41, 49–76. [241] Zhao, W.; Leroy, F.; Heggen, B.; Zahn, S.; Kirchner, B.; Balasubramanian, S.; M¨ uller-Plathe, F. J. Am. Chem. Soc. 2009, 131, 15825–15833. [242] Kohagen, M.; Brehm, M.; Thar, J.; Zhao, W.; M¨ uller-Plathe, F.; Kirchner, B. J. Phys. Chem. B 2011, 115, 693–702. [243] Tsuzuki, S.; Tokuda, H.; Mikami, M. Phys. Chem. Chem. Phys. 2007, 9, 4780–4784. [244] Seddon, K. R.; Stark, A.; Torres, M.-J. Pure Appl. Chem. 2000, 72, 2275–2287. [245] Gallo, V.; Mastrorilli, P.; Nobile, C. F.; Romanazzi, G.; Suranna, G. P. J. Chem. Soc., Dalton Trans. 2002, 4339–4342.
132
Bibliography [246] Villagr´an, C.; Deetlefs, M.; Pitner, W. R.; Hardacre, C. Anal. Chem. 2004, 76, 2118–2123. [247] Nockemann, P.; Binnemans, K.; Driesen, K. Chem. Phys. Lett. 2005, 415, 131–136. [248] Earle, M. J.; Gordon, C. M.; Plechkova, N. V.; Seddon, K. R.; Welton, T. Anal. Chem. 2007, 79, 758–764. [249] Stark, A.; Behrend, P.; Braun, O.; M¨ uller, A.; Ranke, J.; Ondruschka, B.; Jastorff, B. Green Chem. 2008, 10, 1152–1161. [250] Clare, B.; Sirwardana, A.; MacFarlane, D. R. Top. Curr. Chem. 2009, 290, 1–40. [251] Cammarata, L.; Kazarian, S. G.; Salter, P. A.; Welton, T. Phys. Chem. Chem. Phys. 2001, 3, 5192–5200. [252] Schr¨oder, U.; Wadhawan, J. D.; Compton, R. G.; Marken, F.; Suarez, P. A. Z.; Consorti, C. S.; de Souza, R. F.; Dupont, J. New J. Chem. 2000, 24, 1009–1015. [253] Widegren, J. A.; Saurer, E. M.; Marsh, K. N.; Magee, J. W. J. Chem. Thermodyn. 2005, 37, 569–575. [254] Widegren, J. A.; Laesecke, A.; Magee, J. W. Chem. Commun. 2005, 1610–1612. [255] Xu, H.; Zhao, D.; Xu, P.; Liu, F.; Gao, G. J. Chem. Eng. Data 2005, 50, 133–135. [256] G´omez, E.; Gonz´alez, B.; Dom´ınguez, A.; Tojo, E.; Tojo, J. J. Chem. Eng. Data 2006, 51, 696–701. [257] Rodr´ıguez, H.; Brennecke, J. F. J. Chem. Eng. Data 2006, 51, 2145–2155. [258] Kelkar, M. S.; Maginn, E. J. J. Phys. Chem. B 2007, 111, 4867–4876. [259] Mokhtarani, B.; Sharifi, A.; Mortaheb, H. R.; Mirzaei, M.; Mafi, M.; Sadeghian, F. J. Chem. Thermodyn. 2009, 41, 323–329. [260] Firestone, M. A.; Dzielawa, J. A.; Zapol, P.; Curtiss, L. A.; Seifert, S.; Dietz, M. L. Langmuir 2002, 18, 7258–7260. [261] Spohr, H. V.; Patey, G. N. J. Chem. Phys. 2010, 132, 234510.
133
Bibliography [262] Amigues, E.; Hardacre, C.; Keane, G.; Migaud, M.; O’Neill, M. Chem. Commun. 2006, 72–74. [263] Seddon, K. R.; Stark, A. Green Chem. 2002, 4, 119–123. [264] Kim, D. W.; Hong, D. J.; Seo, J. W.; Kim, H. S.; Kim, H. K.; Song, C. E.; Chichon, D. Y. J. Org. Chem. 2004, 69, 3186–3189. [265] Weng, J.; Wang, C.; Li, H.; Wang, Y. Green Chem. 2006, 8, 96–99. [266] Li, C.; Zhao, Z. K. Adv. Synth. Catal. 2007, 349, 1847–1850. [267] Li, C.; Wang, Q.; Zhao, Z. K. Green Chem. 2008, 10, 177–182. [268] Hanke, C. G.; Atamas, N. A.; Lynden-Bell, R. M. Green Chem. 2002, 4, 107–111. [269] Hanke, C.; Lynden-Bell, R. J. Phys. Chem. B 2003, 107, 10873–10878. [270] Jiang, W.; Wang, Y.; Voth, G. A. J. Phys. Chem. B 2007, 111, 4812–4818. [271] Schr¨oder, C.; Rudas, T.; Neumayr, G.; Benkner, S.; Steinhauser, O. J. Chem. Phys. 2007, 127, 234503. [272] Schr¨oder, C.; Hunger, J.; Stoppa, A.; Buchner, R.; Steinhauser, O. J. Chem. Phys. 2008, 129, 184501. [273] Pic´alek, J.; Minofar, B.; Kolafa, J.; Jungwirth, P. Phys. Chem. Chem. Phys. 2008, 10, 5765–5775. [274] Kelkar, M. S.; Shi, W.; Maginn, E. J. Ind. Eng. Chem. Res. 2008, 47, 9115–9126. [275] Schr¨oder, C.; Neumayr, G.; Steinhauser, O. J. Chem. Phys. 2009, 130, 194503. [276] Bhargava, B. L.; Klein, M. L. J. Phys. Chem. B 2009, 113, 9499–9505. [277] Raju, S. G.; Balasubramanian, S. J. Phys. Chem. B 2009, 113, 4799–4806. [278] Krekeler, C.; Dommert, F.; Schmidt, J.; Zhao, Y. Y.; Holm, C.; Berger, R.; Delle Site, L. Phys. Chem. Chem. Phys. 2010, 12, 1817–1821. [279] Evans, D. F.; Yamauchi, A.; Roman, R.; Casassa, E. Z. J. Colloid Interface Sci. 1982, 88, 89–96.
134
Bibliography [280] Mirejovsky, D.; Arnett, E. M. J. Am. Chem. Soc. 1983, 105, 1112–1117. [281] Herfort, I.-M.; Schneider, H. Liebigs Ann. Chem. 1991, 27–31. [282] Kanzaki, R.; Song, X.; Umebayashi, Y.; Ishiguro, S.-i. Chem. Lett. 2010, 39, 578– 579. [283] Sharp, K. A.; Madan, B.; Manas, E.; Vanderkooi, J. M. J. Chem. Phys. 2001, 114, 1791–1796. [284] Montrose, C. J.; Bucaro, J. A.; Marshall-Coakley, J.; Litovitz, T. A. J. Chem. Phys. 1974, 60, 5025–5029. [285] Starr, F. W.; Nielsen, J. K.; Stanley, H. E. Phys. Rev. Lett. 1999, 82, 2294–2297. [286] Sutmann, G.; Vallauri, R. J. Mol. Liq. 2002, 98–99, 215–226. [287] Wannier, G. H. Phys. Rev. 1937, 52, 191–197. [288] Marzari, N.; Vanderbilt, D. Phys. Rev. B 1997, 56, 12847–12865. [289] Kirchner, B.; Hutter, J. J. Chem. Phys. 2004, 121, 5133–5142. [290] Sieffert, N.; Wipff, G. J. Phys. Chem. B 2006, 110, 13076–13085. [291] Hallett, J. P.; Liotta, C. L.; Ranieri, G.; Welton, T. J. Org. Chem. 2009, 74, 1864–1868. [292] Baldelli, S. J. Phys. Chem. B 2003, 107, 6148–6152. [293] Rivera-Rubero, S.; Baldelli, S. J. Am. Chem. Soc. 2004, 126, 11788–11789. [294] Niga, P.; Wakeham, D.; Nelson, A.; Warr, G. G.; Rutland, M.; Atkin, R. Langmuir 2010, 26, 8282–8288. [295] Whitesides, G. M.; Mathias, J. P.; Seto, C. T. Science 1991, 254, 1312–1319. [296] Philp, D.; Stoddart, J. F. Angew. Chem. Int. Ed. 1996, 35, 1154–1196. [297] Russell, V.; Ward, M. Chem. Mater. 1996, 8, 1654–1666. [298] Glusker, J. P. Top. Curr. Chem. 1998, 198, 1–56.
135
Bibliography [299] Holliday, B. J.; Mirkin, C. A. Angew. Chem. Int. Ed. 2001, 40, 2022–2043. [300] Lehn, J.-M. Proc. Natl. Acad. Sci. 2002, 99, 4763–4768. [301] Werz, D. B.; Gleiter, R.; Rominger, F. J. Am. Chem. Soc. 2002, 124, 10638–10639. [302] Schalley, C. A.; L¨ utzen, A.; Albrecht, M. Chem. Eur. J. 2004, 10, 1072–1080. [303] Metrangolo, P.; Meyer, F.; Pilati, T.; Resnati, G.; Terraneo, G. Angew. Chem. Int. Ed. 2008, 47, 6114–6127. [304] Cordier, P.; Tournilhac, F.; Souli´e-Ziakovic, C.; Leibler, L. Nature 2008, 451, 977– 980. [305] Bauer, S.; Tschirschwitz, S.; L¨onnecke, P.; Frank, R.; Kirchner, B.; Clarke, M. L.; Hey-Hawkins, E. Eur. J. Inorg. Chem. 2009, 2009, 2776–2788. [306] Hill, W. E.; Silva-Trivino, L. M. Inorg. Chem. 1978, 17, 2495–2498. [307] Hill, W. E.; Silva-Trivino, L. M. Inorg. Chem. 1979, 18, 361–364. [308] Kilian, P.; Slawin, A. M. Z.; Woollins, J. D. Chem. Eur. J. 2003, 9, 215–222. [309] Reiter, S.; Nogai, S.; Karaghiosoff, K.; Schmidbaur, H. J. Am. Chem. Soc. 2004, 126, 15833–15843. [310] Balema, V. P.; Blaurock, S.; Hey-Hawkins, E. Polyhedron 1999, 18, 545–552. [311] Sterzik, A.; Rys, E.; Blaurock, S.; Hey-Hawkins, E. Polyhedron 2001, 20, 3007– 3014. [312] Sundberg, M. R.; Uggla, R.; Vi˜ nas, C.; Teixidor, F.; Paavola, S.; Kivek¨as, R. Inorg. Chem. Commun. 2007, 10, 713–716. [313] Tschirschwitz, S.; L¨onnecke, P.; Hey-Hawkins, E. Dalton Trans. 2007, 1377–1382. [314] Wiberg, K. B. Tetrahedron 1968, 24, 1083–1096. [315] Rosenfield, R. E.; Parthasarathy, R.; Dunitz, J. D. J. Am. Chem. Soc. 1977, 99, 4860–4862. [316] Ananthavel, S. P.; Manoharan, M. Chem. Phys. 2001, 269, 49–57.
136
Bibliography [317] Reed, A. E.; Weinhold, F. J. Chem. Phys. 1983, 78, 4066–4073. [318] Reed, A. E.; Curtiss, L. A.; Weinhold, F. Chem. Rev. 1988, 88, 899–926. [319] Bleiholder, C.; Werz, D. B.; K¨oppel, H.; Gleiter, R. J. Am. Chem. Soc. 2006, 128, 2666–2674. [320] Bleiholder, C.; Gleiter, R.; Werz, D. B.; K¨oppel, H. Inorg. Chem 2007, 46, 2249– 2260. [321] Lommerse, J.; Stone, A.; Taylor, R.; Allen, F. J. Am. Chem. Soc. 1996, 118, 3108– 3116. [322] Awwadi, F. F.; Willett, R. D.; Peterson, K. A.; Twamley, B. Chem. Eur. J. 2006, 12, 8952–8960. [323] Clark, T.; Hennemann, M.; Murray, J. S.; Politzer, P. J. Mol. Model 2007, 13, 291–296. [324] Holleman, A. F.; Wiberg, E.; Wiberg, N. Lehrbuch der Anorganischen Chemie; de Gruyter, 1995. [325] Becke, A. D.; Edgecombe, K. E. J. Chem. Phys. 1990, 92, 5397–5403. [326] Savin, A.; Nesper, R.; Wengert, S.; F¨assler, T. F. Angew. Chem. Int. Ed. 1997, 36, 1808–1832. [327] Karpfen, A. Theor. Chem. Acc. 2003, 110, 1–9. [328] Zou, J.-W.; Jiang, Y.-J.; Guo, M.; Hu, G.-X.; Zhang, B.; Liu, H.-C.; Yu, Q.-S. Chem. Eur. J. 2005, 11, 740–751. [329] Valerio, G.; Raos, G.; Meille, S.; Metrangolo, P.; Resnati, G. J. Phys. Chem. A 2000, 104, 1617–1620. [330] Politzer, P.; Lane, P.; Concha, M. C.; Ma, Y.; Murray, J. S. J. Mol. Model 2007, 13, 305–311. [331] Ahlrichs, R.; B¨ar, M.; H¨aser, M.; Horn, H.; K¨olmel, C. Chem. Phys. Lett. 1989, 162, 165–169. [332] Sch¨afer, A.; Huber, C.; Ahlrichs, R. J. Chem. Phys. 1994, 100, 5829–5835.
137
Bibliography [333] Feyereisen, M.; Fitzgerald, G.; Komornicki, A. Chem. Phys. Lett. 1993, 208, 359– 363. [334] Weigend, F.; H¨aser, M.; Patzelt, H.; Ahlrichs, R. Chem. Phys. Lett. 1998, 294, 143–152. [335] Boys, S. F.; Bernardi, F. Mol. Phys. 1970, 19, 553–566. [336] Dunning, T. H., Jr. J. Chem. Phys. 1989, 90, 1007–1023. [337] Woon, D. E.; Dunning, T. H., Jr. J. Chem. Phys. 1993, 98, 1358–1371. [338] Weigend, F.; K¨ohn, A.; H¨attig, C. J. Chem. Phys. 2002, 116, 3175–3183. [339] Berendsen, H. J. C.; van der Spoel, D.; van Drunen, R. Comp. Phys. Comm. 1995, 91, 43–56. [340] Lindahl, E.; Hess, B.; van der Spoel, D. J. Mol. Mod. 2001, 7, 306–317. [341] van der Spoel, D.; Lindahl, E.; Hess, B.; Groenhof, G.; Mark, A. E.; Berendsen, H. J. C. J. Comput. Chem. 2005, 26, 1701–1718. [342] Parrinello, M.; Rahman, A. J. Appl. Phys. 1981, 52, 7182–7190. [343] Nos´e, S.; Klein, M. L. Mol. Phys. 1983, 50, 1055–1076. [344] Hoover, W. G. Phys. Rev. A 1985, 31, 1695–1697. [345] Liu, Z.; Huang, S.; Wang, W. J. Phys. Chem. B 2004, 108, 12978–12989. [346] Wang, J. M.; Wolf, R. M.; Caldwell, J. W.; Kollman, P. A.; Case, D. A. J. Comput. Chem. 2004, 25, 1157–1174. [347] Darden, T.; York, D.; Pedersen, L. J. Chem. Phys. 1993, 98, 10089–10092. [348] Essmann, U.; Perera, L.; Berkowitz, M. L.; Darden, T.; Lee, H.; Pedersen, L. G. J. Chem. Phys. 1995, 103, 8577–8593. [349] Dunlap, B. I.; Connolly, J. W. D.; Sabin, J. R. J. Chem. Phys. 1979, 71, 3396–3402. [350] Baerends, E. J.; Ellis, D. E.; Ros, P. Chem. Phys. 1973, 2, 41–51.
138
Bibliography [351] Frisch, M. J.; et al.; Gaussian03; revision D.01; Gaussian, Inc.: Wallingford, CT, 2004; http://www.gaussian.com. [352] Fannin, A. A.; Floreani, D. A.; King, L. A.; Landers, J. S.; Piersma, B. J.; Stech, D. J.; Vaughn, R. L.; Wilkes, J. S.; Williams, J. J. Phys. Chem. 1984, 88, 2614– 2621. [353] Werner, H.-J.; et al.; Molpro; 2006.1; http://www.molpro.net. [354] ORCA - An ab initio, DFT and http://www.thch.uni-bonn.de/tc/orca.
semiempirical
SCF-MO
package;
[355] Peterson, K. A.; Shepler, B. C.; Figgen, D.; Stoll, H. J. Phys. Chem. A 2006, 110, 13877–13883. [356] Eichkorn, K.; Weigend, F.; Treutler, O.; Ahlrichs, R. Theor. Chem. Acc. 1997, 97, 119–124. [357] CPMD, Copyright IBM Corp 1990-2006, Copyright MPI f¨ ur Festk¨orperforschung Stuttgart 1997-2001; www.cpmd.org. [358] Troullier; Martins Phys. Rev. B 1991, 43, 1993–2006. [359] Kleinman, L.; Bylander, D. M. Phys. Rev. Lett. 1982, 48, 1425–1428. [360] Car, R.; Parrinello, M. Phys. Rev. Lett. 1985, 55, 2471–2474. [361] Nos´e, S. J. Chem. Phys. 1984, 81, 511–519. [362] Martyna, G. J.; Klein, M. L.; Tuckerman, M. J. Chem. Phys. 1992, 97, 2635–2643. [363] Wang, J.; Rom´an-P´erez, G.; Soler, J. M.; Artacho, E.; Fern´andez-Serra, M.-V. J. Chem. Phys. 2011, 134, 024516. [364] Weigend, F.; Ahlrichs, R. Phys. Chem. Chem. Phys. 2005, 7, 3297–3305. [365] Weigend, F. Phys. Chem. Chem. Phys. 2006, 8, 1057–1065. [366] Peterson, K. A. J. Chem. Phys. 2003, 119, 11099–11112. [367] Peterson, K. A.; Figgen, D.; Goll, E.; Stoll, H.; Dolg, M. J. Chem. Phys. 2003, 119, 11113–11123.
139
Bibliography [368] Goedecker, S.; Teter, M.; Hutter, J. Phys. Rev. B 1996, 54, 1703–1710. [369] Hartwigsen, C.; Goedecker, S.; Hutter, J. Phys. Rev. B 1998, 58, 3641–3662.
140
Zusammenfassung der wissenschaftlichen Ergebnisse zur Dissertation
Forces, structure, and dynamics in ionic liquids Der Fakult¨at f¨ ur Chemie und Mineralogie der Universit¨at Leipzig vorgelegt von
Dipl. Chem. Stefan Zahn im M¨arz 2011
Angefertigt am Wilhelm–Ostwald–Institut f¨ ur Physikalische und Theoretische Chemie
1
Introduction
Ionic liquids offer high-potential solutions to an amazingly broad range of applications. However, the scope of ionic liquids was recognized barely until the development of air and water stable imidazolium-based ionic liquids in 1992.1 Since then, the interest in these compounds has increased significantly leading to manifold applications of these compounds in natural sciences and industry.2–5 Unfortunately, little is known about general properties of ionic liquids except the obvious fact that they consist solely of ions. Due to the technical progress and the developments in theoretical chemistry over the last 20 years, computational methods have become a powerful tool in chemistry. However, not only cooperativity but also intermolecular forces make the choice of a reliable computational approach a challenging task for ionic liquids. Nevertheless, carefully selected methods are a powerful tool for the investigation of ionic liquids.6–12 This thesis aims to highlight molecular features of ionic liquids which contribute to the fascinating properties of these liquids. Additionally, the Kohn–Sham density functional theory is validated for ionic liquids to improve the reliability of further computational investigations. Finally, a new possible molecular linker is identified and characterized.
2
The validity of the energy landscape paradigm
According to Goldstein’s energy landscape paradigm,13 the occupied conformational states of a high melting compound are located in deep and steep parts of the energy potential surface, while a low melting compound has shallow energy potentials and low transition states between conformational states. As an example to test the validity of Goldstein’s model for ionic liquids, the substitution of the most acidic proton at C2 of 1,3-dialkylimidazolium based ionic liquids with a methyl group was selected. This substitution replaces an attractive interaction with a repulsive one and, therefore, a lower melting point and viscosity is expected. However, the opposite was observed.14 2
Static quantum chemistry investigations as well as classical molecular dynamics simulations of this thesis show that the C2-methyl-substitution decreases the mobility of the counter ion significantly, see Fig. 1. Thus, the critical displacement, necessary for melting, is connected to a larger activation energy in 1,2,3-trialkylimidazolium-based ionic liquids than in 1,3-dialkylimidazolium-based ionic liquids which explains the increased melting point of the C2-methyl-substituted compounds. Additionally, these results show that the energy landscape paradigm can also be applied to ionic liquids for a discussion of the melting point.
Figure 1: a: Potential energy surface from DB /TB to DB /TB (opposite side) via conformer DA /TA for [C1 mim][Cl] (blue) and [C1 C1 mim][Cl] (red). b and c: SDF of chloride for [C2 C1 mim][Cl] (b) and [C2 mim][Cl] (c).
3
Intermolecular forces in ionic liquids
It has been inferred that other forces besides pure coulomb interactions must play a role in ionic liquids.15–18 Thus, the symmetry-adapted perturbation theory (SAPT) method was employed to decompose the intermolecular forces and to study their influence on the potential energy surface. A significant influence of dispersion forces on interaction energy 3
and equilibrium distance was observed for diverse ionic liquids as opposed to a typical salt for which dispersion forces play a negligible role. This results in a shallower energy landscape of ionic liquids than of typical salts. Therefore, one cause for the low melting point of ionic liquids stems from the important contribution of dispersion forces in the intermolecular interaction of ionic liquids. Furthermore, a recent investigation shows that the ratio of total ion pair binding energy to its dispersion component correlates well with the melting point of ionic liquids19 which supports the important role of dispersion forces in depressing the melting point.
4
Assessment of Kohn–Sham density functional theory for ionic liquid systems
The study of the intermolecular forces in ionic liquids points to a drawback of ab initio molecular dynamics simulations in which the electronic structure is calculated commonly by Kohn–Sham density functional theory (DFT). This approach accounts for electrostatic, exchange and induction forces very well, but fails for the description of dispersion forces.20–25 Therefore, several commonly used density functionals, among them B3LYP, as well as two empirical dispersion corrected approaches were validated. The first approach (DFT-D) includes the dispersion correction in the functional by a sum of damped interatomic potentials26 while the second ansatz includes the empirical correction in a dispersion-corrected atom-center dispersion potential (DCACP).27 The large error of common functionals matches Hartree–Fock calculations. The accuracy of DFT calculations is solely comparable to second-order Møller–Plesset perturbation theory calculations if empirical dispersion corrections are employed in the DFT approach. Hence, dispersioncorrected Kohn–Sham density functional theory approaches are recommended strongly for static quantum chemistry investigations or ab initio molecular dynamics simulation studies of ionic liquid systems. 4
5
Structure and dynamics in a protic ionic liquid
The DCACP approach was employed in ab initio molecular dynamics simulations of monomethylammonium nitrate (MMAN) to obtain a detailed molecular view on structure and dynamics of a protic ionic liquid. Analyzing the ion dynamics reveals long lived ion associates of two counter ions whose lifetime exceeds the simulation time by far. Thus, the ions are conserved in a cage. However, there are many fluctuations and conformational changes in the first counter ion solvation shell. Therefore, the ions seem to rattle in a cage of counter ions which was also observed for imidazolium-based ionic liquids.28
6
Depolarization of water in protic ionic liquids
Water is one of the typical impurities in ionic liquids because these salts tend to absorb water from their environment.29–31 Thus, one might be anxious that the hygroscopic nature of ionic liquids could limit the usage of ionic liquids as solvents for water sensitive reactions. However, not only the properties of ionic liquids are changed by water impurities,29, 32, 33 a changed reactivity of water in ionic liquids was reported, too.34–39 Therefore, a mixture of MMAN with 1.6 wt % water was investigated from Car–Parrinello molecular dynamics simulations to study the effects of water on the protic ionic liquid and vice versa. Analyzing the trajectory reveals significant differences compared to water aprotic ionic liquid mixtures. The strongest hydrogen bonds and the longest lifetime of a hydrogen bond can be observed between the cation and the water molecules in the investigated mixture while the anions are strongest connected to water in water imidazolium-based ionic liquid mixtures.30, 40 Overall, all hydrogen bonds in the water MMAN mixture possess comparable lifetimes and strengths and, therefore, a good incorporation of water into the hydrogen bond network of MMAN is observed. This results in a tetrahedral hydrogen bond coordination of water. Thus, one might expect a larger dipole moment 5
of water in the investigated mixture compared to neat water due to the good hydrogen bond network incorporation and the strongly charged vicinity of water in the protic ionic liquid. However, the opposite is observed. This leads to the conclusion that strong electrostatic screening might reduce the effective ion charge in protic as well as in aprotic ionic liquids.41–43
7
Pnicogen bonds
Indications for a P–P nonbonding interaction were observed in several NMR spectra.44–48 Hence, the non-covalent interaction of the nitrogen group (pnicogen) atoms was characterized by diverse computational approaches. Overall, pnicogen bonds have comparable strength to moderate hydrogen bonds like in pure water and, therefore, might be a suitable new molecular linker. Strong non-covalent bonds can be achieved by a good leaving group along the bond axis as well as an electron-donating group perpendicular to this axis. The attractive interaction is induced mainly by electrostatic interactions of the lone pair of electrons of one pnicogen atom with a positively charged belt surrounding the lone pair of electrons at the other pnicogen atom, see Fig. 2. However, both lone pairs of electrons are not able to avoid a repulsive interaction. Hence, a significant contribution of dispersion forces was observed in the pnicogen bonds as well. As only a small surface area at the pnicogens is left for the positively and negatively charged region, the charge distribution seems to be essential for the strength of the pnicogen bonds. The optimal charge distribution may be at nitrogen and phosphorus for which the strongest interactions in the nitrogen group were observed.
6
Figure 2: Electrostatic potential (a) and electron localization function (b) of Br3 P· · · PBr3
References [1] Wilkes, J. S.; Zaworotko, M. J. J. Chem. Soc., Chem. Commun. 1992, 965–967. [2] Wasserscheid, P.; Welton, T., Eds. Ionic Liquids in Synthesis; Wiley-VCH, Weinheim, 2003. [3] Hough, W. L.; et al. New J. Chem. 2007, 31, 1429–1436. [4] Plechkova, N. V.; Seddon, K. R. Chem. Soc. Rev. 2008, 37, 123–150. [5] Armand, M.; Endres, F.; MacFarlane, D. R.; Ohno, H.; Scrosati, B. Nat. Mater. 2009, 8, 621–629. [6] Wang, Y.; Jiang, W.; Yan, T.; Voth, G. A. Acc. Chem. Res. 2007, 40, 1193–1199. [7] P´adua, A. A. H.; Costa Gomes, M. F.; Canongia Lopes, J. N. A. Acc. Chem. Res. 2007, 40, 1087–1096. [8] Lynden-Bell, R. M.; Del P´opolo, M. G.; Youngs, T. G. A.; Kohanoff, J.; Hanke, C. G.; Harper, J. B.; Pinilla, C. C. Acc. Chem. Res. 2007, 40, 1138–1145. 7
[9] Bhargava, B. L.; Balasubramanian, S.; Klein, M. L. Chem. Commun. 2008, 3339– 3351. [10] Kirchner, B. Top. Curr. Chem. 2009, 290, 213–262. [11] Maginn, E. J. J. Phys.: Condens. Matter 2009, 21, 373101. [12] Izgorodina, E. I. Phys. Chem. Chem. Phys. 2011, 13, 4189–4207. [13] Goldstein, M. J. Chem. Phys. 1969, 51, 3728–3739. [14] Bonhˆote, P.; Dias, A.-P.; Papageorgiou, N.; Kalyanasundaram, K.; Gr¨atzel, M. Inorg. Chem. 1996, 35, 1168–1178. [15] Yan, T.; Burnham, C. J.; Del P´opolo, M. G.; Voth, G. A. J. Phys. Chem. B 2004, 108, 11877–11881. [16] Tsuzuki, S.; Tokuda, H.; Hayamizu, K.; Watanabe, M. J. Phys. Chem. B. 2005, 109, 16474–16481. [17] Ballone, P.; Pinilla, C.; Kohanoff, J.; Del P´opolo, M. G. J. Phys. Chem. B 2007, 111, 4938–4950. [18] Santos, L. M. N. B. F.; Canongia Lopes, J. N.; Coutinho, J. A. P.; Esperan¸ca, J. M. S. S.; Gomes, L. R.; Marrucho, I. M.; Rebelo, L. P. N. J. Am. Chem. Soc. 2007, 129, 284–285. [19] Bernard, U. L.; Izgorodina, E. I.; MacFarlane, D. R. J. Phys. Chem. C 2010, 114, 20472–20478. [20] Kristy´an, S.; Pulay, P. Chem. Phys. Lett. 1994, 229, 175–180. [21] P´erez-Jord´a, J. M.; Becke, A. D. Chem. Phys. Lett. 1995, 233, 134–137. [22] Meijer, E. J.; Sprik, M. J. Chem. Phys. 1996, 105, 8684–8689. 8
[23] Tsuzuki, S.; L¨ uthi, H. P. J. Chem. Phys. 2001, 114, 3949–3957. [24] Johnson, E. R.; Wolkow, R. A.; DiLabio, G. A. Chem. Phys. Lett. 2004, 394, 334– 338. [25] Sherrill, C. D. J. Chem. Phys. 2010, 132, 110902. [26] Grimme, S. J. Comput. Chem. 2006, 27, 1787–1799. [27] Lin, I.-C.; Coutinho-Neto, M. D.; Felsenheimer, C.; von Lilienfeld, O. A.; Tavernelli, I.; Rothlisberger, U. Phys. Rev. B 2007, 75, 205131. [28] Del P´opolo, M.; Voth, G. J. Phys. Chem. B 2004, 108, 1744–1752. [29] Seddon, K. R.; Stark, A.; Torres, M.-J. Pure Appl. Chem. 2000, 72, 2275–2287. [30] Cammarata, L.; Kazarian, S. G.; Salter, P. A.; Welton, T. Phys. Chem. Chem. Phys. 2001, 3, 5192–5200. [31] Huddleston, J. G.; Visser, A. E.; Reichert, W. M.; Willauer, H. D.; Broker, G. A.; Rogers, R. D. Green Chem. 2001, 3, 156–164. [32] Schr¨oder, U.; Wadhawan, J. D.; Compton, R. G.; Marken, F.; Suarez, P. A. Z.; Consorti, C. S.; de Souza, R. F.; Dupont, J. New J. Chem. 2000, 24, 1009–1015. [33] Widegren, J. A.; Saurer, E. M.; Marsh, K. N.; Magee, J. W. J. Chem. Thermodyn. 2005, 37, 569–575. [34] Seddon, K. R.; Stark, A. Green Chem. 2002, 4, 119–123. [35] Kim, D. W.; Hong, D. J.; Seo, J. W.; Kim, H. S.; Kim, H. K.; Song, C. E.; Chichon, D. Y. J. Org. Chem. 2004, 69, 3186–3189. [36] Amigues, E.; Hardacre, C.; Keane, G.; Migaud, M.; O’Neill, M. Chem. Commun. 2006, 72–74. 9
[37] Weng, J.; Wang, C.; Li, H.; Wang, Y. Green Chem. 2006, 8, 96–99. [38] Li, C.; Zhao, Z. K. Adv. Synth. Catal. 2007, 349, 1847–1850. [39] Li, C.; Wang, Q.; Zhao, Z. K. Green Chem. 2008, 10, 177–182. [40] Hanke, C.; Lynden-Bell, R. J. Phys. Chem. B 2003, 107, 10873–10878. [41] Morrow, T. I.; Maginn, E. J. J. Phys. Chem. B 2002, 106, 12807–12813. [42] Kossmann, S.; Thar, J.; Kirchner, B.; Hunt, P. A.; Welton, T. J. Chem. Phys. 2006, 124, 174506. [43] Lynden-Bell, R. M. Phys. Chem. Chem. Phys. 2010, 12, 1733–1740. [44] Hill, W. E.; Silva-Trivino, L. M. Inorg. Chem. 1978, 17, 2495–2498. [45] Hill, W. E.; Silva-Trivino, L. M. Inorg. Chem. 1979, 18, 361–364. [46] Kilian, P.; Slawin, A. M. Z.; Woollins, J. D. Chem. Eur. J. 2003, 9, 215–222. [47] Reiter, S.; Nogai, S.; Karaghiosoff, K.; Schmidbaur, H. J. Am. Chem. Soc. 2004, 126, 15833–15843. [48] Bauer, S.; Tschirschwitz, S.; L¨onnecke, P.; Frank, R.; Kirchner, B.; Clarke, M. L.; Hey-Hawkins, E. Eur. J. Inorg. Chem. 2009, 2009, 2776–2788.
10