had an estimated life expectancy at birth of 33.6 years in 1936-46 (Walle and Page 1969). ... (1939-41), 45.8 years in Venezuela (1942-42), and 46.9 years in Japan .... Kenya, Libya, Madagascar, Maldives, Nigeria, the Occupied Palestinian ... Tajikistan, the United Arab Emirates, Vanuatu, and Western Sahara in 1950 also ...
Malmberg, Bo & Thomas Lindh
Forecasting global growth by age structure projections
Arbetsrapport/Institutet för Framtidsstudier; 2004:5 ISSN 1652-120X ISBN 91-89655-53-2
Forecasting global growth by age structure projections Bo Malmberg and Thomas Lindh Institute for Futures Studies Stockholm
Demographic projections of age structure provide the best information available on long-term human resources and demand. In current data fairly robust correlations with GDP and GDP growth have been discovered. In this paper we use these two facts and study the forecasting properties of demographically based models. Extending the forecasts to 2050 suggests that due to fertility decreases poor countries of today will start to catch up with developed economies in which the growth process will stagnate due to the growth of the retired population.
Forecasting global growth by age structure projections Will the current income gaps between the developed and the developing world persist or will we have a long-run convergence between different parts of the world? This question has been thorougly researched in cross-country convergence studies over the last two decades where a rather pessimistic view has emerged. Given current structures the indication is that convergence only takes place within certain clubs of countries like the OECD, while the poorest part of the world is actually diverging relative to the developed countries. Of course, the conclusion is not that the poverty of some countries is ordained by destiny, but rather that drastic internal structural change combined with international aid and pressures is needed in order to bring an end to the extreme poverty in the world. Based on rather fragile empirical evidence factors such as technological change, human capital, free market institutions and strict budgetary discipline, just to mention a few, have been more or less emphasised in the debate. Long-term projections of income have been hard to achieve from these hypotheses, since the implied driving forces are hard to measure and even harder to project into the future. This paper draws on another fundamental force driving growth: demographic change (Malmberg 1994; Kelley and Schmidt 1995; Bloom and Williamson 1997; Higgins and Williamson 1997;
Lindh and Malmberg 1999). This is a variable that is relatively easy to measure, and can be projected into the future with at least reasonably low uncertainty for long periods of time. Our focus on demography doesn’t mean that the importance of other factors is downplayed. However, access to population projections makes forecasting based on demographic factors more straight forward then, for example, forecasting based on the effects of institutional change. The focus in this paper is on evaluating the forecasting performance of demographically based models. We estimate demographically based models of income as a function of age structure, urbanization and life expectancy, and test their statistical properties both in and out of sample. Finally we use UN projections of age structure to derive forecasts of global income levels and the evolution up to 2050. Our conclusion is that such forecasts behave reasonably well in predicting income and in the long term shows promise to be a much safer method than any available alternative method. The longrun forecasts also indicate that, as a consequence of the demographic age transition, primarily decreasing shares of children and increasing longevity, developing countries (with the possible exception of AIDS inflicted countries in sub-Saharan Africa) will tend to grow faster and thus start converging to the income levels of the developed world. Although the contribution of this paper is intended to be in forecasting it is of some importance to make clear that the use of age structure variables for income forecasting does have an extensive theoretical and empirical foundation, so the first section of the paper is devoted to an account of the facts and theories behind the demographic age transition and its impact on the economy. Section 2 presents the estimated model and the forecast. The concluding section argues that our forecasts inspire confidence in a rather bright global future.
1. Starting point: The demographic transition What we now know as the demographic transition was discovered in the second quarter of the 20th century by demographers observing the variation of death rates and birth rates across countries and over time. The finding was that …in the Western cultural area there has been a general process of change from the relative population stability at high levels of mortality and fertility to the slowing growth or actual decline of population numbers at low levels of mortality and fertility which characterized the interwar period. The initial effect was a decrease in mortality, leaving largely intact the large family
pattern. For reasons that are not entirely clear a small family pattern became not only an ideal but a goal realized by increasing proportions of the population. Birth rates fell rapidly, at first in cities, later in the surrounding rural areas. (Taeuber 1945) The prerequisite for this observation was increasing efforts to assemble demographic data from the 19th century and onwards that had made available time-series stretching over multiple decades or longer. Researchers in the inter-war era, thus, could base their analysis of population trends on a comparatively rich empirical material. However, the concept of demographic transition was not only used as a name for an empirical pattern. Instead the researchers who introduced the term saw these trends in mortality and fertility as the expression of an underlying social transformation process. Moreover, their conclusion from observing similar demographic trends in different countries was that the process of demographic transition would not be restricted to Europe but would spread also to other parts of the world. In fact, Irene B. Taeuber's original formulation of the transition idea appears in a paper that analyses the population development of Southern and Eastern Asia. In 1945 the idea that the world would witness demographic transitions throughout Asia, Africa and America was basically a scientific hypothesis yet to be verified or falsified. The key assumption behind this hypothesis was essentially a belief that the technologies giving rise to lower mortality would continue to spread to those parts of the world that still suffered from high mortality levels. Developments after 1945 have demonstrated that this assumption was wellfounded, although even proponents of the transition hypothesis soon became surprised by the amazing decline of mortality in underdeveloped areas (Kingsley Davis, 1956). Today, almost 60 years later we can conclude that the demographic transition hypothesis has proved to be correct. First, the mortality decline observed in the Western world and in parts of Asia before 1945 has indeed spread to practically all parts of the world. Before 1945 the life expectancy at birth in many non-Western populations were appreciably below 40 years. In India 1941-50 and also in Mauritius 1942-46, for example, the expectation of life at birth has been estimated to be only 32 years (Stolnitz 1965). Similarly, the Bantu population of South Africa had an estimated life expectancy at birth of 33.6 years in 1936-46 (Walle and Page 1969). Life expectancy in China was lower still: data on the Chinese farmer population in 1929-31 indicate values of 28.1 years in North China and 24.2 years in South China (Barclay, Coale et al. 1976). In
other parts of the world the picture was somewhat brighter with male life expectancy at birth at 40.9 years in Chile (1940), 41.1 years in Taiwan (1936-41), 42.1 years in Egypt (1937) (Toppozada 1968), 44.5 years in Trinidad and Tobago (1930-32), 45.1 years in Puerto Rico (1939-41), 45.8 years in Venezuela (1942-42), and 46.9 years in Japan (1935-36) (Stolnitz 1965). After the Second World War life expectancy in these countries has risen dramatically. The most impressive gains have been made in China. In 1999 the World Bank estimated a life expectancy at birth of 70 years. That is a gain of 44 years compared with the life expectancy for the Chinese farmer population around 1930. Japan, Taiwan and Chile have gains in life expectancy around 35 year. The gains in India, Puerto Rico, and Trinidad Tobago are around 30 years whereas Egypt and Venezuela have gained about 25 years. Also in South Africa there was a 23 years gain in lifeexpectancy up to 1980 but nine years of this gain has been lost between 1980 and 1999 primarily because of AIDS related deaths. Of the large world regions (East Asia & Pacific, Europe & Central Asia, Latin America & Caribbean, Middle East & North Africa, South Asia, and SubSaharan Africa) only Sub-Saharan Africa now, despite a substantial increase, has a lifeexpectancy at birth below 50 years. In the rest of the world life expectancy is above 60 years. Also the second prediction of the demographic transition hypothesis---that birth rates for an extended period will stay high when the death rates have begun to decline---has proved correct. Using UN data (World population prospects---the 2000 revision) this process can be most easily traced in African countries like Kenya, Ethiopia and Nigeria where falling death rates and relatively stable birth rates lead to accelerated population growth during the 1950s, 1960s, and 1970s. However, the starting point of the UN data is the 1950-54 period which means that this data set doesn't capture the dramatic decline in death rates that followed in the first few years after 1945. According to a study by Kingsley Davis, based on 18 underdeveloped areas, not chosen because they had unusual declines in mortality but because they were representative of different areas and had fairly constant boundaries and a relatively continuous series of registered death statistics the total decline in the crude death rate between 1935 and the 1950-54 period can be estimated to 58%, with the largest part of the decline coming after 1945. This large decline up to the 1950-54 period implies that the UN data gives us a picture of what is happening to the population directly after a sharp mortality reduction. If Kingsley Davis' estimate is correct---and assuming stable birth rates--- the population growth rate in the less developed countries (UN, 2001 definition) would have accelerated from 0.3% annually in 1935 to 2.1% in 1950-54. This
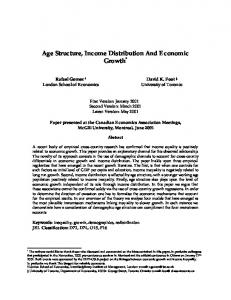
growth rate was the result of a crude birth rate of 44.6 and a crude death rate coming down from 41.2 to 24.1. Declining death rates, thus, led to accelerated population growth exactly as the Princeton demographers had predicted. Towards the end of the 1960s the death rate of the less developed countries had declined a further 9 points but the birth rate had only declined by half us much. Population growth in the less developed countries, thus, had accelerated further and now stood at 2.5% annually. The end of the 1960s, then, was a time when the transition hypothesis did not seem to be correct. Had not the hypothesis assumed that declining death rates would be followed by lower birth rates? And, what would happen if birth rates remained high? This, thus, was also a good time for dooms-day predictions concerning the future of the earth and its population (Ehrlich 1968; Ehrlich and Ehrlich 1970). Not everyone lost their nerves, though. The UN forecasters continued to base their projections on the assumption of a slow but continuing fertility decline that would bring down the population growth rate. And---as it turned out---the UN forecasters were right. Between 1965-69 and 1970-74 there came an important shift in the population trend as growth rates in Eastern Asia and South-Eastern Asia started to decline. This had happened in Korea and in Latin America already some years earlier but it was with the Asian turn-around that the shifting trend became globally significant. Later in the 1970s population growth rates started to decline in Southern Africa and in the mid 1980s, population growth began to slow also in North Africa, Western and South Central Asia. In the early 1990s, it happened in Western Africa and in Eastern Africa too, although in the latter case this slowdown was partly due to an increase in the death rates. And at the end of the 1990s, Middle Africa also seems to have passed its peak in the population growth rate. A more detailed view of factors behind the downward trend in population growth comes from a look at how the total fertility rates have developed after 1950. In Figure 1 , the most important patterns of fertility change in the world between 1950 and 2000 are outlined. Countries with a similar pattern of fertility change have been grouped together and for each year the mean fertility rate in each group has been calculated. Figure 1 shows clearly that fertility rates differ much across the world and that there are different patterns of fertility change. However, there are also strong common trends. In all groups, except two, fertility has gone down since 1950 although at different rates.
Only two groups have a record of no significant decline in mortality. In these groups we find a number of very poor countries many of which have experienced strong social disruption: Afghanistan, Angola, Burkina Faso, Burundi, Ethiopia, Liberia, Malawi, Mali, Niger, Somalia, Uganda, and Yemen all belong to the group where the total fertility rate still is close to 7 children per woman. Also for Bhutan, Cameroon, the Central African Republic, Chad, Congo, the Democratic Republic of the Congo, Equatorial Guinea , Gambia, Guinea-Bissau, Lao People's Democratic Republic, Mauritania, Mozambique, Namibia, and Pakistan there has been very little change in the total fertility rate, almost constant around 6 children per woman. Another group for which the fertility rate in 1995-1999 still is very high, around 5.4, is made up by Benin, Comoros, Côte d'Ivoire, Djibouti, Eritrea, Ghana, Guatemala, Guinea, Iraq, Jordan, Kenya, Libya, Madagascar, Maldives, Nigeria, the Occupied Palestinian Territory, Oman, Rwanda, Saudi Arabia, Senegal, Solomon Islands, Sudan, Swaziland, the Syrian Arab Republic, Togo, the United Republic of Tanzania, Zambia, and Zimbabwe. For this group starting with a TFR of 7 in 1950, there has, however, been an appreciable reduction in the fertility rate, especially since 1980. A trend which, if we are to judge from the development of other groups, can be expected to continue. The group consisting of Algeria, Bangladesh, Belize, Bolivia, Botswana, Cape Verde, Egypt, Honduras, Iran (Islamic Republic of), Mongolia, Morocco, Nicaragua, Philippines, Qatar, Samoa, Tajikistan, the United Arab Emirates, Vanuatu, and Western Sahara in 1950 also had an average TFR of 7 but by the end of the 1990s the average rate had been reduced to 3.8, a very considerable reduction The three groups Bahrain, Brunei Darussalam, Colombia, Costa Rica, the Dominican Republic, Ecuador, El Salvador, Fiji, India, Kuwait, Malaysia, Mexico, Myanmar, Peru, Saint Lucia, South Africa, Tunisia, Turkey, Turkmenistan, Uzbekistan, Venezuela, and Viet Nam starting at a TFR of 6.5, followed by Albania, Brazil, French Polynesia, Guyana, Indonesia, Lebanon, Panama, Suriname, and Thailand starting at TFR at 6.0, and finally Azerbaijan, Chile, China, Guadeloupe, Martinique, Mauritius, the Republic of Korea, Réunion, Sri Lanka, Trinidad and Tobago also starting at a TFR of 6.0 have essentially tracked one another with respect to the fertility decline and arrived at mean TFR rates of 3.0, 2.5, and 1.9 respectively in the late 1990s. In the group Armenia, Bahamas, Barbados, Bosnia and Herzegovina, Hong Kong, Macao, Cuba,
Ireland, Israel, Kazakhstan, the Netherlands Antilles, Puerto Rico, and Singapore with a mean TFR in 1950 of about 4.6 has fallen to 1.9. The last two groups, with 1950 TFRs of 3.5 and 2.5 consists largely of developed countries that already in the beginning of the period had completed the classical fertility transition. What we can see in Figure 1, then, is a quite impressive corroboration of the demographic transition hypothesis. To be sure, some countries have yet to enter the phase of fertility decline and others have a long way to go before they reach replacement fertility, that is, a level of TFR slightly above 2 that in the long run keeps a population constant. But the patterns of fertility change during the last fifty year strongly suggests that a continuing fertility decline in today's high fertility countries is to be expected. The Princeton hypothesis of a demographic transition affecting countries all over the world, thus, has turned out to be one of the most successful predictions made by social scientists in the 20th century.
The age transition In the 1990s different scholars have pointed out that population growth will not be evenly distributed across the different age groups during the demographic transition (Chesnais 1990; Chesnais 1992). On the contrary, as the demographic transition unfolds the growth rate of different age groups will follow an uneven pattern (Malmberg and Sommestad 2000). In some periods during the transition population growth will be concentrated to the youngest part of the population. In other periods the young adult, middle aged, or old age population segments are increasing most rapidly. This implies that population growth will give coherent effects on per capita income only if it is correct that the economic effects of population growth are the same irrespective of whether it is children, young adults, middle aged adults, or old age adults that are increasing in numbers (Bloom, Canning et al. 2003). Even as a scientific simplification that seems to be a rather far fetched hypothesis.
How does age structure change during a demographic transition? This question can be answered both empirically and through the use of demographic models. As it turns out, both methods give very similar results, at least over long periods with moderate levels of immigration and emigration. The typical pattern of a mortality decline followed---after a lag---by declining fertility will generate a very distinct pattern of age structure change. This pattern can be observed in most countries affected by a demographic transition. One way to
summarize is to distinguish four different phases of population growth during the demographic transition: The first phase following the onset of mortality decline is characterized by an increase in the number of children. The primary reason for this is that in high mortality regimes it is among newborns, infants and young children that the death toll is especially high. So when mortality comes down it is to a large extent the lives of the very youngest that are spared. In time, this increase in the number of children will also increase the young adult fertile population and---as long as fertility rates are unchanged---this will, by inducing more births, further accelerate the increase in the number of children. This first child-rich phase of what can be called the age transition will continue as long as the fertility rate remains high. The fertility decline eventually slow down the increase of the child population. The second phase is characterized by an expansion of the young adult population. The mechanism behind this expansion is simply that with declining mortality, and later an increase in the number of births, the number of surviving individuals in each cohort will increase. As these ever larger cohorts reach adult ages the young adult population will start to expand. Because it takes time for newborns to reach adult age the young adult phase will start 15-20 years later than the child-rich phase and it will continue 15-20 years after the expansion of the child population has stopped. The third phase is characterized by an expansion of the middle aged population. This phase starts when the cohorts enlarged by mortality decline and increases in the number of births reach the middle ages. Depending on how one defines ``middle age'' this expansion is initiated 20-30 years after the young adult phase starts. It thus takes four to five decades or more before the mortality decline of a demographic transition produces an appreciable increase in the number of middle aged. The fourth phase, finally, is reached when the enlarged cohorts reach retirement and is characterized by an expansion of the old age population. Often, this expansion starts after the fertility rates have dropped to a low level and this means that the old age phase, and also at least part of the middle age phase, lies outside the time span that we normally consider when we talk about the demographic transition. In Sweden, for example, the classic transition was complete in the 1930s when the total fertility rate had come down to, or even below, the replacement level.
The middle age phase of the age transition, however did not end until about 1970 and the old age phase continued for another two decades. Two things should be noted about the age transition. First, as pointed out above, the age transition as a phenomenon extends for a considerably longer period than the classical transition. This implies that the demographic transition, because of population momentum, will have social and economic effects also when there are no longer any current changes in the vital rates. Second, it is important to remember that, to some extent, the phases of the age transition will overlap. Depending on for how long later cohorts keep getting larger than earlier cohorts this time of overlap may be short or long. The fact that countries with large differences in terms of historical traditions, climate, and geography have gone through demographic transitions that in terms of changing mortality and birth rates have been similar is certainly a challenge to social science. In this study---where the purpose is not to explain why demographic transitions have occurred but to utilize the effect the transitions have on income growth---the existence of numerous instances of demographic transitions in very different contexts is, however, a great advantage creating variation and correlations that can be exploited to forecast income.
The global geography of age transitions How then, has the age transition affected the population structure in different parts of the world. One way to illustrate this is to use the UN data that gives both an account of estimated age structures for the 1959-2000 period and population structure forecasts for the 2000-2050 period (for details see Malmberg & Sommestad, 2000b). Given that the UN provides data for more than 200 different regions and 17 to 20 five year age groups for a 100 years period implies that it can be hard to get a grip on how the age structure is changing. However, by the use of cluster analysis it is possible to extract a smaller number of characteristic age structures that will capture the typical age distributions that different population will demonstrate as they go through the age transition, see Figure 2a och 2b. These typical age structures can be associated with different phases of the age transition. Figure 3 shows, using these typical age patterns, how age structure in the world will change in the next 50 years according to the UN forecast. The remarkable thing is that there will be very drastic changes in the age structure during the next 50 years, especially in regions with a large share of
developing countries. The question now is if these projected changes in the age structure can be used to forecast future levels of per capita income? One indication of this possibility is given in Figure 4 that shows the per capita income level in countries assigned to the different age structure types of the cluster analysis. Old countries are rich countries whereas young countries are poor countries. The UN predicts that many of the young countries will become old countries.Does this imply that they also will become rich? If we believe that the income patterns in Figure 4 will remain true also in the next 50 years then Figure 3 , showing how regions of the world passes from one type of age pattern to another, also gives an indication of how per capita incomes will change.
From recent empirical growth literature we also know that there is a robust association between age structure and economic growth, where dependent groups tend to depress growth and the working age groups tend to enhance it. At present it is not clear which mechanisms these associations rely on. Obviously there should be a direct labor supply effect making the economy grow faster as the working age groups increase the fastest, but just as obviously the home bias in the relation between domestic saving and investment, should make capital accumulation easier when a large part of the population are in the middle age phase. There are indirect effects through the public sector finances since revenue and public consumption and transfers are asymmetrically distributed with respect to age. There are also more long-run mechanisms where for example increasing longevity provides incentives both for retirement saving and increased human capital accumulation. Several other factors having to do with age-specific demand and income patterns could also be invoked as parts of the explanation. Here we do not go further into this discussion. but are satisfied that there are good solid reasons why we should expect a correlation of GDP growth and age structure.
2. Using demographic transition theory to forecast global income growth The model we will estimate three demographic factors that influence economic development: Mortality, age structure and urban structure. Each of these factors are closely connected to the demographic transition. Declining mortality is what triggers the demographic transition. Age structure change is, as argued above, a process that necessarily accompanies the transition.
Urbanization, finally is a spatial redistribution of the population that also has characterized all countries undergoing demographic transition. All these three factors have also been focused in the discussion of the last decade concerning the determinants of national economic growth. Our aim is to analyze if we in historic data can find such stable correlations between economic development, mortality, age structure and urban structure that allow us to forecast future trends in income growth. The model we have chosen to estimate deviates from the basic model in equation in the following ways: 1) Log per capita income is assumed to be a quadratic function of life expectancy at birth. The relation between development and life expectancy is non-linear. Although the best fit seems to be a kinked linear relation to life expectancy this is hard to use for forecasting but a quadratic function should capture at least some of the same features. 2) Log per capita income is assumed to be positively influenced by a well-developed urban system as measured by the population size of the largest city (in logs). However, urbanization effects are allowed to differ between countries at different levels of mortality. The positive effect of urban size on economic development has long been a staple of regional development theory. During the 1990s it has also received new interest from leading economists. To measure urbanization by the size of the largest city is, however, to our knowledge a new approach, as well as the idea that city system effects can differ according to the level of mortality. 3) Log per capita income is influenced by shifts in the age structure of the population. The relations between age structure and per capita income are allowed to change at different levels of mortality. Depending on whether developed or developing countries have been focused there has been some differences in what age groups that seem to be the most important for influencing economic development. Moreover, theoretical research on the effect of life expectancy on the optimal length of education, fertility, saving and retirement decision indicate that the economic life cycle should change in response to changing mortality. This implies that it can be misleading to assume that the profile of age structure effects on per capita income will be the same in countries at different mortality levels. Rather we would expect the pattern to shift with life expectancy. To capture this our specification allows for an
interaction between age effects and a quadratic function of life expectancy. 4) Recent observations have been given a larger weight than early observations. Through the use of this weighting procedure the estimate of the country specific intercept will be more strongly influenced by conditions in the later part of the estimation period. Given that we have structural change in the relations this is important when the purpose is forecasting.
Results Table 1 presents the results obtained by estimating the model presented above. All the parameters refer to the same model. Column 1 gives the results for the direct effects. Column 2 gives the parameter estimates obtained for interactions with life expectancy at birth. Column 3 gives the results from interactions with life expectancy squared. Of the 20 parameter estimates presented in the table 1 all except 5 are significantly different from zero at the 5 %-level. The estimates show that life expectancy, as expected, is directly correlated with per capita income. However, the estimates also confirm the hypothesis that life expectancy modifies the effect of demographic structure. Thus, a well developed urban system has a positive effect on per capita income, but only when life expectancy rises above 62 years. Life expectancy also modifies the effects of age structure. The estimates show that, as expected, there is a strong negative effect on per capita income from high levels of child dependency. The strongest negative effect of child dependency is found when life expectancy is around 60 years. With further increases in life expectancy the effect becomes somewhat weaker but it is still negative when life expectancy has reached 75 years. The effect of young adults is much less negative. This implies that per capita income will improve when child dependency declines and the share of young adults increases. However, as life expectancy increases above 70 years the effect of the young adult share becomes negative. This might indicate that increasing length of education in low mortality populations reduces the income boosting effect of young adults. A surprising result is that in high and medium mortality populations (life expectancy < 65 years) there is an effect on per capita income of young middle-aged adults (30-49 years) almost as negative as the effect of children. When life-expectancy increases above 70 years, however, a high share of people aged 30-49 years becomes a strong booster of per capita income. A negative effect of prime aged adults seems counter-intuitive but there are, at least, two possible substantive
explanations. One is that adults aged 30-49 are the primary care takers of dependent children. Since most high and medium mortality populations still have high fertility rates this age group, therefore, may face severe time restrictions with respect to their participation in market activities. A second possibility is given by the fact that a high share of young middle aged adults in populations with moderate and low life expectancy is associated with increased risk for severe disturbances to the social order like revolts, riots and civil war. It remains far from clear what lies behind this association but the existence of such a pattern would explain why a high share of people aged 30-49 does not give rise to the expected positive effects on per capita income. However, we cannot at this point ignore the possibility that it is simply a statistical artefact due to the high negative correlation between this group and the age share of children. The 50-64 group follows a similar but less pronounced pattern. A weak negative effect when E0 is around 60 turns positive when life expectancy increases above 75 years. For the old age share the effect is negative but the estimated parameters are small. To some extent this reflects the use of log shares. In populations with few old age people small percentage point increases in the old age share translates into large increases in the log share. One way to summarize these findings is to note that at low and medium levels of life expectancy the age effects on per capita income are dominated by the balance between children and young adults. Child-rich populations tend to be poor whereas countries with declining child dependency and an expanding young adult population enjoy rising per capita income. At higher levels of life expectancy it is instead a high share of middle age adults (30-49 and 50-64 years old) that ensure good economic prospects. The hypothesis that changing life expectancy can alter the profile of age structure effects has, thus, been corroborated.
Table 1 does not give the estimated country effects. These are displayed in Figure 5 which shows that a substantial part of the variation in per capita income is captured by the country effects. These strong country effects underscore that demography is not the only factor that determines per capita income. However, the success of demographic transition theory gives us strong reasons to believe that population forecast based on the transition hypothesis are relatively reliable. Therefore, a forecast of future changes in per capita income based on the model presented here can provide a picture of possible global trends that are consistent with historical correlations between demographic and economic change. Performing an out-of-sample experiment by estimating the model on data up to 1990 and then comparing forecasts to actual outcomes we get the results in Table 2. What we can observe here is that there is a slow increase of errors with the horizon. Judging from the mean errors we have not much problem with systematic bias in the forecasts.
Forecasts Below the 2000-2050 forecasts per capita income for 13 different countries are presented. These forecasts are all based on the medium variant of World Population Prospects: The 2000 Revision. The fertility assumptions applied by the Population Division in the medium variant are reproduced in appendix A. According to the Population Division mortality in the medium version is projected on the basis of the models of change of life expectancy produced by the United Nations. In countries highly affected by the HIV/AIDS epidemic, estimates of the impact of the disease are made explicitly through assumptions about the future course of the epidemic, that is, by projecting the yearly incidence of HIV infection. The Population Division provides predicted values for the variable "population in the largest city" only up to 2015. Because of this the forecast we present below is based on a separate projection. This projection is based on an interpolation of observed country-specific growth rates for the population in the largest city. This observed growth rate has been adjusted for effects on the growth rate from shifts in the growth rate of the 0-14 age group, the 50-64 age group and the share of the 0-14 age group as well as allowing for a time-trend in the growth rates for the population of the largest city.
One characteristic of the forecasts is that they not are based on the assumption of a given rate of technological change. One reason for this is that the 1960-1998 period didn’t demonstrate a clear trend across all countries. We have, therefore, chosen to present forecasts without the addition of a technology trend. These forecasts have been produced for 82 countries. Countries for which no forecast have been made are either not included in our original sample or do not have values available for the size of their largest city in UN's Urbanization prospects. The parameter values used in the forecast are those that are presented in Table 1 and Figure 5. One important modification, however, is that in the forecast the maximum value of life expectancy has been fixed to 76 years. The motivation for this is that in the sample used for estimating the model only a few countries have experienced life expectancies above 76 years for an extended period. As a consequence, there is no information about how increased life expectancies beyond 76 years will affect economic growth. In the forecast we present, this lack of knowledge is represented by an assumption that countries with a life expectancy above 76 years will behave in a way similar to countries that have only a life expectancy of 76 years. The general pattern is that developed countries will tend to stagnate while developing countries will tend to take off on a growth path is confirmed. The exceptions are mainly in Sub-Saharan Africa and due to the AIDS epidemic and continuing high fertility in the UN forecast.
3. Conclusion: A better world Using demographic projections we evaluate forecasting models for GDP per capita based on demographic information. The result is that the currently aging developed countries will experience a stagnating or even negative growth trend in income. Most developing countries will, however, experience accelerating growth and converge towards the income levels of the developed world. The main exceptions to this are to be found in sub-Saharan Africa where the impact of AIDS on the age distribution is expected to postpone any growth take-off. Thus we expect that demographic change and the demographic gift following from decreased fertility rates will substantially decrease the share of people living in extreme poverty in the world. The negative aging effects on developed countries do not imply any catastrophic decrease of living standards. The futures scenario that appears from this forecasting exercise is thus a rather bright one, where economic prosperity and equality increases and fewer people will live in
extreme poverty. In the absence of contrary evidence we therefore find that demographic projections indicate a better world within the next half century.
References Barclay, G. W., A. J. Coale, et al. (1976). "A Reassessment of the Demography of Traditional Rural China." Population Index 42(4): 606-635. Bloom, D. E. and J. G. Williamson (1997). Demographic transitions and economic miracles in emerging asia, National Bureau of Economic Reseach. Bloom, D. E., D. Canning, et al. (2003). The demographic dividend : a new perspective on the economic consequences of population change. Santa Monica, Calif., Rand. Chesnais, J. C. (1990). "Demographic-Transition Patterns and Their Impact On the Age Structure." Population and Development Review 16(2): 327-336. Chesnais, J. C. (1990). "Demographic-Transition Patterns and Their Impact On the Age Structure." Population and Development Review 16(2): 327-336. Ehrlich, P. R. (1968). The population bomb. New York,. Ehrlich, P. R. and A. H. Ehrlich (1970). Population, resources, environment : issues in human ecology. San Francisco, W.H. Freeman. Higgins, M. and J. G. Williamson (1997). "Age Structure Dynamics in Asia and Dependence on Foreign Capital." Population and Development Review 23(2): 261-93. Kelley, A. C. and R. M. Schmidt (1995). Saving, Dependency and Development, Duke U; U Richmond. Lindh, T. and B. Malmberg (1999). "Age structure effects and growth in the OECD, 1950-1990." Journal of Population Economics 12: 431-449. Malmberg, B. (1994). "Age structure effect on economic growth: Swedish evidence." Scandinavian Economic History Review 42: 279-295. Malmberg, B. and L. Sommestad (2000a). "The Hidden Pulse of History: Population and Economic Change in Sweden, 1820-2000." Scandianvian journal of history. Malmberg, B. and Sommestad L. (2000b). Heavy trends in global developments. Working paper 2000:1. Stockholm, Institute for Futures Studies. Stolnitz, G. J. (1965). "Recent Mortality Trends in Latin America, Asia and Africa: Review and Re-interpretation." Population Studies 19(2): 117-138. Taeuber, I. B. (1945). "The Demographic Statistics of Southern and Eastern Asia." Journal of the American Statistical Association 40(229): 29-.37 Toppozada, H. K. (1968). "Progress and Problems of Family Planning in the United Arab Republic (in Part II. Fertility Control Programs in Africa and the Near East)." Demography 5(2): 590-597. United Nations. Dept. of Economic and Social Affairs (1963). World population prospects. New York, United Nations. United Nations (2001). World Population Prospects: The 2000 Revision, File 3: Crude Birth Rate by Major Area, Region and Country, 1950-2050 (per 1,000), Population Division, Department of Economic and Social Affairs.
United Nations (2001). World Population Prospects: The 2000 Revision, File 7: Crude Death Rate by Major Area, Region and Country, 1950-2050 (per 1,000), Population Division, Department of Economic and Social Affairs. United Nations (2001). World Population Prospects: The 2000 Revision, File 1: Total Fertility by Major Area, Region and Country, 1950-2050 (number of children per woman), Population Division, Department of Economic and Social Affairs. Walle, E. v. d. and H. Page (1969). "Some New Estimates of Fertility and Mortality in Africa." Population Index 35(1): 3-17. World Bank (2001). Mortality. World Development Indicators: 114-117.
Direct effect Intercept
E0
(E0-61,8)
(E0-61,8)^2
-0,3580 (-0,31) 0,0276 (5,24)
E0^2
-0,0009 (-3,75)
ln maxpop
-0,0004 (-0,02)
0,0095 (10,62)
.
lna014
-2,5880 (-6,75)
0,0392 (0,88)
0,0058 (3,45)
lna1529
0,2121 (0,83)
0,0079 (0,29)
-0,0025 (-2,34)
lna3049
-1,4792 (-7,25)
0,1012 (4,78)
0,0041 (4,39)
lna5064
-0,6598 (-5,03)
0,0211 (2,28)
0,0025 (4,54)
lna65
-0,1782 (-2,62)
0,0194 (3,00)
-0,0008 (-2,14)
F-ratio
204.306
1980-1998
0.146
Country effects RMSE
Table 1 Effects of life expectancy, urban structure and demographic structure on log per capita income.
Mean error
Mean absolute error
Root mean square error
1991
-0.033
0.148
0.194
1992
-0.041
0.162
0.208
1993
-0.050
0.180
0.238
1994
-0.050
0.195
0.265
1995
-0.033
0.214
0.282
1996
-0.022
0.226
0.302
1997
-0.005
0.231
0.314
1998
0.009
0.211
0.272
Table 2: Forecast errors for the model estimated at the sample 1950-1990. Average over the countries
8 7 6
Initial TFR 7.0, No declin Initial TFR 6.0, no declin Initial TFR 7.0, Slow
5
Initial TFR 7.0 Initial TFR 6.5
4
Initial TFR 6.0 Initial TFR 5.8
3
Initial TFR 4.5 Initial TFR 3.5 Initial TFR 2.5
2 1 0 1950
1960
1970
1980
1990
Figure 1 Different types of change in TFR 1950-2000.
2000
Five typical age structures for the period of 1950-2025
Age group
Figure 2a Different age structures in the world 1950-2050
80 +
0_ 4 5_ 9 10 _1 4 15 _1 9 20 _2 4 25 _2 9 30 _3 4 35 _3 9 40 _4 4 45 _4 9 50 _5 4 55 _5 9 60 _6 4 65 _6 9 70 _7 4 75 _7 9
Childrich Family age Modernization Middle-age Maturity
Advanced aging 8% 7% 6% 5% 4% 3% 2% 1%
Age group
Figure 2b: Different age structures in the world 1950-2050
80 +
75 _7 9
70 _7 4
65 _6 9
60 _6 4
55 _5 9
50 _5 4
45 _4 9
40 _4 4
35 _3 9
30 _3 4
25 _2 9
20 _2 4
15 _1 9
5_ 9 10 _1 4
0_ 4
0%
Changes in global age structure Region
East Africa Central Africa West Africa Southern Africa West Asia Central America North Africa South Asia Southeast Asia South America Caribbean East Asia Oceania Eastern Europe North America Western Europe Northern Europe Southern Europe
2000 Childrich Childrich Childrich Family age Family age Family age Family age Family age Family age Modernization Modernization Modernization Middle-age Middle-age Middle-age Middle-age Maturity Maturity
2015 Childrich Childrich Family age Family age Modernization Modernization Modernization Modernization Modernization Modernization Middle-age Middle-age Middle-age Maturity Maturity Maturity Maturity Maturity
Figure 3 Changes in global age structure 2000-2050.
2030 Family age Family age Family age Modernization Middle-age Middle-age Middle-age Middle-age Middle-age Middle-age Maturity Maturity Maturity Maturity Maturity Advanced aging Advanced aging Advanced aging
2050 Modernization Modernization Modernization Middle-age Middle-age Maturity Maturity Maturity Maturity Maturity Maturity Advanced aging Maturity Advanced aging Advanced aging Advanced aging Advanced aging Advanced aging
Per capita income (1990 USD) by type of age structure 12 000 10 000 8 000 6 000 4 000 2 000
C hi ld ric h Fa m ily M ag od e er ni za tio n M id dl eag e M at Ad ur va ity nc ed ag in g
-
Figure 4 Per capita income 1990 by type of age structure
Country effects
1
South Africa
New Zealand USA Canada
Argentina Mexico 0.5
Algeria Tunisia
Egypt Morocco
0
Cote d'Ivoire Zimbabwe Angola
Brazil Peru Costa Rica Uruguay El Salvador Chile Guatemala Colombia Bolivia Nicaragua Dominican Republic
Israel Australia Venezuela Singapore Hong Kong Iran Turkey
Switzerland Norway Netherlands Ireland Belgium Sweden Austria France United Kingdom Italy
Malaysia Jordan Japan Korea, Republic of
Spain Portugal Greece
Syria Philippines Thailand Pakistan Indonesia
Mozambique Congo
-0.5
Ghana Nigeria Zambia
Honduras
India
Haiti
Bangladesh
Romania
Madagascar -1
Kenya China Congo, Zaire Ethiopia Niger
-1.5
Uganda Tanzania Africa
World region
Figure 5 Country effects by world region
America
Asia
Europe
Forecast 2000-2050 35000
30000
25000
20000
15000
10000 Austria 5000
Sweden France Mexico
0 1990
2000
2010
2020
2030
2040
2050
2060
Figure 6a Population based forecast of per capita income 2000-2050, selected countries
Brazil Iran
Forecast 2000-2050 16000 14000 12000 10000 8000 6000 4000
Tunisia Philippines Indonesia
2000
Romania Cameroon
0 1990
2000
2010
2020
2030
2040
2050
2060
Figure 6b Population based forecast of per capita income 2000-2050, selected countries
China Ethiopia
Former Working Papers: • • • • • • • • • • • • • • • • • • • • • •
Arbetsrapport/Institutet för Framtidsstudier; 2000:1 Malmberg, Bo & Lena Sommestad. Heavy trends in global developments. Idea platform for MISTRA’s future strategy. Arbetsrapport/Institutet för Framtidsstudier; 2000:2 Malmberg, Bo & Lena Sommestad. Tunga trender i den globala utvecklingen. Uppdrag för Stiftelsen för Miljöstrategisk forskning (MISTRA). Arbetsrapport/Institutet för Framtidsstudier; 2000:3 Lee, Ronald, Mason, Andrew & Timothy Miller. From Transfers to Individual Responsibility: Implications for Savings and Capital Accumulation in Taiwan and the United States. Arbetsrapport/Institutet för Framtidsstudier; 2000:4 Mayer, David. On the Role of Health in the Economic and Demographic Dynamics of Brazil, 1980-1995. Arbetsrapport/Institutet för Framtidsstudier; 2000:5 Galor, Oded & Omer Moav. Natural Selection and the Origin of Economic Growth. Arbetsrapport/Institutet för Framtidsstudier; 2000:6 Malmberg, Bo & Lena Sommestad. Four Phases in the Demographic Transition, Implications for Economic and Social Development in Sweden, 1820-2000. Arbetsrapport/Institutet för Framtidsstudier; 2001:1 Lagerlöf, Nils-Petter. From Malthus to Modern Growth: Can Epidemics Explain the Three Regimes? Arbetsrapport/Institutet för Framtidsstudier; 2001:2 Sommestad, Lena. Education and Research in Times of Population Ageing. Arbetsrapport/Institutet för Framtidsstudier; 2001:3 Sommestad, Lena. Health and Wealth: The Contribution of Welfare State Policies to Economic Growth. Arbetsrapport/Institutet för Framtidsstudier; 2001:4 Westholm, Erik. Det utmanade lokalsamhället. Arbetsrapport/Institutet för Framtidsstudier; 2001:5 Westholm, Erik. Challenges for the Local Communities. Arbetsrapport/Institutet för Framtidsstudier; 2001:6 Sommestad, Lena i samarbete med Bo Malmberg. Demografi och politisk kultur. Ett ekonomiskt-historiskt perspektiv på ”den starka statens fall”. Arbetsrapport/Institutet för Framtidsstudier; 2002:1 Lundqvist, Torbjörn. Arbetskraft och konkurrensbegränsning: aktörsperspektiv på den svenska modellen och framtiden. Arbetsrapport/Institutet för Framtidsstudier; 2002:2 Simon, Paul. Demography and Finance – Finance and Growth. Arbetsrapport/Institutet för Framtidsstudier; 2002:3 Lundqvist, Torbjörn. Den starka alkoholstatens fall. Arbetsrapport/Institutet för Framtidsstudier; 2002:4 Olsson, Stefan. Vad är nytt under solen? Om problemet med att veta vad som är nytt i historien och samhället. Arbetsrapport/Institutet för Framtidsstudier; 2002:5 Andersson, Jenny. Alva’s Futures Ideas in the construction of Swedish Futures Studies. Arbetsrapport/Institutet för Framtidsstudier; 2002:6 Essén, Anna. Svensk invandring och arbetsmarknaden. Återblick och nuläge. Arbetsrapport/Institutet för Framtidsstudier; 2002:7 Barnekow, Erik. Demografi och finansmarknad – en översikt av empirisk forskning. Arbetsrapport/Institutet för Framtidsstudier; 2002:8 Karlström, Anders, Palme, Mårten och Ingemar Svensson. The Timing of Retirement and Social Security Reforms: Measuring Individual Welfare Changes. Arbetsrapport/Institutet för Framtidsstudier; 2002:9 Palme, Mårten och Ingemar Svensson. Pathways to Retirement and Retirement Incentives in Sweden. Arbetsrapport/Institutet för Framtidsstudier; 2002:10 Ranehill, Eva. Social snedrekrytering till högre studier. – En litteraturöversikt.
• • • • • • • • • • • • • • • • • •
Arbetsrapport/Institutet för Framtidsstudier; 2003:1 Korpi, Martin. Regionala obalanser – ett demografiskt perspektiv. Arbetsrapport/Institutet för Framtidsstudier; 2003:2 Rydell, Ingrid. Demographic Patterns from the 1960s in France, Italy, Spain and Portugal. Arbetsrapport/Institutet för Framtidsstudier; 2003:3 Dahlberg, Susanne & Ruth-Aïda Nahum. Cohort Effects on Earnings Profiles: Evidence from Sweden. Arbetsrapport/Institutet för Framtidsstudier; 2003:4 Malmberg, Bo & Thomas Lindh. Swedish post-war economic development. The role of age structure in a welfare state. Arbetsrapport/Institutet för Framtidsstudier; 2003:5 Essen, Anna. Kvarboende och äldrevård I hemmet med modern teknik. –Vad hämmar utvecklingen? Arbetsrapport/Institutet för Framtidsstudier; 2003:6 Ramstedt, Berith. Free movers som resurs och strategi –utländska studenter i det svenska utbildningssystemet. Arbetsrapport/Institutet för Framtidsstudier; 2003:7 Daumerie, Béatrice. What future for Europe? New perspectives in post-industrial fertility issues. Arbetsrapport/Institutet för Framtidsstudier; 2003:8 Thalberg, Sara. Demographic Patterns in Europe. A review of Austria, Germany, the Netherlands, Estonia, Latvia and Lithuania. Arbetsrapport/Institutet för Framtidsstudier; 2003:9 Wasmer, Etienne. Interpreting Europe and US labor markets differences: the specificity of human capital investments. Arbetsrapport/Institutet för Framtidsstudier; 2003:10 Hrdlicka, Anna. The future of housing and technology in Japan – the Connected Homes Group Study Tour. Arbetsrapport/Institutet för Framtidsstudier; 2003:11 Thalberg, Sara. Barnafödandets politik. – En analys av partiernas argumentation i nativitetsfrågan 1997-2003. Arbetsrapport/Institutet för Framtidsstudier; 2003:12 Westholm, Erik. Leaving Rurality Behind. Re-orientation of spatial policies in Sweden. Arbetsrapport/Institutet för Framtidsstudier; 2003:13 Amcoff, Jan. Regional befolkningsomfördelning bland unga och gamla. Arbetsrapport/Institutet för Framtidsstudier; 2004:1 Gartell, Marie & Håkan Regnér, Inkomstpremier av lärosäten för män och kvinnor som tog en examen under 1990-talet. Arbetsrapport/Institutet för Framtidsstudier; 2004:2 Barnekow, Carl, Diskriminering i den statliga sektorn? - En utvärdering av det statliga pensionssystemet. Arbetsrapport/Institutet för Framtidsstudier; 2004:3 Lundqvist, Torbjörn, Organised Interests, Labour Market and Migration: the Swedish Model. Arbetsrapport/Institutet för Framtidsstudier; 2004:4 Westholm, Erik, Modes of re-territorialisation, Spatial implications of regional competition politics in Sweden.
ISSN 1652-120X ISBN 91-89655-53-2