Development of space technologies in the Euro- .... Discmans from Sony, which entails that Apple became the ... development costs, proprietary knowledge,.
FORECASTING METHOD FOR DISRUPTIVE SPACE TECHNOLOGIES Paper for the Disruptive Technologies Convention, 8-11 June, Toulouse Egbert Jan van der Veen, University of Groningen, Netherlands
Abstract This paper documents a research initiative performed on Disruptive Space Technologies (DST) in the European space sector and elaborates on a method of forecasting them. The research was performed at the DLR in Bremen in co-operation with the University of Groningen as part of the Master thesis of the researcher. This research initiative is currently in its infancy and will be extended in the future. The theory of Disruptive Technologies (DTs), first introduced by Bower & Christensen (1995), explains the evolution of technologies which disrupt the status quo of both dominant technology platforms and competitive market layouts. It does this by having an alternate perceived performance mix, which is valued higher by the customer then the dominant technology. This research states that there is a difference between DTs as described in business literature and DTs for the space sector. This difference is caused by a fundamental difference in market dynamics. The paper explains the difference between the different innovation types and DTs. Based on these differences and the characteristics of the space sector, a new theory of disruptive space technologies will be developed. Based on this theory a tool will be constructed, which can be used as a forecasting method for these disruptive space technologies. It does this by researching indicators which indicate a potential for disruptiveness of technologies in the space sector. The indicators resulting from these categories will serve as criteria for a concept scoring matrix. This matrix will evaluate and compare several potentially disruptive space technology concepts with a dominant space technology. The result of this evaluation will be a forecast of the market layout of a specific space technology domain. Nevertheless, the purpose of this paper is not to deliver ready to use method, but rather to indicate the general direction in which further research could lead to a complete theory of disruptive space technologies and an accurate forecasting method.
INTRODUCTION
within a technology domain, because of their fundamental differences towards the previous dominant technology. To clarify this, Leifer et al. (2000) describes an incremental innovation as the exploitation of a technology, while radical innovation is the exploration of a new technology. Radical innovations and DTs are also called breakthrough technologies and examples of these for the space sector include: Wireless satellites utilize wireless communication for data transfer of sensors. This form of data transfer, although it does not have the same transfer capacity, it does decrease weight through the elimination of wires. Nanosats, Microsats and Cubesats are technologically less advanced then conventional satellites but provide a practical test bed for universities because of the use of commercial of the shelf electronics, and their absolute low cost compared to normal satellites. Spaceship two by Virgin Galactic is technological inferior to any rocket, because it reaches only space and not an actual orbit. It does however fulfill another perceived performance, which is the function of space tourism and a method of relative cheap long zero gravity testing.
Development of space technologies in the European space sector have resulted in many advantages for its citizens in the form of science, technology, navigation, health and many other areas. The European space sector is working continuously to improve these space technologies for its citizens in the future. Because of budget constraints, only a small portion of the technology concepts can be invested in. These technology concepts are mostly incremental innovations on the current dominant technology, which provide small improvements in the performance of a technology. According to Summerer (2009) this is partly caused because of a risk-adverse culture in the space sector, which leaves only a small margin of freedom for testing innovations in subsystems not strictly needed for achieving mission success. An opposite of incremental innovations are radical innovations. Radical innovations are innovations which cause a technology domain to make a leap in its performance evolution. These innovations have the potential to be more beneficial to the space sector in general then incremental innovations. Radical innovations are usually considered as totally new technologies
1
company, controlling the market with a dominant technology, is called an incumbent. The focus of the customer shifting from the capacity to the portability functional attribute is called a change in perceived performance. As can be seen in Figure 1, Christensen (1997) persist on measuring performance on one performance attribute; hard disk capacity, while actually the smaller disk drives are over performing on the basis of portability. This extra dimension in functional attributes in measuring performance for technologies was researched by Adner (2002).
Laser communications which have lower power, tighter focus/footprint, dramatically increased bandwidth, lighter weigh (Lambert, 1995). Nanotubes, have the possibility to form high strength, lightweight tethers or other materials. (Heide et al., 2009)
DISRUPTIVE TECHNOLOGIES A DT is an exception to the radical / incremental innovations theory, which Christensen (2002) calls; sustaining innovations because they continue serving the same customers with the intention to sustain their position in the market. Like a radical innovation, a DT is a new technology which replaces an old dominant technology. A DT however does this in an unusual manner, because in the beginning it actually ‘under performs’ compared to the dominant technology. This under performance is viewed from the current customer-perceived value and does not reflect the latent and future needs. The customerperceived value is the total value customers perceive of all the functional attributes of a technology. Functional attributes are performance indicators which a technology can be measured on, like speed, maneuverability, reliability, costs, quality. This is different for every customer and it is what divides the main market into market niches. DTs are usually first successful in a market niche and then through a process, which Christensen (1997) calls low-end encroachment, take over the main market. Low-end encroachment is caused by a change in perceived performance of customers over time. Perceived performance is the customer perceived value of the performance of a technology. In other words; it is a mix of performance attributes which a customer perceives as important for its needs. Figure 1 illustrates what this entails with an example of the rigid disk drive industry from Christensen (1997). This industry had several DTs in the form of different disk drives sizes. Even though bigger drives had relative a larger hard disk capacity, people still wanted smaller disk drives because they were more portable. This process coincided with the emergence of smaller computers and caused companies manufacturing the larger drives to be pushed out of the main market into the market niche of a higher market segment. The
Figure 1: Intersecting trajectories of capacity demanded versus capacity supplied in the rigid disk drives (Christensen, 1997)
Adner (2002) constructed a method to illustrate differences in perceived performance of different technologies and called them value trajectories which are composed in Figure 2. Value trajectories are technology domains which fulfill a certain type of perceived performance. The value trajectory passes through several indifference curves and shows the levels of performance requirements from different market segments on two different functional attributes. Indifference curves are the levels of minimal required performance of functional attributes. After a technology has fulfilled the performance required by
2
examples of that have a value trajectory and indifference curves in this graph are netbooks, laptops and tablet pcs. The phenomenon of changing value trajectories or changing perceived performance can also occur within one technology domain. For example automobiles were first primarily valued on speed, after which esthetics, functionality and safety became more important attributes, creating an indifference of most customers to speed. With respect to space, the first rockets were measured on capabilities while later reliability, safety and especially costs became more important.
this indifference curve, additional performance will be appreciated by the customer as long as he does not have to sacrifice on the performance of other functional attributes. So the customer is indifferent for further performance increase. For example; a customer of the Ikea will value a better quality of products as long as it means that it does not have to make any concessions on costs.
TECHNOLOGY EVOLUTION An S-Curve is the most common way to illustrate the evolution of a technology over time. Because of this, the S-Curve is often also referred to as a life cycle analogy tool. The S-Curve has three distinctive parts (Abernathy & Utterback 1978): o The fluid phase o The transitional phase o The specific phase These different phases are illustrated in Figure 6. The fluid phase depicts the slow progress in performance gain in the beginning because of little attention from researchers in the market. Technologies in this part are the radical or DTs, as they are a new technology which replaces an old technology or opens up a new market. The transitional phase is the phase where the new technology takes off. Argawal (2002) claims that there is an average of 42.3 years between the invention of a technology and its sales take-off. The specific phase is the phase in which the technology matures and reaches the end of its potential performance. Sahal et al. (1982) proposes that the rate of improvement in performance of a given technology declines because of limits of scale (e.g. things become either impossibly large or small) or system complexity (e.g. things become too complex to work perfectly). When these limits are reached, the only possible way to maintain the pace of progress is through radical/disruptive system redefinition.
Figure 2: Value trajectory by Adner (2002)
To clarify this matter, Figure 3 shows the different value trajectories and their indifference curves of the technology of stationary PCs and handheld PDAs with respect to the functional attributes storage capacity and portability. Product A is a PC which fulfills the high-end market segment while product B does the same thing for the PDA high-end market segment.
Figure 3: Value trajectory example by Adner (2002)
As can be seen, customers of a PDA technology are quickly satisfied with a low storage capacity while the portability attribute is valued much higher. The customers of the PC technology have an alternate perceived performance and value storage capacity higher then portability. Other
3
formance. This particular change was caused by external factors; the internet and flash technology. The combination of downloading songs from the internet and higher capacity, which was caused by incremental innovation in the technology of flash storage, proved to be a disruptive force in the market of portable music players. This market with the different types (Radical and Disruptive innovation) of innovations is illustrated in Figure 5. As can be seen in this figure, the technology development in a domain can be seen as a series of overlapping S-Curves or an envelope curve (Beer 1981). Figure 4: S-Curve with its different phases from Abernathy & Utterback (1978)
IPOD Touch/ Iphone
When the perceived performance changes in favor of the DT, it actually starts to over perform the dominant technology and eventually pushes it out of the market. This process is especially harmful for the incumbent. In the past there have been many examples of this, but arguably the most visible was the disruption in the portable music player’s technology domain. Sony Corporation dominated the market of portable music players with their CD-players or Discmans when Apple introduced their first MP3 player, the iPod. Although the iPod was not the first MP3 player, it was the first one to combine high capacity with an innovative user interface. Apple with their iPod eventually disrupted the Discmans from Sony, which entails that Apple became the biggest player in the market of portable music players, replacing Sony. So how did this happen? Why did Sony not come with its own version of an MP3 player? The problem originates in determining the perceived performance. Sony never thought MP3 players had a future, because in their infancy, MP3 players had major drawbacks of low capacity, low sound quality, the extra step of converting your CD into MP3 and no exchangeable data carrier. More than that, when they asked their current customers if they perceived the new technology as valuable, which they did not. So Sony perceived it as sensible not to invest in this new technology and invest in their Minidiscs instead. However, Sony did not reckon with a change in perceived per-
IPOD
Disruptive innovation
Discman
Cassete type tape Walkman
Radio cassette player Reel-toReel
Sustaining innovation
Sustaining innovation
Change in perceived performance
Disruptive innovation
Sustaining innovation
Change in perceived performance
Sustaining innovation
Time
Figure 5: Envelope curve of portable music players
DISRUPTIVE SPACE TECHNOLOGIES Even though there are many examples of DTs documented in business literature, none of these concern space technologies. After several interviews with experts of the space sector, the conclusion was made that the conventional theory of DTs is not entirely applicable to the market dynamics of the space sector. This is caused by the following reasons: o Time: The development of a space technology takes a long time; therefore the reponce time of incumbent to DTs is very high. They do this by either starting a development process of their own (if the development time permits it), or take over the company marketing the new technology.
4
o
o
o
o
o
Risk/Return on investment: The long development time of a space technology means that the return and risk on investment is equally high, this is a barrier for new start up companies. And prevents a start-up of becoming disruptive with an innovative idea. Investments: Space technologies often have a significant amount of money invested into them in the form of equipment purchases, development costs, proprietary knowledge, human capital etc. These non-recurring costs lead to a reluctance of incumbents to cannibalize existing technology developments for new technology developments (Kamien and Schwartz, 1982). Flight heritage: A dominant space technology already has a long flight heritage. Flight heritage means that the technology has already been extensively tested in space, which benefits reliability and decreases risk. A new space technology candidate has to be a significantly improvement to the dominant technology to justify the change of increases in risk and decreases in reliability. Complexity: The complexity of space technologies rarely allows them to be measured on only one or two performance criteria. This entails that evaluating them is equally complex. Testing: The testing of space technologies is very expensive, and therefore only occurs if there is sufficient faith in the technology and if a technology is mature enough. This is an obstacle in the development of space technologies, as test results only come in a late phase of the development.
1
2
3
4
Because of these reasons, a new theory has been developed for breakthrough technologies in the space sector, or disruptive space technologies (DSTs). When analyzing the innovation literature and the theory of DTs, a resemblance can be found between radical innovations and DTs. Both are explorations of new technologies and replace, dominant technology and offer a higher perceived performance. Because of this high degree of similarity, the choice has been made to combine both theories in a new DST theory, which will have the following characteristics:
DSTs are product innovations according to the 4P paradigm (Product, Process, Paradigm and Position innovation) of Francis (2005), because a technology is always a product innovation. This research will therefore only be applicable to forecast space technologies. (As an example: Commercial space is a paradigm innovation, a while commercial spacecraft is a product innovation.) DSTs are explorations of new technologies. This means that they represent a significant improvement in technology along a continued perceived performance (radical) or discontinued perceived performance (disruptive). A concept with a DST potential is always in the fluid phase or concept phase of a technology as depicted in the Abernathy & Utterback (1978) model in Figure 4. This means that their greatest competitor is the dominant space technology. Usually the technology has not been tested yet in the operating environment. The disruption of the dominant technology occurs in the transitional phase. In the specific phase the technology gains extensive flight heritage and reaches the end of it potential gain in performance. The customers in the case of DSTs are not consumers or companies, but rather missions, as these determine the requirements of a technology. The mission in term is determined by national and international space agencies. The actual delivery of the technology is often (but not always) done by the space industry through different programs and policies.
Figure 6: Customer-supplier chain of the space sector
Ultimately the space program determined by a national government should serve the
5
FORECASTING METHOD The method will contain criteria which are based on indicators for DSTs. The criteria are divided into three categories according to the three long term forecasting signals of Strong et al (2009): o Signpost o Measurement of interest o Vision
pe rfo rm an ce
Performance
A DST is an emerging technology, which disrupts the status quo of the space sector by radically improving on the perceived performance required by a certain (set of) mission(s), creates possibilities of improvement of other technologies or opens up new opportunities.
ed
The points above lead to the following definitions of a DST:
Pe rc eiv
5
focuses on the characteristics of DSTs evolution. A popular way to illustrate this is the S-Curve life cycle analogy tool illustrated in Figure 4. Using these S-Curves, the two main categories of DSTs can be illustrated: o The continued perceived performance o The discontinues perceived performance The first category, the continued perceived performance trajectory and is illustrated in Figure 7. In this figure, a DST is replacing a dominant technology with the performance requirements increasing (ΔP) along the same perceived performance trajectory at a certain time (X1).
needs and desires of citizens of a nation. This customer-supplier chain is also illustrated in Figure 6. A technology can be disruptive by changing the requirements and/or capabilities of other subsystems in a spacecraft in which those technologies become breakthrough technologies.
Figure 7: Continued perceived performance DST
When looking at the three signals, the signpost signal explains the dynamics of DST evolution in relation to the dominant technology and the perceived performance, the measurement of interest signals elaborated on a method to determine the perceived performance and the vision signal identifies the indicators that externally influence the perceived performance. The generated criteria for these categories will be put in a matrix and measured by experts. The different signals for DSTs will be elaborated next. The matrix itself with its criteria is illustrated in annex 1.
The second category is the discontinued perceived performance trajectory. There can be multiple reasons why a perceived performance changes over time; the functional requirements of one performance value are met and further performance gain creates indifference according to the theory of Adner (2002). Perhaps the mission purpose changes which results in a change of requirements of performance values. Also political decisions can influence the requirement of a technology; this will be discussed in the Vision signal. Whatever the reason is, if the perceived performance demand changes and the new technology fills this need better then the dominant one, it will disrupt the latter. This type of DST is also illustrated in Figure 8. In this the situation is viewed from the old perceived performance tra-
SIGNPOST SIGNAL The signpost signals are clearly recognizable future events on the market. For example: The point where one space technology pushes another technology out of the market. This set of criteria
6
ple of one of these graphs has been given in Figure 9. In this figure the evolution of the performance of a power subsystem as a function of the power output and the mass is given. As can be seen, the performance has over time and is thus an important attribute.
jectory and the new. For example in at X1, when viewed from the old perceived performance (A), the dominant technology is better then the DST. However when view from the new perceived performance (B) the DST over performs the dominant technology.
Figure 9: Evolution example (Stellmann, 2009)
This research on performance evolution is a key part of the method which will help determine a trend towards the future. This trend or expected trajectory was also noted by Christensen (1995) as a method to assess DTs. As can be seen in Figure 10, the current performance combined with the expected trajectory of performance improvement can lead to a forecast of when one technology will disrupt another.
Figure 8: Discontinued perceived performance DST
It is important for both categories to determine how and in what way perceived performance has changed over time. An example of how this could be done has been given in Stellmann (2009). She constructed several graphs in which the evolutions of performance attributes of technologies are illustrated. A trend in the increase or even decrease of performance could indicate a shift in importance of this functional attribute. An exam-
Figure 10: How to assess DTs (Bower & Christensen, 1995)
It has to be noted however that historical data alone is not a good indicator for the change in perceived performance. Looking back at Adner’s (2002) indifference curves, a domain might have already fulfilled the customer’s minimal requirements and shifted its focus on another perform-
7
ance attribute. Therefore this method of determining the perceived performance has to be handled with great care and a continuous lookout has to be for indifference curves. An example of this could be a propulsion technology for human spaceflight exceeding the acceleration of normal human gravity of 1G.
o
o
o
How does the technology perform on the future performance mix determined by the historical performance evolution? Does the technology have one or more additional aspects of a disruptive space technology? What is the technology attractiveness?
MEASUREMENT OF INTEREST SIGNAL
Additionally DSTs can also be disruptive because they have an impact or they affect technologies in other domains. In some cases the way in which DSTs are combined with other technologies determines the disruptiveness of a technology. The committee on forecasting future DTs of the America National Research Council (2009) made categories to determine different kinds of DTs. If a technology has one or multiple aspects of these categories then its potential for disruptiveness will increase. These categories, adapted to the space sector, are: Enablers: A technology that makes one or more new technologies, processes or applications possible (e.g. integrated circuit => smaller Data Mgmt S/S; Solar cell => rechargeable S/C). Catalysts: A technology that alters the rate of change of a technical development or alters the rate of improvement of one or more technologies (e.g. cubesats/ swarm technologies; distributed systems, flash memory drive). Morphers: A technology that when combined with another technology creates one or more new technologies (e.g. wireless technologies and microprocessors). Spin-ins/spin outs: A technology that crosses over from one market to another and disrupts the status quo in the new market (e.g. Nano tubes and medical scanners (Heide et al., 2009)). Multiple technology disruption: A technology that replaces not only one, but multiple technologies. On its own the technology is not better then a single technology, but because of its combined function, the technology is better then the whole of the single technologies. (e.g. Solar sail replacing the propulsion system, the propellant containment, decreasing power requirements etc.) The following main criteria are derived from the signpost signal:
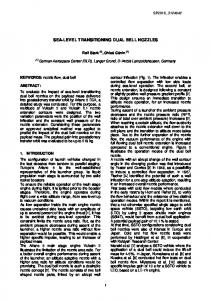
A measurement of interest is a technical performance value. Weight, dimension and efficiency are examples of performance attributes for solar panels. These performance attributes have to be measured according to a certain technology domain and the purpose of a technology. This will result in different weights of importance for the performance criteria which will be the current perceived performance. As an example the advance propulsion domain of the ESA technology tree (ESA, 2008) has been taken. This technology domain contains several technology concepts with a potential for disruptiveness. These technologies were analyzed in light of a proposed mission of a rendezvous with a comet of a space probe. This mission was proposed to a group of engineers of the department of space analysis transportation (SART) at the DLR in Bremen. The purpose of this workshop was to identify the performance attributes relevant in evaluating a technology and determining the importance of them. At this workshop a total of 27 criteria were deemed as important and 7 of these were identified as the most important ones. These were then ranked in order of importance and weightings were allocated to them. The results of this workshop are illustrated in Figure 11. In general space technologies can be categorized in three main value types; o Technology specific attributes o Cost value o Quality value. The technology specific attributes contain performance values which are specific to the technology and the type of mission. These include; specific impulse, thrust, throttle ability, radiation resistance, power consumption etc. The cost value contains all the costs related to the technology, for example; the recurring costs, the non-
8
all of these scenarios then its potential for disruptiveness will rise. The following main criteria are derived from the vision signal: o How well does the technology concept reinforce the technology objectives of the space policy? o What is the technology concept's robustness against policy changes? o Does the technology concept contribute to the forecasted future of the space market?
recurring costs, operating costs, launch costs (which is determined by the mass and dimension) etc. The quality value contains all the quality performance measurements like; lifetime, flexibility, reliability, risk etc.
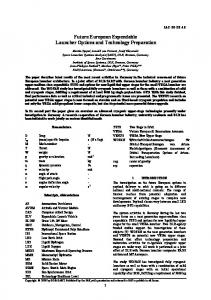
METHOD EXPLANATION As stated before the criteria which resulted in these categories are measured according to a concept scoring matrix from Ulrich & Eppinger (2003). The scoring matrix itself is illustrated in annex 1. The method will use a weighted factor to adjust the level importance of the criteria elaborated before. The allocation of the weighted factor per criteria will differ with every evaluated concept and will have to be determined by the evaluator based on evaluation concept characteristics. For testing purposes we have already set the weight of the criteria, based on expert’s opinion or according to the researcher’s discretion. Most criteria will result in numbers which can be compared with each other. This result will then have to be compared to the dominant technology in space. This technology will be the reference for the new technology concepts considered in this method. Scoring higher then the reference technology will result in a score of 50 or more (compare Table 1). A score of above 50 will indicate a potential for disruptiveness of a technology concept, the higher the score, the higher the potential.
Figure 11: The required perceived performance for advanced space propulsion in a radar chart
VISION SIGNAL The vision signal is a long term vague description of a possible future on the market. These are the factors that will influence the perceived performance in the future. The future of space development is generally determined by three things: o The space policies o The political forces that changes space policies o The long term state of the market These will be elaborated next. The long term plan and strategy of the European space sector is determined by ESA in the European space policy. This space policy provides a long-term future guideline along which technologies have to be developed. This policy however also changes over time according to Suzuki (2003). These changes have to be analyzed over time in order to make sure a DST is still disruptive in a policy changing market. An example of this is the American president Obama cancelling the Constellation program in 2010. Additionally a longterm vision signal has been set up based on the Space 2030 report from the OECD. This reports states three possible futures in which different states of the world are analyzed, the smooth sailing, back to the future and stormy weather scenario. If a technology has a chance to succeed in
Table 1: Scoring matrix from Ulrich & Eppinger (2003)
Rating 0 25 50 75 100
Relative performance Much worse then reference technology Worse then reference technology Same as reference technology Better than reference technology Much better than reference technology
The matrix has 4 levels of aggregation; the matrix, the category, the criteria and the sub-criteria
9
technologies concepts out of field are analyzed, the highest score has the highest chance to actually become disruptive (as usually only one technology per domain becomes disruptive). Therefore the forecast of, after testing all technology concepts in a technology domain with a set purpose, is the technology with the highest disruptive potential.
level. The different levels and their method of calculation will be elaborated below and is visualized in Table 2. As stated before, the weighted score (WS) has to be calculated by multiplying the rating (R) with the weight (W).
WS = R .W
(1)
The score of the category level is the sum of the weighted scores of the sub levels multiplied by its weight. So for example the total weighted score (TW) of category 1 is calculated by the sum of all its criteria multiplied by it weight.
TW1 = (Ws1.1 +Ws1.2 +Ws1.3 ).W1
BIAS MITIGATION The method is a qualitative method, because it is weighted and filled in by experts. A major downside of this is that bias can influence the outcome of the forecast and decrease its accuracy. Therefore the research has identified three forms of bias and methods of mitigating them: Personal bias - It could be that they have a personal interest in the outcome of the forecast and are therefore tended to answer in favor of this personal interest. Therefore mitigating this bias will involve the selection of expert without any personal gain the selection of any of the technology concepts. Age bias - According to Carstensen (1999) and Fingerman & Perlmutter (1995) young people are more future orientated then people from an older generation. This age bias could lead to a forecasting error as the older generation has a more conservative view then the youth on the possible future. Fingerman & Perlmutter (1995) state that younger people are more accurate in predicting the long-term future, while older people with more experience see patterns more easily and are better to predict the near-future. Supporting this is the first-law of Clarke (1962): “When a distinguished but elderly scientist states that something is possible, he is almost certainly right. When he states that something is impossible, he is very probably wrong.” This research adopts the view that just because the forecast is biased, it does not mean that it is incorrect. Therefore one of the approaches to mitigate the age bias in forecasting is to consider the time horizon of the forecast and assign the appropriate generation to forecast them. For example long term forecast should be done by a younger generation while short term forecasts should be done by the more experienced older generation. In light of the long term fore-
(2)
While criteria with sub-criteria will be calculated in the same way as categories:
Ws1.3 = (Ws1.3.1+Ws1.3.2 +Ws1.3.3).W1.3 (3) In turn the overall total (OT) is the sum of the total weighted scores is calculated as follows:
OT = TW1 TW2 TW3
(4)
Table 2: Example of scoring matrix W R WS 1 33% 1.1 33% 60 20.00 1.1 33% 70 23.33 1.3 33% 50 17.78 1.3.1 33% 30 10.00 1.3.2 33% 90 30.00 1.3.3 33% 40 13.33 #
TW
61.11 2
33%
3
33%
TW
44.00
TW 66.00 Overall total (OT) 57.04 W= Weight, R= Rating, WS= Weighted score, TW= Total weight OT= Overall total
This overall total is the end result for a technology. Any score over 50 will mean that it has a disruptive potential. However because multiple
10
signals as described by Strong et al (2009); Signpost, Measurement of interest and Vision. The Signpost signal contains the criteria that indicate the disruptiveness of a space technology through the technology evolution theory. The Measurement of interest signal describes a method of determining the perceived performance of a technology, while the Vision signal provides indicators what influences this perceived performance over time. The resulting method listed in annex 1, will determine a technology’s potential for disruptiveness and the technology with the highest potential in a certain domain will be most likely disruptive. This is the forecast which is given at the end of the method.
cast in this research, preference has to be given to a younger generation in selection of experts. Cultural Bias - Another form of bias in forecasting is cultural bias. Lam et. al, (2005) has advocated that culture has an influence on forecasting. This deals with considerable differences in values, beliefs, norms and worldviews in societies around the world. These differences could lead too different views on what the future for a culture has to bring. When selecting the forecasting participants, special attention has to be paid to their culture. It would be wise to use as internationally orientated participants as possible as to reduce the cultural bias. Because of the context of this research, all technologies will be on a global and thus international scale. This means the participants should be as culturally diverse as possible. Linguistic bias - Bond & Chung (1984) found out that people have a bias resulting from the language used in the survey. Because this method and the resulting matrix are in English, bilinguals might answer differently then they might do in their native language. According to the studies of Bennett (1977) and Marin et al. (1983) bilinguals give more extreme and social desirable answers. Mitigating this bias would require to translate the method to the native language of the participant. This translation does however have the problem of losing quality or meaning to the original version, this because sometimes important aspects get lost in translation. It is therefore recommended to stay with the original version as mitigating the bias would lead to more problems.
OUTLOOK The accuracy of the forecasting method elaborated in this paper is restricted by a number of limitations of the research. Firstly, the indicators or criteria for disruptiveness found in this research might not have been exhausting, perhaps additional criteria will also prove to be relevant in assessing the disruptive potential. This was however hard to asses in the time frame of this research. For this purpose, further empirical research in space technology evolution over time is needed. Secondly the weight of the different criteria in the context of determining the potential for disruptiveness still requires more research. Since no literature has to date been made on this subject, the current weight is just a view of the researcher and might lead to an inaccurate forecast. Thirdly the method is designed for the European space sector. This focus limits the applicability of the method. Therefore the recommendation is that further research should focus on the global space market.
CONCLUSION The paper started by elaborating what DT in the area of innovation is and what DSTs are. DSTs differ from the DT theory of Christensen (1997) because the space sector works differently. A new theory for DSTs was constructed and a method for forecasting them was made. This method uses a matrix based on the concept scoring matrix from Ulrich & Eppinger (2003) to measure the potential disruptiveness for space of technology concepts. This method relies on the evaluation of criteria which indicate the disruptiveness of a technology concept. The criteria are ordered according to three long term forecasting
REFERENCES Abernathy, W.J. & Utterback, J.M. (1978) Patterns of Innovation in Technology, Technology Review, vol 80(7), 40-47 Adner R, (2002). When are DTs disruptive? A demand-based view of the emergence of competition. Strategic Management Journal, vol. 23, 667-688
11
Argawal, R., Bayus, B.L. (2002) Market Evolution and Sales Takeoff of Product Innovations. Management Science, Vol 48, 1024–1041
Henderson, R.M. & Clark, K.B. (1990) Architectural Innovation: The Reconfiguration of Existing Product Technologies and the Failure of Established Firms. Administrative Science Quarterly, Vol 35, 9-30
Beer, S. (1981). Brain of the Firm, John Wiley & Sons
Kamien, M.I., Schwartz, N.L., (1982) Market structure and innovation, Cambridge university press: New York
Bennett, M. (1977). Response characteristics of bilingual managers to organizational questionnaires. Personnel Psychology, vol 30, 29-36.
Lam, K.C.H., Buehler, R., McFahrland, C., Ross, M., Cheung, I., (2005) Cultural Differences in Affective Forecasting: The Role of Focalism. Personality and Social Psychology Bulletin, vol 31, 1296-1309
Bond, M. H., & Cheung, M.K. (1984). Experimenter language choice and ethnic affirmation by Chinese trilinguals in Hong Kong. International Journal of Intercultural Relations, vol 8, 347-356. Bower, J.L. & Christensen, C.M. (1995). DTS: CATCHING THE WAVE. Harvard business review, vol. 73, 43-53 Carstensen, L.L., Isaacowitz, D.M. & Charles S.T. (1999). Taking time seriously: a theory of socioemotional selectivity. American Psychologist, vol. 54(3), 165-181. Chan Kim, W., & Mauborgne, R. (2005). A Blue Ocean Strategy: How to Create Uncontested Market Space and Make the Competition Irrelevant McgrawHill Professional, New York. Christensen, C.M. (1997). The innovator’s dilemma. New York: Harper Business. Christensen, C.M. (2002). The rules of innovation. Technology review, June 2002, 33-38 Clarke, A.C. (1962) Hazards of Prophecy: The Failure of Imagination, Profiles of the Future: An Enquiry into the Limits of the Possible Committee on Forecasting Future DTs (2009). Persistent Forecasting of DTs. The National Academies press ESA (2008) ESA technology tree: Version 2.1, STM277 Fingerman, K.L. & Perlmutter, M. (1995) Future time perspective and life events across adulthood. Journal of General Psychology, vol 122, 95-111. Heide, E.J. van der, Kruijff, M., Raitt, D., Hermanns, F., (2009) Space Spin-in from Textiles: Opportunities for Tethers and Innovative Technologies, IAC-03U.2.b.09, IAF Bremen
12
Lambert, S.G. (1995) Laser communication in space, Artech Print on Demand Marin, G., H.C. Triandis, H. Betancourt, and Y. Kashima. (1983). Ethnic Affirmation Versus Social Desirability: Explaining Discrepancies in Bilinguals' Responses to a Questionnaire, Journal of CrossCultural Psychology, vol 14(2), 173-186. Organisation for economic co-operation and development. (2004) Space 2030: Exploring the future of space applications, OECD Publications, Paris Stellmann, S. (2009). Historical Evolution of Space Systems, IAC-09-E4.2.4 Strong, R., Proctor, L., Tang, J. & Zhou, R. (2007) Signpost generation in strategic technology forecasting. Proc. 16th international conference for the international association of management technology, IOMOT. Pp. 2312-2331. Summerer, L., (2009) Specifics of Innovation Mechanisms in the Space Sector, XXth ISPIM Conference The Future of Innovation Tidd, J., Bessant, J. & Pavitt, K., (2005) Managing Innovation: Intergrating technological, market and organizational change. John Wiley & Sons, Ltd. Ulrich, K.T. & Eppinger, S.D. (2003) Product design and development. McGraw-Hill, New York. Vanston, J.H., Vanston, L.K., (2004). TESTING THE TEA LEAVES: EVALUATING THE VALIDITY OF FORECASTS, Research Technology Management, September—October, 33-39
Annex 1: Scoring matrix of the forecasting method
13