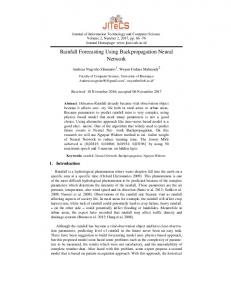
The main goal of this study is to develop the equations for forecasting net energy consumption (NEC) using the artificial neural network (ANN) technique in order.
Energy Sources, Part B, 1:147–155, 2006 Copyright © Taylor & Francis Group, LLC ISSN: 1556-7249 print/1556-7257 online DOI: 10.1080/009083190881562
Forecasting Net Energy Consumption Using Artificial Neural Network ADNAN SÖZEN Gazi University Mechanical Education Department Teknikokullar, Ankara, Turkey
M. ALI AKÇAYOL Gazi University Computer Engineering Department Maltepe, Ankara, Turkey
˘ EROL ARCAKLIOGLU Kırıkkale University Mechanical Engineering Department Kırıkkale, Turkey The main goal of this study is to develop the equations for forecasting net energy consumption (NEC) using the artificial neural network (ANN) technique in order to determine the future level of the energy consumption in Turkey. Logistic sigmoid transfer function was used in the network. In order to train the neural network, population, and gross generation, installed capacity and years is used in input layer of network. The net energy consumption is in output layer. The input values in 1965, 1981, and 1997 are only used as test data to confirm this method. The statistical coefficient of multiple determinations (R2 -value) is equal to 0.9999 and 1 for training and test data, respectively. According to the results, the NEC using the ANN technique has been obviously predicted within acceptable errors. Apart from reducing the whole time required, the importance of the ANN approach is possible to find solutions that make energy applications more viable and thus more attractive to potential users. It is also expected that this study will be helpful in developing highly applicable and productive planning for energy policies. Keywords energy, consumption, gross generation, estimation, artificial neural network, Turkey
As we know, energy is considered a basic agent in the generation of wealth and also an important factor in economic and social development in Turkey. Medium- and long-term primary energy demand forecasts, which are based primarily on a realistic prediction of Address correspondence to Andan Sözen, Gazi University, Technical Education Faculty, Mechanical Education Department, Teknikokullar, Ankara, 06503, Turkey. E-mail: asozen@gazi. edu.tr
147
148
A. Sözen et al.
targeted economic growth and social development of the country in the future, which are prerequisites to reach this goal (Ediger and Tatlidil, 2002). There are several factors external to the energy policies that are considered to be important for forecasting future projections in Turkey. These factors are population growth, economic performance, technological developments, import, export, and consumer tastes. Furthermore, government policies concerning the energy sector and developments on the world energy markets will play a key role in the future level and pattern of energy production and consumption (Özturk et al., 2004). Energy modeling is a subject of widespread current interest among engineers and scientists concerned with problems of energy production and consumption (Özturk et al., 2004). Modeling in some areas of application is now capable of making useful contributions to planning and policy formulation (Dincer, 1946). In this regard, energy planning is not possible without a reasonable knowledge of past and present energy consumption and likely future demands (World Energy Council—Turkish National Committee, 2000). A few statistical methods have been officially used in the planning and prediction of the future energy demand of Turkey between 1980 and 2003. The main objective of this study is to develop equations of estimation of the net energy consumption (NEC) in order to analyze energy use and make future projections using basic factors such as population, development of installed capacity.
Present Energy Situation in Turkey Turkey’s geographical location makes it a natural bridge between the energy rich Middle East and Central Asian regions. Turkey has been one of the fastest growing power markets in the world together with a young and growing population, rapid urbanization, strong economic growth, and low per capita electricity consumption for two decades (Topçu and Ülengin, 2004). Although Turkey has every kind of energy resources, it is an energyimporting country because these resources are limited. More than half (52%) of the NEC in the country is met by imports, and the share of imports continue to increase each year. Turkey’s primary energy sources are hard coal, lignite, asphalt, bituminous schist, hydropower, oil, natural gas, geothermal, solar, wood, and animal and plant wastes. However, the level of energy production in Turkey is very low. Coal is a major fuel source for Turkey. Turkey’s oil consumption has increased in recent years. Turkey’s primary energy production and consumption in the various sources is shown in Figure 1. Half of Turkey’s energy usage is currently oil and natural gas. Oil has the biggest share of 44% in total primary energy consumption, while natural gas has a share of 12% (Demirba¸s, 2002). Turkey’s share in total Organization for Economic Co-operation and Development (OECD) production is expected to rise from 2% in 1995 to 7% in 2020 (Topçu and Ülengin, 2004). The share of natural energy resources of Turkey in the world reserves are (Demirba¸s, 2002) as follows: • coal 0.6%, • geothermal 0.8%, and • hydro 1%. However, petroleum and natural gas reserves in Turkey are quite limited. Lignite has the biggest share in total primary energy production of 43%. Oil has a share of 13%, and natural gas has a share of 1%. Oil has the biggest share (44%) in total primary energy consumption, and natural gas has a share of 12% (Demirba¸s, 2002). Rapid increases in domestic energy demand have forced Turkey to increase its dependence on foreign energy supplies and to face the prospect of a severe energy shortage
Forecasting Net Energy Consumption Using ANN
149
Figure 1. Indicators used in the analysis between 1953 and 2000.
in the 21st century (Demirba¸s, 2002). Turkey maintains strong economical and political ties to the West, including membership in the OECD, a Customs Union with Europe and NATO, while simultaneously occupying a position as a leading Muslim nation. In addition, Turkey has strong historical, ethnic, and linguistic ties to Central Asia’s Turkic peoples. Also, Turkey’s strategic location makes it a natural “bridge of energy” between major oil-producing areas in the Middle East and Caspian Sea and consumer markets in Europe (Topçu and Ülengin, 2004). Projections by Turkey’s Electricity Generation and Transmission Corporation (TEAS), a public company that owns and operates 15 thermal and 30 hydroelectric plants generating 91% of Turkey’s electricity, indicate that rapid growth of electricity consumption will continue over 15 years (Topçu and Ülengin, 2004).
Artificial Neural Networks Artificial neural networks (ANNs) have been widely used for many areas, such as control, data compression, forecasting, optimization, pattern recognition, classification, speech, vision, etc. Nowadays, ANNs have been trained to overcome the limitations of the conventional approaches to solve complex problems (Mohandes et al., 1998). ANNs need sufficient input-output data for training. Also, it can continuously retrain the new data so that it can conveniently adapt to new, incomplete, and imprecise data (Jang et al., 1997). An ANN consists of many units called neurons. Each unit is interconnected via links that contain weight values, which are basic units of information processes. Several types of neural architectures are available, between which multilayer feed forward (MLFF) neural networks are the most widely used. An MLFF neural network typically employs three or more layers for the architecture: an input layer, an output layer, and at least one hidden layer (Kalogirou, 2000). In MLFF networks, neurons are arranged in layers with connectivity between the neurons of different layers. The layer that receives inputs is called the input layer. The layers that are between the input and output layer are called the hidden layer. Input signals are propagated in gradually modified form in the forward direction, finally reaching the output layer. Each node has the activation function and can receive signals from nodes in the previous layer. A sigmoid function is a widely used nonlinear activation function (Palau et al., 1999) whose output lies between
150
A. Sözen et al.
0 and 1 and is defined as f (x) =
1 1 + e−x
(1)
An important characteristic of this function is differentiable throughout its domain. The error for hidden layers is determined by propagating back the error determined for the output layer. During learning, the weights of the neurons are optimized using the Generalized Delta Rule (GDR) (Reddy and Ranjan, 2003). The error that is minimized by the GDR is the sum of the squares of the errors for all the output units, defined as � Ep = (yp − op )2 (2) p
where Ep is the square errors, p is the index of pattern, o is the actual output, and y is the network output.
Application of the Artificial Neural Network and Results To estimate the output value of the NEC, an MLFF is trained and tested for its ability to generalize and interpolate. The selected ANN structure is shown in Figure 2. It is a fully connected hierarchical network consisting of an input layer, two hidden layers, and an output layer. The hidden layers have fifteen neurons, and the input layer has four neurons. There is one output neuron. The back-propagation algorithm has been implemented to determine errors and modification for the weight of the hidden layer neurons. In order to avoid undesirably long training time or network being trapped in local error minima, various learning rates have been tried. The ANN structure and number of neurons have been selected by using an evolutionary algorithm. All of the data have been normalized in the range of [0, +1].
Figure 2. ANN architecture used for estimation of the NEC.
Forecasting Net Energy Consumption Using ANN
151
The equations obtained by using the ANN follow. The activation function is a sigmoid function with 0.5 threshold value as follows, f (x) =
1 1 + e−4(x−0.5)
.
(3)
The formulations of the outputs are listed below. NEC = 97713.5 Fi =
1
1 + e−
�15
i=1 Gi Fi −2
+ 1012.5
1 1 + e−Zi
(4)
(5)
where Zi and Gi (i = 1, . . . , 15) are given Eqs. (6) and (7), respectively. Zi =
15 �
Di Ei + 2
(6)
i=1
Ei = Cli ∗ Y + C2i ∗ P + C3i ∗ I C + C4i ∗ GG + 2
(7)
Di and Cj i (j = 1, . . . , 5, i = 1, . . . , 15) values are given in Tables 1 and 2, respectively. The inputs (X) in Eq. (7) need normalizing according to Eq. (8). Xn = A ∗ X − B
(8)
A and B values are given in Table 3 as inputs. Deviations in NEC are given in Figure 3 and Table 4 for training and testing years, respectively. According to the results obtained, deviations in the NEC for training years are in the range of ±10% for 1957–2000. Deviations for 1953–1956 are bigger than the other years. Deviations for testing years are 9.4, 4.1, and 2.7 for 1965, 1981, and 1997, respectively (Table 4).
Figure 3. Deviations in the NEC estimated by Eq. (4).
152
D2
−2.459164 4.23122 −2.254216 1.248932 −0.858808 1.834028 −2.643164 −0.485592 3.918244 3.542264 2.289576 −2.36526 0.610724 2.146008 2.092188
D1
−0.502524 3.3069 0.259092 −0.623004 1.07282 3.956996 −1.579908 −1.950484 −3.57066 2.013208 −2.851488 −3.501168 3.784564 −1.974896 3.855548
i
1 2 3 4 5 6 7 8 9 10 11 12 13 14 15
−1.780316 2.939076 1.546056 2.878544 −4.688 1.54468 −3.521264 2.831612 0.572148 −0.950044 −2.533364 −3.074788 1.434432 −3.277596 −0.653552
D3 3.165856 −2.879748 0.973832 1.519884 3.129276 −0.476284 2.882536 −1.416204 3.607672 −2.791684 0.338572 −2.407528 −2.831732 −1.343688 1.166524
D4 −1.208548 2.069152 1.46706 3.783584 0.256868 −3.413028 2.519936 2.762604 3.745152 1.294428 −0.2241 −1.08276 −2.74016 −3.781824 1.690376
D5 1.28172 −1.553504 0.357216 2.388412 −1.034332 0.801712 −0.452388 −2.367052 3.118816 −1.631604 −2.938132 −0.033 2.86816 3.238528 −1.371564
D6 −2.603684 4.25778 0.985616 −1.433208 −0.531116 −1.814332 −0.829608 2.446348 −2.925528 1.037404 2.600284 1.886564 −1.015996 3.942372 1.228104
D7 −3.506236 −0.869104 −0.387452 1.057044 3.63564 −1.35458 −3.69696 0.763308 −3.470432 −2.024816 3.634324 0.580848 −1.669616 0.648452 0.233512
D8 1.58354 0.109124 0.668028 0.056908 −4.472608 2.897424 3.389812 0.432956 2.735124 −1.746192 −1.843048 1.022764 2.0017 4.036308 0.103364
D9 −2.077216 3.640792 0.13022 0.223904 −0.700492 −3.706584 3.86786 3.473552 −1.511696 0.755804 −2.003464 −3.224236 −0.269732 −3.109184 2.59578
D10
D11 3.8942 3.683096 0.602004 0.771016 −3.617988 2.721192 2.890012 −2.70918 0.676472 2.598336 1.023172 1.331096 −4.779336 −1.130704 0.262052
Table 1 Constants in Eq. (4) (Gi ) and Eq. (6) (Di )
−0.06344 −1.972252 −3.192012 −3.136332 2.53488 −2.166988 −0.732224 2.037692 3.881224 3.983688 −2.8408 −0.593132 3.46128 −3.907248 1.694556
D12
2.333928 −2.405192 2.512612 2.236168 −1.287848 1.389428 1.885152 −0.710416 0.820268 4.234068 −1.391684 −1.238924 −1.20016 −1.348192 1.380556
D13
−0.737692 −1.543228 −3.747324 2.931144 3.0308 2.931216 −0.04048 −3.286048 3.535256 −3.129736 −1.1933 −3.267816 0.20796 −3.877464 3.844024
D14
−1.83702 −2.06702 −1.528016 −2.0273 −2.24234 1.91298 −2.944204 −2.8447 −3.125732 −2.446244 −2.410108 1.747768 2.00168 2.024104 2.12332
D15
−2.431936 −2.344488 2.667756 2.021636 3.29698 −0.86102 −1.272872 1.095156 1.493632 −1.935916 −2.341968 −2.865848 2.68034 −2.270976 −3.727484
Gi
Forecasting Net Energy Consumption Using ANN
153
Table 2 Constants in Eq. (6) i
C1i
C2i
C3i
C4i
1 2 3 4 5 6 7 8 9 10 11 12 13 14 15
0.143212 −2.393492 3.596788 −2.854248 1.135304 −1.453612 −3.695848 3.172844 −2.046664 −2.510268 −3.033384 2.602952 −3.0141 3.039644 −2.453228
0.41656 −2.180728 −1.850368 2.546176 1.205368 −0.018436 −0.915032 3.98202 −4.577056 −1.53534 4.263624 −0.032336 −2.190764 2.79196 1.474168
−3.327512 2.074304 3.789584 −4.066164 0.387236 −2.39834 2.417948 1.897336 −4.6166 0.28906 1.12754 −2.400868 1.082356 3.12218 3.392356
1.874336 2.3769 −0.322912 −0.531912 2.188564 1.926968 2.736312 −1.364336 −1.018452 0.20602 0.787972 −2.641748 0.22236 −3.332376 −0.157544
Table 3 The normalizing values in Eq. (8) X (Inputs)
A
B
Year (Y) Population (P) Installed capacity (IC) Gross generation (GG)
0.02128 0.0000234 0.0000374 0.000008083
41.55319 0.5281 0.01866 0.00971
Table 4 Deviations for test years Test years
NECACTUAL (GWh)
NECANN (GWh)
Deviation (%)
1965 1981 1997
4236.8 22030 81885
3836.97 21122.91 79628.82
9.4 4.1 2.77
Conclusions In this study, the NEC of Turkey is modeled using a neural network technique. As seen in Figures 4 and 5, the statistical coefficient of multiple determinations (R 2 -value) is equal to 99.99% and 100% for training and test data, respectively. As seen from the results,
154
A. Sözen et al.
Figure 4. Comparison of the actual data and ANN results for training years.
for especially test data, the NEC using the ANN model has been obviously predicted within acceptable errors. Also, the ANN technique is flexible in nature to provide optimal solutions to estimate the future trends of energy consumption. Another advantage of the ANN technique is determined as mathematical equations. Future energy policies of Turkey can be expressed using these equations. As a result, the ANN technique may be used to predict the future trends of energy consumption.
Figure 5. Comparison of the actual data and ANN results for testing years.
Forecasting Net Energy Consumption Using ANN
155
References Demirba¸s, A. 2002. Turkey’s energy overview beginning in the twenty-first century. Energy Conversion and Management 43:1877–1887. Dinçer, I., and Dost, S. 1996. Energy intensities for Canada. Applied Energy 76:211–217. Ediger, V. S., and Tatlidil, H. 2002. Forecasting the primary energy demand in Turkey and analysis of cyclic patterns. Energy Conversion and Management 43:473–487. Jang, J.-S. R., Sun, C. T., and Mizutani, E. 1997. Neuro-fuzzy and soft computing: A computational approach to learning and machine intelligence. New Jersey: Prentice-Hall. Kalogirou, S. A. 2000. Applications of artificial neural-networks for energy systems. Applied Energy 67:17–35. Mohandes, M., Rehman, S., and Halawani, T. O. 1998. Estimation of global solar radiation using artificial neural networks. Renewable Energy 14:179–184. Özturk, H. K., Canyurt, O. C., Hepba¸slı, A., and Utlu, Z. 2004. Residential-commercial energy input estimation based on genetic algorithm (GA) approaches: An application of Turkey. Energy and Buildings 36:175–183. Palau, A., Velo, E., and Puigjaner, L. 1999. Use of neural networks and expert systems to control a gas/solid sorption chilling machine. International Journal of Refrigeration 22:59–66. Reddy, K. S., and Ranjan, M. 2003. Solar resource estimation using artificial neural networks and comparison with other correlation models. Energy Conversion and Management 44:2519– 2530. Topçu, Y. I., and Ülengin, F. 2004. Energy for the future: An integrated decision aid for the case of Turkey. Energy 29:137–154. World Energy Council—Turkish National Committee (WEC-TNC). 2000. Energy Report and Statistics for 1999, 2000. Ankara, Turkey: Turkish National Committee.