Technological Forecasting & Social Change 96 (2015) 202–214
Contents lists available at ScienceDirect
Technological Forecasting & Social Change
Forecasting technology success based on patent data Serkan Altuntas a,⁎, Turkay Dereli b,1, Andrew Kusiak c,2 a b c
Yıldız Technical University, Department of Industrial Engineering, Istanbul, Turkey Gaziantep University, Department of Industrial Engineering, Gaziantep, Turkey The University of Iowa, Department of Mechanical and Industrial Engineering, Iowa City, IA, USA
a r t i c l e
i n f o
Article history: Received 6 October 2014 Received in revised form 17 February 2015 Accepted 10 March 2015 Available online 29 March 2015 Keywords: Technology forecasting Patent analysis Technology life cycle Technology diffusion Technology scope Condorcet method
a b s t r a c t A novel method for forecasting technology success based on patent data is proposed. Four criteria, technology life cycle, diffusion speed, patent power, and expansion potential are considered for technology forecasting. Patent power and expansion potential are considered as technology scope indicators. A data fusion algorithm is applied to combine the results obtained from different criteria. The usefulness and potential of the proposed forecasting approach has been demonstrated using all U.S. patents related to three technologies, namely thin film transistor-liquid crystal display, flash memory system, and personal digital assistant. The results obtained from these patents demonstrate that the personal digital assistant technology is preferred over other technologies. Investments in thin film transistor liquid-crystal display and flash memory system technologies have equal priority. © 2015 Elsevier Inc. All rights reserved.
1. Introduction Decisions related to investments in any technology are affected by different factors such as marketing, human resources, location, etc. Prediction of benefits from investment in a new technology is of great interest. Forecasting the success of future technology is key to the decision makers. Because, knowing or predicting the success of invested technology provides important clues, such as the current technology life cycle of the technology under consideration, diffusion potential and technology scope. In technology and business, it provides planners to choose the right strategies for the future (Kassicieh and Rahal, 2007). Therefore, the future technology success should be predicted prior to investment decision.
⁎ Corresponding author at: Yıldız Technical University, Department of Industrial Engineering, 34349 Beşiktaş, Istanbul, Turkey. E-mail addresses:
[email protected],
[email protected] (S. Altuntas),
[email protected] (T. Dereli),
[email protected] (A. Kusiak). 1 Tel.: +90 342 360 10 23; fax: +90 342 360 19 22. 2 Tel.: +1 319 335 5934; fax: +1 319 335 5669.
http://dx.doi.org/10.1016/j.techfore.2015.03.011 0040-1625/© 2015 Elsevier Inc. All rights reserved.
Patent data may be used to predict the success of technology when analyzed in the context of technology life cycle (TLC), diffusion potential, and technology scope (patent power and expansion potential). The future technology success of the investment alternatives has not been forecasted based on patent data in the context of these four criteria in the literature so far. To fill this gap, the answer to the question of how future technology success for investment alternatives can be forecasted is researched in this paper. Therefore, a novel method based on patent data is proposed to forecast technology success. There is a need to develop a technology forecasting (TF) method to predict future technology success. In this paper, TLC phases, initiation, growth, and saturation, are used with (i) the diffusion potential of the technology to determine possible acceptance, and with (ii) technology scope to determine the strength of the relationship of the technology with other technologies. It should be noted that patent power and expansion potential are used as indicators of technology scope. The total number of International Patent Classification (IPC) codes included in retrieved patents is divided by the total number of
S. Altuntas et al. / Technological Forecasting & Social Change 96 (2015) 202–214
patents for the measurement of patent power (see expression (2)). In addition, the total number of different IPC codes found in the retrieved patents is also considered as expansion potential. Patents are an objective indicator for technology forecasting (Chang et al., 2009). They also provide up-to-date and reliable knowledge for the identification of technological trends (Yoon and Kim, 2012a). In addition, they are useful in forecasting technology (Campbell, 1983) and technology decision-making (Jaranyagorn and Ngavej, 2012). Ernst (1997) showed that patent data was suitable for TF. Although there is a lack of quantitative approaches that are proposed for forecasting the future of technology, some studies have also suggested a quantitatively-based TF method. In the present study, patent analysis is used to quantitatively forecast the future state of technology. In addition to patent analysis, we also use the Condorcet method, which was developed by Condorcet (1785), to combine different results from each considered criterion and to prioritize technologies. The Condorcet method, which is sometimes called the Condorcet voting algorithm, is a data fusion method that ranks different results generated from different data resources. Each technology is considered a candidate and each criterion is considered a voter in this method. The remainder of this paper is organized as follows. The literature relating to technology forecasting studies, technology life cycle, technology diffusion, technology scope and the technologies being evaluated are discussed in Section 2. Following the literature review, a new technology forecasting method is introduced in Section 3, with application of the method being presented in Section 4. The final section will draw conclusions and propose directions for future research.
203
2. Literature review The literature surveyed in this paper is grouped into three parts: studies for technology forecasting; literature review of criteria and the technologies being evaluated. 2.1. Technology forecasting Patent-based technology forecasting (TF) methods reported in the literature are summarized in Table 1. Various multi-criteria decision-making approaches were applied for selection of TF methods. For example, Intepe et al. (2013) selected the most appropriate TF method for 3D television technology using a TOPSIS (Technique for Order Preference by Similarity to Ideal Solution) method. Cheng et al. (2008) compared TF methods for the development of new materials using the fuzzy AHP (Analytical Hierarchy Process) method. A detailed discussion of TF can be found in (Balachandra (1980a,b), Levary and Han (1995), Lemos and Porto (1998), Coates et al. (2001), Mishra et al. (2002), Firat et al. (2008), and Miller and Swinehart (2010)). Different types of methods were used to forecast the future of the technologies. Among them are; Monte Carlo simulation for televisions (Linton and Yeomans, 2002), grey theory for Taiwan's opto-electronics industry (Lin and Yang, 2003), multiple regression, linear regression, and the growth curve for airplane technology (Lamb et al., 2010), multiple regression models for wireless communication technologies (Patino et al., 2010), bass diffusion model for residential energy management technology (Daim et al., 2010), bass diffusion model for pulsed electromagnetic field therapy as a technology (Pretorius and Winzker, 2010), and Brownian agent-based technology forecasting for Korea's software (Shin and Park, 2009). Harell and
Table 1 Patent forecasting studies. Author(s) (year)
Technology
Method(s)
Altuntas and Dereli (2015) Altuntas et al. (2015) Choi and Jun (2014) Li et al. (2014) Chang et al. (2014) Ranaei et al. (2014) Jun and Lee (2012) Jun et al. (2012,b) Yoon and Kim (2012a)
Telecommunication technology Database theory and its application Humanoid robot system Green energy Dental implant Low emission vehicle Nanotechnology Biotechnology Silicon-based thin film solar cells and umbrellas
Chiu and Ying (2012) Lee et al. (2012)
Building-integrated photovoltaic (BIPV) Display
Chen et al. (2011) Trappey et al. (2011) Jun (2011a) Jun (2011b) Chen et al. (2010) Jun and Uhm (2010) Cheng and Chen (2008) Karakan and Koc (2008) Daim et al. (2008)
Hydrogen energy and fuel cell Radio frequency identification (RFID) Database theory and application Image and video technology Hydrogen energy and fuel cell Bio-technology Nanosized ceramic powders Isolation technology in white goods sector Data storage
Yoon and Park (2007) Daim et al. (2006) Ernst (1997)
Thin film transistor-liquid crystal display (TFT-LCD) Fuel cell, food safety and optical storage Computerized numerical control (CNC)
DEMATEL method and patent citation analysis Weighted association rules Bayesian patent clustering Patent analysis and simulation model Patent analysis S-curve Neural networks Association rules, time series analysis and k-means clustering Property–function analysis, network analysis and TRIZ trend analysis Logistic growth model Pareto/NBD (negative binomial distribution) model and gamma–gamma model Logistic growth model S-curve Association rules Association rules and self-organizing map Bibliometric analysis and growth curve Frequency time series model Logistic growth model Pearl curve and technology substitution model Bibliometric trend analysis, grow curve and technology cycle time Morphology analysis and conjoint analysis Bibliometric analysis, grow curves and system dynamics Patent analysis
204
S. Altuntas et al. / Technological Forecasting & Social Change 96 (2015) 202–214
Daim (2009) used the publication data from Science Direct and patent data from World Intellectual Property Organization (WIPO) database to forecast energy storage technologies for future electricity generation. Zhu and Porter (2002) focused on automated extraction and visualization of information for technological intelligence and forecasting. They presented different types of methods for knowledge extraction and visualization of information for TF. Tseng et al. (2002) proposed a hybrid forecasting method based on a neural network model with seasonal time series ARIMA model to forecast Taiwan machinery industry and the soft drink time series. Lee and Shih (2011) proposed novel gray-based cost efficiency for renewable energy technologies. Lee et al. (2014,) developed a technology forecasting method based on analytic hierarchy process (AHP) analysis and factor analysis for prioritizing investments in IT emerging technologies. The growth curve, also called an S-curve, can be considered one of the most popular methods for TF. The growth curve was conducted for data storage technologies (Daim et al., 2008), renewable energy production (Daim et al., 2012), and 20 emerging technologies under the “Machine and Materials” category (Bengisu and Nekhili, 2006). The Delphi method was extensively performed for TF in the literature. The method is based on the input data obtained from a team of experts in the relevant field. The method was conducted for open source software (Gallegoa et al., 2008) and nuclear energy (Hussler et al., 2011). Technology Forecasting using Data Envelopment Analysis (TFDEA) was used in the literature as well. It allows users to consider multiple inputs and outputs for TF. The TFDEA, which was published as a Ph.D thesis by Inman (2004), has been used effectively to forecast various technologies in recent years, such as computer display projector technology (Iamratanakul et al., 2005), fighter jet technology (Inman et al., 2006), wireless communications technology (Anderson et al., 2008; Lim et al., 2012), solar technology (Spatar et al., 2012), liquid crystal display (LCD) technology (Lim et al., 2013), hybrid electric vehicle technology (Jahromi et al., 2013), and mobile phone technology (Dereli et al., 2013). Details on technology forecasting methods can be found in Cho and Daim (2013) and Walk (2012). In addition, Martino (2003) reviewed recent advances in technological forecasting, such as Delphi, growth curves and probabilistic forecasts. 2.2. Criteria Among the existing technology forecasting indicators, patents and patent citations are considered meaningful (Chang et al., 2009). Availability of input data for TF is quite important to easily conduct methods for forecasting. Patents can be easily obtained from a patent database because most of the patent databases are freely available and open to the public and all researchers worldwide. There are different types of indicators related to patent data such as citations, patent age, IPC codes, and claims. Gao et al. (2013) emphasized that the current stage of TLC for one technology should be considered to make investment decisions. The S-curve has been widely used by researchers for TLC analysis. The results of Chen et al. (2011) study demonstrated that the S- curve is an effective quantitative technology forecasting method for TLC analysis based on
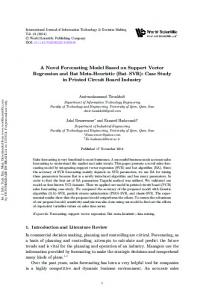
patent data. Technology development track can be effectively understood through TLC displayed by the S-curve (Chiu and Ying, 2012). Altuntas and Dereli (2012) emphasized that the speed of innovation diffusion of technology has to be addressed for investment projects. If the diffusion speed of invested technology is high, this implies that the technology may have higher market potential and innovative activities conducted related to the technology may affect other technologies in the future. Furthermore, the technology scope is related to its economic impact. Investment in a technology that has high technology scope leads to higher economic value and commercialization potential from the investment. If a technology is at the growth stage of its TLC, has high diffusion potential and wide technology scope, this technology can be considered a successful investment. Therefore, four important TF indicators for investment projects are used: (i) technology life cycle (TLC), (ii) diffusion speed of invested technology and technology scope including, (iii) patent power, and (iv) expansion potential in this study. These indicators are explained in the following subsection. 2.2.1. Technology life cycle Technological investments should be analyzed with respect to their current life cycle stage (Haupt et al., 2007). Liu and Wang (2010) introduced three stages of the technology life cycle, namely: initiation, growth and saturation. These stages are illustrated in Fig. 1. The curve in Fig. 1, also called an S-curve, shows that an investment should be made during the growth stage. Many researchers do not recommend investment at the initiation and saturation stage. During the initiation state, the technology is still new to the market. Likewise, there is a high probability that the technology may be replaced with a newer technology in the saturation stage. Actually, investments can also be made at the end of the initiation stage and at the beginning of the saturation stage if the investor can take risks. The approach proposed in this paper assumes that the investments are beneficial if they are made during the growth stage. In this paper, the cumulative number of patents is used to determine the current life cycle stage of technologies to be invested in. TLCs for the technologies assessed use curves involving the cumulative number of patents. Details on the assessment of the stage of TLC based on S-curve can be found in (Ernst (1997), Cheng and Chen (2008), Dubarić et al. (2011), Gao et al. (2013)). Extensive studies on TLC have been performed in the last four years, e.g., Gao et al. (2013), Taylor and Taylor (2012), Dubarić et al. (2011), Ryu and Byeon (2011), Cao and Zhao (2011), and Lee (2010). 2.2.2. Technology diffusion speed Huang and Wang (2011) emphasized that technology can spread and therefore can be used by different firms, organizations and countries through diffusion. Perkins and Neumayer (2005), Xu and Chiang (2005) and Haruna et al. (2010) researched international technology diffusion as a way of examining this process. Patent citation analysis can be used as a way to predict the diffusion speed of various technologies. If a patent is cited by subsequent patents, this implies that the cited patent is diffused, applied and valuable (Chang et al., 2009). Investment in a technology that has high diffusion potential may result in a higher market potential. In this study, the
Accumulated number of patents
S. Altuntas et al. / Technological Forecasting & Social Change 96 (2015) 202–214
Initiation
Growth
205
Saturation Time
Fig. 1. S-curve of TLC (Liu and Wang (2010)).
average number of citations per patent is used as a proxy for technology diffusion speed (see expression (1)). Details for measuring patent technology diffusion are presented by Huang and Wang (2013). Technology diffusion speed ¼ a =b; where a is the total number of forward citations and
and personal digital assistant. These three separate technologies are considered to validate the proposed approach and show how it works. They are selected for application of the proposed method because these three technologies are at the growth stage of their technology life cycle and it is not possible to evaluate these technologies quantitatively with respect to their technology success without a method.
b is the total number of patents that are considered for diffusion
ð1Þ 2.2.3. Technology scope (patent power and the expansion potential) Technology scope criteria assess mainly the breadth of technology. If the breadth of technology is high, this means that the technology has associations with a large amount of different technologies. In this paper, the technology scope is measured by two indicators, the patent power and the expansion potential. Lerner (1994), Jun (2011a), Jun et al. (2012b) and Gao et al. (2013) simplified their data gathering process by using the first four-digits of the IPC (International Patent Classification) code in patent analysis. In this paper, the same fourdigit code is used as a proxy for examining the technology scope. The total numbers of different IPC codes in the patent database that are related to our technologies of interest indicate the expansion potential of these technologies. A higher expansion potential implies a higher possibility of the usage of the technology in new technologies covered by these IPC codes. The development of one technology leads to the development of technologies associated with it. Expansion potential indicates the number of technologies that are related to invested technology. Patent power is defined in expression (2). A higher patent power leads to a higher spillover of technology among different sectors and a higher chance of creating new sectors. This implies that the technology of interest has a stronger association with different technologies and potential for the formation of new sectors. Both patent power and expansion potential are computed to measure technology scope and evaluate technologies. Patent power ¼ x = y;
ð2Þ
2.3.1. Thin film transistor-liquid crystal display technology Thin film transistor-liquid crystal display devices (TFTLCDs) have become increasingly attractive and popular due to their full color display capabilities, low power consumption and
Step 1: Retrieve patents on technologies of interest
Step 2: Draw S-curve for each technology
Step 3: Is the candidate technology at the growth stage of TLC?
NO Step 4: Delete technologies that are not at growth stage and consider the remaining technologies
Step 5: Calculate technology diffusion speed
Step 6: Calculate patent power
Step 7: Calculate expansion potential
where x is the total number of IPC codes included in retrieved patents and y is the total number of patents
Step 8: Use the Condorcet method for data fusion 2.3. Technologies being evaluated
Step 9: Evaluate each technology Three technologies are examined in this section. These are thin film transistor-liquid crystal display, flash memory system
Fig. 2. The proposed method.
YES
206
S. Altuntas et al. / Technological Forecasting & Social Change 96 (2015) 202–214
Table 2 Summary of data from retrieved patents. A
B
C
D
E
F
G
TFT-LCD Flash memory Personal digital assistant
TFT and LCD Flash memory system Personal digital assistant or PDA
November 13, 2012 November 13, 2012 November 13, 2012
178 363 313
1316 5693 9546
308 471 433
21 21 52
A: Technology. B: Query (the research terms are in the titles of the patents). C: Date of retrieval. D: Total # of patents. E: Total # of patent citations. F: Total # of IPC classes. G: # of different IPC classes.
light weight (Lu and Tsai, 2004). They are also thinner, smaller and lighter than other display devices (Lin et al., 2009). Yoon and Park (2005) proposed a keyword-based morphology analysis based on patent data to identify technology opportunities for TFT-LCD technology. The search keyword used for patent analysis was ‘TFT-LCD’ in their study. They found that the
technology is at the growth stage of its technology life cycle based on the number of patent applications. Lu and Tsai (2004) proposed a computer vision-based defect detection scheme for TFT-LCD technology inspections in manufacturing system. In addition, the competitive strategies of Taiwan's TFT-LCD industry (Hung, 2006), material properties of TFT-LCD waste glass
Patent Database
Extracting patents related to TFT and LCD
Extracting patents related to flash memory system
Extracting patents related to personal digital assistant
Find the number of patents for each year
Draw S-curve for TLC
Find the number of patent citations for each year
Calculate technology diffution speed
Find total number of IPC code
Calculate patent power
Find total number of different IPC codes
Calculate expansion potential
Fuse the data with the Condorcet method
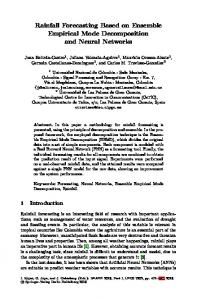
Investment evaluation Fig. 3. Overview of the proposed methodology.
S. Altuntas et al. / Technological Forecasting & Social Change 96 (2015) 202–214
(Lin, 2007), knowledge flows and innovation capability within and across Taiwan's top five major players in the TFT-LCD industry (Hu, 2008), analysis of TFT-LCD industry success factors (Wang et al., 2011), and technological innovation capabilities in the TFT-LCD industry (Hu, 2012) are also examined in the literature. 2.3.2. Flash memory system Flash memory system is one of the portable data storage technologies. It has no moving parts, greater reliability, less power consumption, and faster performance (Wildstrom, 2007). Nowadays, this technology is widely adopted in embedded applications (Chung et al., 2006). Therefore, the flash memory market continues to rise (Yinug, 2007). “Most of the existing research on flash memory has focused on cell research, write/ erase reduction, and the mapping algorithm for cell data, etc.” (Kim et al., 2014). Herein, a review of these researches would deviate from the aim of this paper. Therefore, only patent based studies are examined here. Daim et al. (2008), forecasted the future of two data storage technologies, namely hard disk drive and flash memory based on the numbers of publication patents. They found that the cumulative patents have continued to increase for these two technologies. Choi and Park (2009) proposed an approach to identify patent development paths from a large patent citation network to analyze flash memory technology. The search keyword used for patent analysis was ‘flash memory system’ in their study. 2.3.3. Personal digital assistant A personal digital assistant (PDA) is a mobile device, which is going to become more popular in worker's daily jobs because it allows workers to plan and organize daily jobs and access information that they require in personal life. PDA technology helps users communicate more effectively and efficiently and helps them in managing all their information needs (Bayus et al., 1997). Chen et al. (2007) expressed that PDA applications which exploit wireless communication are appropriate for use in clinical practice. Golden and Geisler (2007) examined the usage and interpretation of PDA technology by workers as a boundary management resource. Lee et al. (2009) conducted a patent analysis for the case of PDA technology to develop keyword-based patent maps and apply them to the idea
207
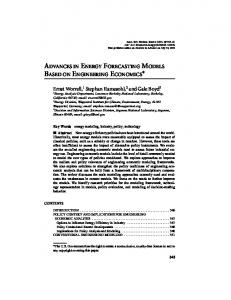
generation phase of new technology creation using 141 PDArelated patent documents. The use of PDA technology in health care systems is also examined from different aspects by Johnson (2008), Garrity and Emam (2006), and Carroll and Christakis (2004). Although there are some studies conducted on thin film transistor-liquid crystal display, flash memory system, and personal digital assistant technologies, there is no study that compares them with respect to future technology success. Existing researches focused on only one of these technologies at a time. To address the needs in technology forecasting, technology life cycle, diffusion speed, patent power, and expansion potential are considered. This study also differs from previous works in that it considers multiple indicators composed of the four key investment factors together. 3. The proposed method The proposed method prioritizes technologies that are awaiting financial investment incentives. The proposed method uses the TF indicators to compute technology success and systematically prioritize the available investment opportunities and therefore, it ranks technologies with respect to their sustainability in the future. The proposed method consists of nine steps as presented in Fig. 2. In Step 1, the data related to the technologies considered in this research is extracted from the patent database. In fact, any suitable patent database could be used in Step 1. Numerous researchers use the United States Patent and Trademark Office (USPTO) database in the literature due to the fact that USPTO receives a vast amount of patent applications each year. Therefore, analysis of these patents may lead to generalizable results. In Step 2, a TLC (S-curve) is constructed by using the cumulative number of patents issued in each year. The cumulative number of patents indicates attractiveness and change of the technology in time. Following that, in Step 3 the question is posed, “Are all of the investment candidates at their growth stage in the TLC?” If the answer to the question in Step 3 is no, the method continues to Step 4 where technologies that are not at the growth stage are deleted and the remaining technologies are considered candidates. It is expected that all technologies should be at growth stage in their TLC to avoid insufficient investment. If the outcome of the
Fig. 4. The number of patents for TFT-LCD, flash memory system and personal digital assistant technologies.
S. Altuntas et al. / Technological Forecasting & Social Change 96 (2015) 202–214
Accumulated number of patents
208
Year
Fig. 5. S-curves of TFT-LCD and flash memory system technologies.
answer in Step 3 is yes, then the method leads to Step 5 where the technology diffusion speed is computed using expression (1). In Step 6, patent power is computed from expression (2). In Step 7, the total number of different IPC codes as a measurement of expansion potential is computed. Steps 6 and 7 also indicate commercialization potential of the technology indirectly. If the values produced by Steps 6 and 7 are high, there is a high possibility that marketing potential of the technology in the future will be high. It is necessary to combine the results of Steps 3, 5, 6 and 7 to rank candidate technologies. The Condorcet method in Step 8 combines and prioritizes the results of these steps. Finally, the technologies are evaluated and ranked in Step 9. 4. Application of the proposed method The proposed method is illustrated using three separate technologies: thin film transistor-liquid crystal display (TFTLCD) technology, flash memory system technology, and personal digital assistant technology. 4.1. Patent analysis
Accumulated number of patents
In Step 1, patents related to TFT-LCD technology, flash memory system technology, and personal digital assistant technology are retrieved using AcclaimIP software (www. acclaimip.com), formerly known as CobaltIP software (www. cobaltip.com). The published patents related to these three technologies were provided by the databank USPT that contains all US granted patents. AcclaimIP software provides different options for patent research and analysis. The users can
research patents by titles, abstracts, country, IPC class and so on. The analysis can be conducted in different patent databases such as European Patent Office (EPO), USPTO, World Intellectual Property Organization (WIPO) and Japan Patent Office (JPO). The keyword “equations” (research queries) were used to collect patent documents for each technology, and to retrieve the total number of patents, patent citation numbers, the total number of IPC classes, and the number of different IPC classes for each technology (see Table 2). The research terms can be conducted with just the titles of the patents (e.g., Jun, 2011a,b; Wu et al., 2010), or with both titles and abstracts of the patents (e.g., Tseng et al., 2011; Lee et al., 2015). In this study, the research terms are in the titles of the patents, i.e., patents that include the research queries in their titles are considered for each technology. All granted patents published in USPTO until November 13, 2012, when this research was conducted, are considered in this paper. In addition, “Word Stemming” feature that is available in the AcclaimIP software is not used to avoid patents which include variations related to word(s) included in research queries. The results of the computational search are summarized in Table 2. The proposed methodology is illustrated in Fig. 3. Fig. 4 illustrates the number of patents in different years for TFT-LCD, flash memory system and personal digital assistant technologies. Fig. 4 demonstrates that even though TFT-LCD technology was developed prior to 2001, it led to new patents in the same year, which points toward its significance. Similarly, the number of patents for flash memory technology increased in 2006 and in subsequent years. The number of patents in personal digital assistant technology increased in 2001. Between 2001 and 2007, the number of patents related to
Year
Fig. 6. S-curve for personal digital assistant technology.
S. Altuntas et al. / Technological Forecasting & Social Change 96 (2015) 202–214
209
Fig. 7. The number of citations for TFT-LCD, flash memory system and personal digital assistant technologies.
personal digital assistant technology remained high, with a peak in 2004. Fig. 5 presents the S-curves for TFT-LCD technology and flash memory system technology. Fig. 6 also illustrates the S-curve for personal digital assistant technology. As
illustrated in Figs. 5 and 6, these three technologies are at the growth stage of their technology life cycle because the cumulative number of patents of these technologies has not begun to stabilize and decline yet. Based on these figures, these
Fig. 8. The cumulative number of citations and S-curve for citations of TFT-LCD and flash memory system technologies.
210
S. Altuntas et al. / Technological Forecasting & Social Change 96 (2015) 202–214
Table 3 Technology diffusion speed.
Table 5 The number of IPC class for patents related to flash memory system technology.
Technology
TFT-LCD Flash memory system Personal digital assistant
Total # of patents
Total # of patent citations
Diffusion speed
124 183 261
1316 5693 8211
10.61 31.11 31.46
technologies have not reached the saturation stage. Therefore, these three technologies should be of equal priority with respect to TLC criteria. The answer to the question in Step 3 of the proposed method (see Fig. 3) is yes and the method continues to Step 5 in this application. Fig. 7 illustrates the number of citations for TFT-LCD technology, flash memory system technology, and personal digital assistant technology. It should be noted that all patents considered in this paper for measuring technology diffusion were issued before November 13, 2008. According to Gay et al. (2005), on average the first patent citation occurs with a four year delay. Therefore, the total number of patents considered for measuring technology diffusion speed is less than the total number of retrieved patents considered for TLC. Fig. 8 illustrates the cumulative number of citations for TFTLCD technology, flash memory system technology, and personal digital assistant technology. As can be seen from this figure, the cumulative number of patent citations for each investment candidate follows the S-curve shown in Fig. 1. Table 3 reports the technology diffusion speed of each investment. As can also be seen from Table 3, personal digital assistant technology has the highest diffusion speed. The investments are ranked as personal digital assistant technology N flash memory system technology N TFT-LCD based technology when evaluating diffusion speed. This means that personal digital assistant technology has the highest diffusion speed among the alternatives. It should be noted that the values given in Tables 3 and 7 do not match exactly as given in Table 2 because the total number of considered patents for measuring each criterion is different. IPC classes and their frequencies for TFT-LCD technology, flash memory system technology, and personal digital assistant technology are provided in Tables 4, 5 and 6, respectively. Comparison of these three investment candidates with respect to technology scope indicators (namely patent power and expansion potential) are summarized in Table 7. As can be seen from Table 7, the total number of considered patents for measuring technology scope is the same as the number of patents that are considered for TLC. IPC codes and their definitions are
Table 4 The number of IPC classes for patents related to TFT-LCD technology. No.
A
B
No.
A
B
No.
A
B
No.
A
B
1 2 3 4 5
G02F H01L G09G G02B G01R
123 76 43 11 10
6 7 8 9 10
G09F H04N G06F G11C H03K
10 8 5 4 4
11 12 13 14 15
G03F H03F B23B C08G F21V
3 2 1 1 1
16 G01N 17 G03B 18 G06K 19 G06T 20 H02M 21 H03M Total 308
1 1 1 1 1 1
A: IPC code. B: Frequency.
No.
A
B
No.
A
B
No.
A
B
No.
A
B
1 2 3 4 5
G06F G11C H01L G06K G01R
237 174 28 3 3
6 7 8 9 10
H04L H05K G11B H03M H04B
4 4 2 2 2
11 12 13 14 15
A43C F02D F16H G05B G08C
1 1 1 1 1
16 G10L 17 H01R 18 H03K 19 H04M 20 H04Q 21 H05B Total 471
1 2 1 1 1 1
A: IPC code. B: Frequency.
provided at the WIPO webpage (http://web2.wipo.int/ipcpub/ #refresh=page). Based on the data in Table 7, TFT-LCD technology has the highest priority, personal digital assistant technology comes second, and flash memory system technology is third with rspect to patent power criteria. On the other hand, the expansion potential of personal digital assistant technology is quite high when compared to TFT-LCD technology and flash memory technology, which have an equal expansion potential (value of 21). Therefore, the prioritization of technology is as in the following: Patent power: TFT-LCD N personal digital assistant N flash memory system Expansion potential: personal digital assistant N TFT-LCD = flash memory system 4.2. The Condorcet method The results from the previous section are summarized in Table 8. As can be seen from this table, TFT-LCD and flash memory technologies have the same ranking with respect to the expansion potential criterion as both have the same expansion potential value (21). Three technologies also have the same ranking with respect to TLC. The Condorcet method is applied to fuse together the different candidate technologies. Each technology is considered a candidate and the result of each criterion is considered a vote in the method. Then, pairwise comparisons are performed to find the total number of
Table 6 The number of IPC classes for patents related to personal digital assistant technology. No.
A
B
No.
A
B
No.
A
B
No.
1 2 3 4 5 6 7 8 9 10 11 12 13
G06F H04M G06K H04B B41J H04L H04N G06Q G02B G01C H01H H04Q G09G
153 49 26 20 18 17 15 12 10 9 8 8 7
14 15 16 17 18 19 20 21 22 23 24 25 26
H05K G01S H04R H04W A45C G02F G09B A61B H01R G08G H02J F21V G10L
7 7 7 6 5 4 3 3 3 2 2 2 2
27 28 29 30 31 32 33 34 35 36 37 38 39
G09F G06T A62C F16M G06G H05B G07C G07D G08C B60R G11C F16B H01M
2 2 1 1 1 1 1 1 1 1 1 1 1
40 B06B 41 F21Y 42 G07G 43 B65G 44 G07F 45 H01Q 46 B65D 47 H03J 48 G01R 49 G05B 50 G05D 51 F24F 52 G05D Total 433
A: IPC code. B: Frequency.
A
B 1 1 1 1 1 1 1 1 1 1 1 1 1
S. Altuntas et al. / Technological Forecasting & Social Change 96 (2015) 202–214 Table 7 Patent power and expansion potential. Technology
Table 9 Pairwise comparison.
Total # Total # of Patent Expansion of IPC considered power potential classes (A) patents (B) (A/B)
TFT-LCD 308 Flash memory system 471 Personal digital assistant 433
211
178 363 313
1.73 1.3 1.38
21 21 52
wins, losses, and ties for each technology. Each complimentary pair is compared to the others to assign one point in the “Win” column for winner, one point in “Lose” column for loser and one point for a tie based on the result of each comparison. The Condorcet method can be utilized in the presence of at least two criteria and two alternatives. An example application of the Condorcet method is shown in Nuray and Can (2006) in the presence of three alternatives and five criteria. Based on the data in Table 8, a pairwise comparison and the corresponding points for TFT-LCD, flash memory and personal digital assistant technologies are provided in Tables 9 and 10. As can be seen from Table 10, the win score for personal digital assistant technology is higher than that of TFT-LCD and flash memory technologies. Therefore, the investment priority for personal digital assistant technology should be higher than that of TFT-LCD and flash memory technologies. The win, lose and tie scores are the same for both TFT-LCD and flash memory technologies. The final ranking is c N a = c. This means that personal digital assistant technology should be supported more than TFT-LCD and flash memory technologies. 5. Conclusion and discussion Forecasting the future success of technology is complex due to the unstable market conditions and limited information. Investors cannot easily see one step ahead in this condition for their technologies that are invested in. Therefore, a new approach is proposed to forecast the future technology success based on patent data which has been extensively used for technology forecasting in the literature. The proposed approach offers an opportunity to track the change of the technology over time for investment. This study addressed three issues in technology dissemination: (i) appropriate stage of the technology life cycle for investment, (ii) diffusion potential of the technology of interest, and (iii) scope of the technology of interest. Multi criteria affect technology success in the future. This study also differs from previous works in that it considers multiple indicators composed of the four key investment factors together. Four criteria, technology life cycle, technology diffusion speed, patent power, and patent expansion were considered in this paper. In addition, previous studies generally focused on TLC of investment alternatives at a time. Proposed Table 8 Ranking of investments with respect to criteria. Criteria
Rank
TLC stage Technology diffusion speed Patent power Expansion potential
a=b=c cNbNa aNcNb cNa=b
a: TFT-LCD technology. b: Flash memory technology. c: Personal digital assistant technology.
a b c
a
b
c
– (1, 1, 2) (2, 1 ,1)
(1, 1, 2) – (3, 0, 1)
(1, 2, 1) (0, 3, 1) –
a: TFT-LCD technology. b: Flash memory technology. c: Personal digital assistant technology.
methods in the literature did not use these four criteria together. Addressing these issues prior to investment resulted in numerous benefits. For example, the investor can foresee opportunities and threats related to his/her investment and can also seize the opportunity to revise his/her investment project(s) and the government may decide whether to support the investor(s). An investment project which has high priority can be supported more and should gain more incentives than others which have less priority in the constructed investment incentive system in a country. In addition, an investment project which has high priority indicates technology success as well as its possible direction in the future. Technology spillover among different technology classes can be pursued as well. Patents were applied for technology forecasting using AcclaimIP software. However, the most difficult task in the proposed approach was to obtain data for analysis which was downloaded from a patent database. A new method for technology forecasting using four criteria for patent analysis and the Condorcet method for data fusion was proposed. The proposed method readily facilitates a prioritization of possible investments. The utility of the proposed method was demonstrated with a comparative study of three technologies: TFT-LCD technology, flash memory system technology, and personal digital assistant technology. The researches in the literature focused on only one of these technologies at a time. There is no study that compares them with respect to future technology success. The proposed method ranked these technologies in terms of their investment potential. Personal digital assistant technology emerged ahead of the other two technologies. The results from the case study showed that the proposed approach can be utilized to forecast technology success based on patent data. The proposed method provides answers to questions such as: which technologies are appropriate for investment, and what is the prioritization among technologies? Distinction among technologies with respect to future technology success can be easily performed through the proposed method. Therefore, successful investment alternative(s) can be selected among available investment proposals. Decision makers, managers or researchers can use the proposed method to prioritize investment projects with respect to future technology success. There are some limitations to this study. First, patent data was retrieved from the patent database by using the research Table 10 Assigned points.
a b c
Win
Lose
Tie
0 0 2
1 1 0
1 1 0
a: TFT-LCD technology. b: Flash memory technology. c: Personal digital assistant technology.
212
S. Altuntas et al. / Technological Forecasting & Social Change 96 (2015) 202–214
terms with just the titles of the patents. The research that uses the research terms in titles, abstracts, keywords and claims of the patents can be performed to extend the results reported in this paper. Second, the results of this paper are limited only to patent data. In addition to patent data, publication data, which can be obtained from the Science Citation Index and Compendex, can be also taken into account in the technology forecasting process. Third, generating the number of citations and IPC codes for each patent is not easy to do. There is a need for software computing of the number of citations and IPC codes. Fourth, there are many factors affecting investment decisions such as payback period of the investment, break-even point for the investment, marketing success of the investment, location, raw material proximity, labor availability, etc. These factors can be also taken into account in the technology forecasting process for evaluation of investments. Fifth, the proposed method assumes that investment is beneficial and productive for the investor, if it takes place in the growth stage of TLC and all conclusions therefore are subject to this assumption. In future research, the Bass diffusion model will be used to measure technology diffusion potential. Additionally, a better use of IPC patent classes will be studied in future research. As a high risk investment may take place at the end of the initiation stage, the fuzziness between the end of the initiation stage and the beginning of the growth stage will be examined with fuzzy logic. Marketing success of technology can also be forecasted. Export potential, domestic market potential and technology novelty can be taken into account as evaluation criteria for forecasting marketing success in future studies. The technologies, which are in the scope of the technology of interest, falling into radical and gradual technologies should be considered in future research. Furthermore, the innovation potential of technologies can be considered in the evaluation process because patent data also provides knowledge about innovation (especially incremental innovation). Finally, Gompertz and Pearl growth curves can be applied to forecast TLC stages of the technologies. Acknowledgments The authors would like to thank the three anonymous reviewers for their insightful comments and suggestions that have significantly improved the paper. References Altuntas, S., Dereli, T., 2012. An evaluation index system for prediction of technology commercialization of investment projects. J. Intell. Fuzzy Syst. 23 (6), 327–343. Altuntas, S., Dereli, T., 2015. A novel approach based on DEMATEL method and patent citation analysis for prioritizing a portfolio of investment projects. Expert Syst. Appl. 42, 1003–1012. Altuntas, S., Dereli, T., Kusiak, A., 2015. Analysis of patent documents with weighted association rules. Technol. Forecast. Soc. Chang. 92, 249–262. http://dx.doi.org/10.1016/j.techfore.2014.09.012. Anderson, T.R., Daim, T.U., Kim, J., 2008. Technology forecasting for wireless communication. Technovation 28 (9), 602–614. Balachandra, R., 1980a. Technological forecasting: who does it and how useful is it? Technol. Forecast. Soc. Chang. 16 (1), 75–85. Balachandra, R., 1980b. Perceived usefulness of technological forecasting techniques. Technol. Forecast. Soc. Chang. 16 (2), 155–166. Bayus, B.L., Jain, S., Rao, A.G., 1997. Too little, too early: introduction timing and new product performance in the personal digital assistant industry. J. Mark. Res. 34 (1), 50–63.
Bengisu, M., Nekhili, R., 2006. Forecasting emerging technologies with the aid of science and technology databases. Technol. Forecast. Soc. Chang. 73 (7), 835–844. Campbell, R.S., 1983. Patent trends as a technological forecasting tool. World Patent Inf. 5 (3), 137–143. Cao, Y., Zhao, L., 2011. Intellectual property management model in enterprises: a technology life cycle perspective. Int. J. Innov. Technol. Manag. 8 (2), 253–272. Carroll, A.E., Christakis, D.A., 2004. Pediatricians' use of and attitudes about personal digital assistants. Pediatrics 113 (2), 238–242. Chang, S.W.C., Trappey, C.V., Trappey, A.J.C., Wu, S.C.Y., 2014. Forecasting dental implant technologies using patent analysis. PICMET '14: Infrastructure and Service Integration, Kanazawa, Japan, pp. 1483–1491. Chang, S.B., Lai, K.K., Chang, S.M., 2009. Exploring technology diffusion and classification of business methods: using the patent citation network. Technol. Forecast. Soc. Chang. 76 (1), 107–117. Chen, Y.C., Chiu, H.C., Tsai, M.D., Chang, H., Chong, C.F., 2007. Development of a personal digital assistant-based wireless application in clinical practice. Comput. Methods Prog. Biomed. 85 (2), 181–184. Chen, Y.H., Chen, C.Y., Lee, S.C., 2010. Technology forecasting of new clean energy: the example of hydrogen energy and fuel cell. Afr. J. Bus. Manag. 4 (7), 1372–1380. Chen, Y.H., Chen, C.Y., Lee, S.C., 2011. Technology forecasting and patent strategy of hydrogen energy and fuel cell technologies. Int. J. Hydrog. Energy 36 (12), 6957–6969. Cheng, A.C., Chen, C.Y., 2008. The technology forecasting of new materials: the example of nanosized ceramic powders. Rom. J. Econ. Forecast. 5 (4), 88–110. Cheng, A.C., Chen, C.Y., Chen, C.Y., 2008. A fuzzy multiple criteria comparison of technology forecasting methods for predicting the new materials development. Technol. Forecast. Soc. Chang. 75 (1), 131–141. Chiu, Y.J., Ying, T.M., 2012. A novel method for technology forecasting and developing R&D strategy of building integrated photovoltaic technology industry. Math. Probl. Eng. 2012, 1–24. Cho, Y., Daim, T., 2013. Technology forecasting methods. In: Daim, T., et al. (Eds.), Research and Technology Management in the Electricity Industry. Green Energy and Technology, pp. 67–112. Choi, S., Jun, S., 2014. Vacant technology forecasting using new Bayesian patent clustering. Technol. Anal. Strat. 26 (3), 241–251. Choi, C., Park, Y., 2009. Monitoring the organic structure of technology based on the patent development paths. Technol. Forecast. Soc. Chang. 76 (6), 754–768. Chung, T.S., Park, D.J., Park, S., Lee, D.H., Lee, S.W., Song, H.J., 2006. System software for flash memory: a survey. LNCS 4096, pp. 394–404. Coates, V., Farooque, M., Klavans, R., Lapid, K., Linstone, H.A., Pistorius, C., Porter, A.L., 2001. On the future of technological forecasting. Technol. Forecast. Soc. Chang. 67 (1), 1–17. Condorcet, 1785. Essai sur l'Application de l'Analyse a la Probabilite des Decisions Rendues a la Pluralite des Voix, Paris. Daim, T.D., Rueda, G., Martin, H., Gerdsri, P., 2006. Forecasting emerging technologies: use of bibliometrics and patent analysis. Technol. Forecast. Soc. Chang. 73 (8), 981–1012. Daim, T.D., Ploykitikoon, P., Kennedy, E., Choothian, W., 2008a. Forecasting the future of data storage: case of hard disk drive and flash memory. Foresight 10 (5), 34–48. Daim, T.U., Iskin, I., Ho, D., 2010. Technology forecasting for residential energy management devices. Foresight 13 (6), 70–87. Daim, T., Harell, G., Hogaboam, L., 2012. Forecasting renewable energy production in the US. Foresight 14 (3), 225–241. Dereli, T., Yucesoy, S., Durmusoglu, A., 2013. Forecasting mobile phone specification with data envelopment analysis, 13. Üretim Araştırmaları Sempozyumu, pp. 545–551 (In Turkish). Dubarić, E., Giannoccaro, D., Bengtsson, R., Ackermann, T., 2011. Patent data as indicators of wind power technology development. World Patent Inf. 33 (2), 144–149. Ernst, H., 1997. The use of patent data for technological forecasting: the diffusion of cnc-technology in the machine tool industry. Small Bus. Econ. 9 (4), 361–381. Firat, A.K., Woon, W.L., Madnick, S., 2008. Technological forecasting—a review. Working paper CISL# 2008-15, pp. 1–19. Gallegoa, M.D., Luna, P., Bueno, S., 2008. Designing a forecasting analysis to understand the diffusion of open source software in the year 2010. Technol. Forecast. Soc. Change 75 (5), 672–686. Gao, L., Porter, A.L., Wang, J., Fang, S., Zhang, X., Ma, T., Wang, W., Huang, L., 2013. Technology life cycle analysis method based on patent documents. Technol. Forecast. Soc. Chang. 80 (3), 398–407. Garrity, C., Emam, K.E., 2006. Who's using PDAs? Estimates of PDA use by health care providers: a systematic review of surveys. J. Med. Internet Res. 8 (2), e7. Gay, C., Bas, C.L., Patel, P., Touach, K., 2005. The determinants of patent citations: an empirical analysis of French and British patents in the US. Econ. Innov. New Tech. 14 (5), 339–350.
S. Altuntas et al. / Technological Forecasting & Social Change 96 (2015) 202–214 Golden, A.G., Geisler, C., 2007. Work–life boundary management and the personal digital assistant. Hum. Relat. 60 (3), 519–555. Harell, G., Daim, T.U., 2009. Forecasting energy storage technologies. Foresight 11 (6), 74–85. Haruna, S., Jinji, N., Zhang, X., 2010. Patent citations, technology diffusion, and international trade: evidence from Asian countries. J. Econ. Financ. 34 (4), 365–390. Haupt, R., Kloyer, M., Lange, M., 2007. Patent indicators for the technology life cycle development. Res. Policy 36 (3), 387–398. Hu, M.C., 2008. Knowledge flows and innovation capability: the patenting trajectory of Taiwan's thin film transistor-liquid crystal display industry. Technol. Forecast. Soc. Chang. 75 (9), 1423–1438. Hu, M.C., 2012. Technological innovation capabilities in the thin film transistorliquid crystal display industries of Japan, Korea, and Taiwan. Res. Policy 41 (3), 541–555. Huang, L., Wang, N., 2011. Status and prospects of technology diffusion research based on patent information. Proceedings of Portland International Conference on Management of Engineering & Technology (PICMET '11): Technology Management in the Energy-Smart Word, pp. 698–704. Huang, K., Wang, N., 2013. Status and prospects of technology diffusion research based on patent information. L.N.E.E. 185, 167–180. Hung, S.V., 2006. Competitive strategies for Taiwan's thin film transistor-liquid crystal display (TFT-LCD) industry. Technol. Soc. 28 (3), 349–361. Hussler, C., Muller, P., Rondé, P., 2011. Is diversity in Delphi panelist groups useful? Evidence from a French forecasting exercise on the future of nuclear energy. Technol. Forecast. Soc. Chang. 78 (9), 1642–1653. Iamratanakul, S., Anderson, T.R., Inman, L., Iamratanakul, S., Anderson, T.R., Inman, L., 2005. Measuring the changing capabilities of computer display projectors using TFDEA. PICMET '05: Technology Management: A Unifying Discipline for Melting the Boundaries. Inman, L., 2004. Technology forecasting using data envelopment analysis. Department of Engineering and Technology Management. (Ph.D thesis). Portland State University. Inman, L., Anderson, T.R., Harmon, R., 2006. Predicting U.S. jet fighter aircraft introductions from 1944 to 1982: a dogfight between regression and TFDEA. Technol. Forecast. Soc. Chang. 73 (9), 1178–1187. Intepe, G., Bozdag, E., Koc, T., 2013. The selection of technology forecasting method using a multi-criteria interval-valued intuitionistic fuzzy group decision making approach. Comput. Ind. Eng. 65 (2), 277–285. Jahromi, S.R., Tudori, A.A., Anderson, T.R., 2013. Forecasting hybrid electric vehicles using TFDEA. PICMET '13: Technology Management for Emerging Technologies, pp. 2098–2107. Jaranyagorn, P., Ngavej, C.C., 2012. Technology forecasting methods with emphasis on bibliographic analysis and curve fitting: a photocatalytic case example. Adv. Mater. Res. 442, 144–148. Johnson, C., 2008. Nurses and the use of personal digital assistants (PDAs) at the point of care. Scroll 1 (1), 1–9. Jun, S., 2011a. IPC code analysis of patent documents using association rules and maps—patent analysis of database technology. Comm. Com. Inf. Sci. 258, 21–30. Jun, S., 2011b. IPC code analysis of patent documents using association rules and maps — patent analysis of database technology. (book chapter). In: Kim, T.H., Adeli, H., Cuzzocrea, A., Arslan, T., Zhang, Y., Ma, J., Chung, K.I., Mariyam, S., Song, X. (Eds.), Database Theory and Application, Bio-Science and Bio-Technology Communications in Computer and Information Science 258, pp. 21–30. Jun, S., 2011c. A forecasting model for technological trend using unsupervised learning. Commun. Comput. Inf. Sci. 258 (2011), 51–60. Jun, S., Lee, S.J., 2012. Emerging technology forecasting using new patent information analysis. I.J.S.E.I.A. 6 (3), 107–116. Jun, S., Uhm, D., 2010. Technology forecasting using frequency time series model: bio-technology patent analysis. J. Mod. Math. Stat. 4 (3), 101–104. Jun, S., Park, S.S., Jang, D.S., 2012a. Technology forecasting using matrix map and patent clustering. Ind. Manage. Data Syst. 112 (5), 786–807. Jun, S., Park, S.S., Jang, D.S., 2012b. Patent management for technology forecasting: a case study of bio-industry. J. Intellect. Prop. Rights 17 (6), 539–546. Karakan, G., Koc, T., 2008. Technology forecasting methods and an application to white goods sector. J. Ind. Eng. (Turk. Chamb. Mech. Eng.) 20 (1), 29–38 (In Turkish). Kassicieh, S., Rahal, N., 2007. A model for disruptive technology forecasting in strategic regional economic development. Technol. Forecast. Soc. Chang. 74 (9), 1718–1732. Kim, C.G., Kim, K.J., Lee, J.H., 2014. NAND flash memory system based on the Harvard buffer architecture for multimedia applications. Multimedia Tools Appl. http://dx.doi.org/10.1007/s11042-014-2122-z. Lamb, A.M., Daim, T.U., Anderson, T.R., 2010. Forecasting airplane technologies. Foresight 12 (3), 38–54. Lee, S.H., 2010. An analysis of technology market from the perspective of technology life cycle. Afr. J. Bus. Manag. 4 (17), 3641–3654.
213
Lee, S., Shih, H., 2011. Forecasting of electricity costs based on an enhanced gray-based learning model: a case study of renewable energy in Taiwan. Technol. Forecast. Soc. Chang. 78 (7), 1242–1253. Lee, S., Yoon, B., Park, Y., 2009. An approach to discovering new technology opportunities: keyword-based patent map approach. Technovation 29 (6–7), 481–497. Lee, C., Cho, Y., Seol, H., Park, Y., 2012. A stochastic patent citation analysis approach to assessing future technological impacts. Technol. Forecast. Soc. Chang. 79 (1), 16–29. Lee, S., Kim, W., Kim, Y.M., Lee, H.Y., Oh, K.J., 2014. The prioritization and verification of IT emerging technologies using an analytic hierarchy process and cluster analysis. Technol. Forecast. Soc. Chang. 87, 292–304. Lee, C., Kang, B., Shin, J., 2015. Novelty-focused patent mapping for technology opportunity analysis. Technol. Forecast. Soc. Chang. 90 (Part B), 355–365. Lemos, A.D., Porto, A.C., 1998. Technological forecasting techniques and competitive intelligence: tools for improving the innovation process. Ind. Manage. Data Syst. 98 (7), 330–337. Lerner, J., 1994. The importance of patent scope: an empirical analysis. RAND J. Econ. 25 (2), 319–333. Levary, R.R., Han, D., 1995. Choosing a technological forecasting method. Ind. Manage. 37 (1), 14–18. Li, S., Zheng, D., Shi, J., 2014. Technology forecasting of green energy using patent analysis and simulation modeling. Adv. Mater. Res. 875–877, 1619–1624. Lim, D.J., Anderson, T.R., Kim, J., 2012. Forecast of wireless communication technology: a comparative study of regression and TFDEA model. PICMET '12: Technology Management for Emerging Technologies, Vancouver, Canada, pp. 1247–1253. Lim, D.J., Runde, N., Anderson, T.R., 2013. Applying technology forecasting to new product development target setting of LCD panels. Adv. Bus. Manag. Forecast. 9, 137–152. Lin, K.L., 2007. The effect of heating temperature of thin film transistor-liquid crystal display (TFT-LCD) optical waste glass as a partial substitute partial for clay in eco-brick. Clean. Prod. 15 (18), 1755–1759. Lin, C.T., Yang, S.Y., 2003. Forecast of the output value of Taiwan's optoelectronics industry using the Grey forecasting model. Technol. Forecast. Soc. Chang. 70 (2), 177–186. Lin, K.L., Huang, W.J., Shie, J.L., Lee, T.C., Wang, K.S., Lee, C.H., 2009. The utilization of thin film transistor liquid crystal display waste glass as a pozzolanic material. Hazard. Mater. 163 (2–3), 916–921. Linton, J.D., Yeomans, J.S., 2002. The role of forecasting in sustainability. Technol. Forecast. Soc. Chang. 70 (1), 21–38. Liu, C.Y., Wang, J.C., 2010. Forecasting the development of the biped robot walking technique in Japan through S-curve model analysis. Scientometrics 82 (1), 21–36. Lu, C.J., Tsai, D.M., 2004. Defect inspection of patterned thin film transistorliquid crystal display panels using a fast sub-image-based singular value decomposition. Int. J. Prod. Res. 42 (20), 4331–4351. Martino, J.P., 2003. A review of selected recent advances in technological forecasting. Technol. Forecast. Soc. Chang. 70 (8), 719–733. Miller, P., Swinehart, K., 2010. Technological forecasting: a strategic imperative. J.G.B.M. 6 (2), 1–5. Mishra, S., Deshmukh, S.G., Vrat, P., 2002. Matching of technological forecasting technique to a technology. Technol. Forecast. Soc. Chang. 69 (1), 1–27. Nuray, R., Can, F., 2006. Automatic ranking of information retrieval systems using data fusion. Inf. Process. Manag. 42 (3), 595–614. Patino, S., Kim, J., Daim, T.U., 2010. Forecasting wireless communication technologies. Int. J. Appl. Manag. Sci. 2 (2), 169–197. Perkins, R., Neumayer, E., 2005. The international diffusion of new technologies: a multitechnology analysis of latecomer advantage and global economic integration. Ann. Assoc. Am. Geogr. 95 (4), 789–808. Pretorius, L., Winzker, D.H., 2010. Biomedical technology: a case study of forecasting in pulsed electro magnetic field therapy. PICMET '10: Technology Management for Global Economic Growth, July 18–22, Phuket, Thailand, pp. 248–253. Ranaei, S., Karvonen, M., Suominen, A., Kässi, T., 2014. Forecasting emerging technologies of low emission vehicle. PICMET '14: Infrastructure and Service Integration, Kanazawa, Japan, pp. 2924–2937. Ryu, J., Byeon, S.C., 2011. Technology level evaluation methodology based on the technology growth curve. Technol. Forecast. Soc. Change 78 (6), 1049–1059. Shin, J., Park, Y., 2009. Brownian agent-based technology forecasting. Technol. Forecast. Soc. Chang. 76 (8), 1078–1091. Spatar, D., Amini, M., Bahrini, S., Mallak, M., Tamimi, S., 2012. TFDEA application for solar industry. PICMET '12: Technology Management for Emerging Technologies, Vancouver, Canada, pp. 1254–1259. Taylor, M., Taylor, A., 2012. The technology life cycle: conceptualization and managerial implications. Int. J. Prod. Econ. 140 (1), 541–553. Trappey, C.V., Wu, H.Y., Fataneh, T.D., Trappey, A.J.C., 2011. Using patent data for technology forecasting: China RFID patent analysis. Adv. Eng. Inform. 25 (1), 53–64.
214
S. Altuntas et al. / Technological Forecasting & Social Change 96 (2015) 202–214
Tseng, F.M., Yu, H.C., Tzeng, G.H., 2002. Combining neural network model with seasonal time series ARIMA model. Technol. Forecast. Soc. Chang. 69 (1), 71–87. Tseng, F.M., Hsieh, C.H., Peng, Y.N., Chu, Y.W., 2011. Using patent data to analyze trends and the technological strategies of the amorphous silicon thin-film solar cell industry. Technol. Forecast. Soc. Chang. 78 (2), 332–345. Walk, S.R., 2012. Quantitative technology forecasting techniques. (book chapter). In: Teixeira, Aurora A.C. (Ed.), Technological Change. ISBN: 978953-51-0509-1. Wang, S.T., Li, M.H., Lin, W.T., 2011. An analysis of TFT-LCD industry success factors by integrating FDAHP and gray sequencing. Afr. J. Bus. Manag. 5 (27), 11011–11021. Wildstrom, S.H., 2007. How flash will change PCs, Business Week Online. Available at: http://www.businessweek.com/stories/2007-06-10/how-flashwill-change-pcs (Accessed on 09 September, 2014). Wu, F.S., Shiu, C.C., Lee, P.C., Su, H.N., 2010. Integrated methodologies for mapping and forecasting science and technology trends: a case of etching technology. PICMET '10: Technology Management for Global Economic Growth, July 18–22, Phuket, Thailand, pp. 267–289. Xu, B., Chiang, E.P., 2005. Trade, patents and ınternational technology diffusion. J.I.T.E.D. 14 (1), 115–135. Yinug, C.F., July 2007. The rise of the flash memory market: its impact on firm behavior and global semiconductor trade patterns. J. Int. Commer. Econ. 1–25 (Available at: http://www.usitc.gov/publications/332/journals/rise_ flash_memory_market.pdf, Accessed on 09 September, 2014). Yoon, J., Kim, K., 2012a. An analysis of property–function based patent networks for strategic R&D planning in fast-moving industries: the case of siliconbased thin film solar cells. Expert Syst. Appl. 39 (9), 7709–7717. Yoon, J., Kim, K., 2012b. Trend perceptor: a property–function based technology intelligence system for identifying technology trends from patents. Expert Syst. Appl. 39 (3), 2927–2938. Yoon, B., Park, Y., 2005. A systematic approach for identifying technology opportunities: keyword-based morphology analysis. Technol. Forecast. Soc. Chang. 72 (2), 145–160. Yoon, B., Park, Y., 2007. Development of new technology forecasting algorithm: hybrid approach for morphology analysis and conjoint analysis of patent information. IEEE Trans. Eng. Manag. 54 (3), 588–599. Zhu, D., Porter, A.L., 2002. Automated extraction and visualization of information for technological intelligence and forecasting. Technol. Forecast. Soc. Chang. 69 (5), 495–506.
Serkan Altuntas is an Asst. Prof. Dr. at the Industrial Engineering Department of the Yıldız Technical University in Turkey. He got his B.Sc degree in industrial engineering, from Eskisehir Osmangazi University, Eskisehir, Turkey. He got his M.Sc degree in industrial engineering, from Dokuz Eylul University in Izmir, Turkey. He got his Ph.D. degree in the Department of Industrial Engineering at the University of Gaziantep. His research interests include, facility layout, multicriteria decision making and technology evaluation. Türkay Dereli is a professor of IE at the Department at the University of Gaziantep (UoG) in Turkey. He received his BSc. and MSc. in Mech. Eng. from METU and UoG, in 1992 and 1994, respectively. He earned his Ph.D. degree from the UoG, Institute of Natural and Applied Sciences, in 1998. He has published numerous papers in professional academic journals and conferences, and has some textbooks on CAD/CAM, IT, brand and quality management. His current research interests include: technology management, CAD/CAM, quality planning and control, TQM, agile/responsive manufacturing, management, informatics and applications of artificial intelligence. Andrew Kusiak (M'89) received his B.S. and M.S. degrees in engineering from the Warsaw University of Technology, Warsaw, Poland, in 1972 and 1974, respectively, and the Ph.D. degree in operations research from the Polish Academy of Sciences, Warsaw, in 1979.He is currently Professor and Chairman of the Department of Mechanical and Industrial Engineering, The University of Iowa, Iowa City, IA, USA. He speaks frequently at international meetings, conducts professional seminars, and does consultation for industrial corporations. He has served on the editorial boards of over 40 journals. He is the author or coauthor of numerous books and technical papers in journals sponsored by professional societies, such as the Association for the Advancement of Artificial Intelligence, the American Society of Mechanical Engineers, Institute of Industrial Engineers, and so on. His current research interests include applications of computational intelligence in automation, wind and combustion energy, manufacturing, product development, and healthcare.Prof. Kusiak is the Institute of Industrial Engineers Fellow and the Editor-in-Chief of the Journal of Intelligent Manufacturing.