Foreign direct investment, trade openness and economic growth linkages in Vietnam: an empirical application of ARDL approach Author: Anh Tu, Nguyen Affiliation: Faculty of Banking, Banking university of Ho Chi Minh city, Vietnam Correspondence address: 39 Ham Nghi st, 1st district, Ho Chi Minh city, Vietnam Email address:
[email protected] Telephone number: (+84) 938130187
ABSTRACT: This article empirically examines the linkages among time series of foreign direct investment (FDI), trade openness and economic growth in Vietnam for period 1986-2015. The analysis based on the autoregressive distributed lag model (ARDL) reveals the cointegration between these variables. For instance, FDI has significantly positive effects on economic growth of long run and short run. The speed of adjustment shows that the system takes to restore equilibrium path rapidly. Export has positive impacts on economic growth while import has negative ones, however, both of them are insignificant. Diagnostic and stable tests confirm the exactness of ARDL model. DOLS and FMOLS reaffirm the results. Furthermore, impulse response functions and variance decomposition also report the similar results. Keywords: ARDL approach, economic growth, FDI, trade openness, Vietnam JEL code: F13.F23.O44.O53 1. Introduction Foreign direct investment (FDI) and trade are supposed to be important factors of promoting economic growth. Trade promotes capital accumulation, human resources, and technology transferability, hence, increasing the productivity of a nation (Frankel and Romer 1999). This procedure takes place when importers bring new technologies inside border, which accelerate research and development. In other words, imports play an important role in technology diffusion (Coe, Helpman, and Hoffmaister 1995, Keller and Yeaple 2003). Then, goods produced domestically
will increase competitiveness, providing impetus to exports and thereby promoting economic growth. Also, trade openness leads to the shift of FDI inflow because foreign investors seek to increase competitive advantages through allocating scarce resources effectively, while host countries also have benefits of the direct and indirect effects of FDI (De Mello 1999). Some cases support the linkage between FDI, trade and growth. For example, Korean companies have reinforced the textile industry in Bangladesh from trivial proportion to main export commodity (Aitken, Hanson, and Harrison 1997); In China, since trade policy was improved, there has been a rapid development in the economic growth related to the presence of foreign investment (Zhao and Du 2007); In India, US technology companies in the late 1980s has bolstered the competitiveness of local software industry (UNCTAD 1999, p.250). Since the 1980s most of the regulations have been modified from tightening to extending new frameworks to attract FDI inflow, particularly from 1991 to 1997, 94% of these towards creating a more favourable environment for FDI (UNCTAD 1999, p.67). In Vietnam, FDI accounted for 27% of exports, 35% of total industrial output and 25% of total tax revenues in the 1990s (Freeman 2002), raising 0.13% of exports per 1% growth of FDI into Vietnam (Xuan and Xing 2008). Iamsiraroj and Ulubaşoğlu (2015), however, point out that 17% of 108 published studies on FDI-economic relationships concluded that FDI had the significantly negative impact on economic growth. There are several reasons why the results of these studies are heterogeneous. First, the patterns of economic growth depend on many factors that are difficult to isolate while FDI itself affects them. Consequently, the trend of impact is unclear (UNCTAD 1999, p.315). Second, some factors such as competition, the quality of labor or the level of local productivity could neutralize the FDI spillovers. Wang and Blomström (1992) argue that if the host companies’ performance is low, technology transferability will be ineffective. Aitken and Harrison (1999) argue that multinational companies have low marginal cost because of specialized production advantages, which allows them to attract domestic consumption. Consequently, domestic firms have to cut production and increase the average cost curve. Lipsey and Sjöholm (2005) contend that if domestic ownership in industries is too small or the local firms are unable to learn from foreign 2
companies, the latter will crowd out the former through competition. Another reason for crowding out effect is that multinational companies attract scarce resources, for example, skilled labor than domestic firms do (Herzer 2012). Görg and Greenaway (2004) suppose that FDI firms tend to protect production know-how against domestic firms; consequently, spillovers are neutralized and it is difficult for domestic firms which use a low level of technology or unskilled labor to learn from multinational companies. Benhabib and Spiegel (1994) argue that the effect of foreign investment depends on the quality of human resources in host countries; Borensztein, De Gregorio, and Lee (1998) deem that unless host country has the high enough level of human capital to absorb new technology, FDI will be ineffective; Alfaro et al. (2004) contend that the more countries with developed financial markets, the more contribution of FDI to economic growth. For instance, Vietnam received FDI from Japan in 1988 and by the end of 2015, Japan is the second largest investor in Vietnam (GSO 1996, 2015). Nevertheless, 38% and 65.2% of Japanese enterprises regard the quality of human resources and the ability of local suppliers to provide raw materials, respectively, are major issues in the management of Japanese enterprises in Vietnam (JETRO 2016, p.31-33). The fact that shortage of skilled labor and technology gaps hinder spillovers have been addressed by Nguyen et al. (2006) in the case of Vietnam. These results show that when trade is expanded, the impact of FDI on economic growth through technology diffusion or human capital is ambiguous. Accordingly, there seems to be no existence of FDI-led growth in Vietnam. This study focuses on investigating the relationship between FDI and economic growth in the context of trade liberalization in Vietnam. If there exists the linkage between FDI and economic growth, the government should continue to make incentive programs to attract FDI as it has done. The rest of this paper is organized as follows: Section 2 provides a brief overview of FDI and economic growth in the context of trade liberalization in Vietnam. Section 3 presents a theoretical and empirical literature review. Section 4 presents the framework of econometric analysis and research data. Section 5 shows the main empirical results. Section 6 gives some conclusions. 3
2. Trade openness, FDI and economic growth in Vietnam Since Doi Moi reform in 1986, Vietnam has made efforts to amend policies to encourage trade and investment liberalization. There have been shifts from an agricultural based economy to an industrial economy (Anwar and Nguyen 2010). This progress could be related to the change in economic management with the first version of foreign investment law in 1987. The net FDI inflow had been negligible before 1986, then it rose rapidly to a peak of 11.9% in 1994 and remained at 8.8% until Asian financial crisis 1997-98. In the second phase, the foreign investment law was amended in 2005, expanding the investment sector to foreign investors. Accordingly, 100% of foreign-owned enterprises established in Vietnam or through merger and acquisition were allowed to invest in various sectors such as education, health, maritime transport, which had been run by state-owned enterprises. This initiative policy stimulated FDI inflow. In addition, Vietnam’s becoming a member of the World Trade Organization in 2007 could also be a factor in facilitating trade and capital flows. Thus, FDI and trade sharply increased for 3 years after that, 9.1% and 154% on average respectively (WorldBank 2016a, 2016b). In the third stage, due to the impact of the global economic recession in 2008, the ratio of FDI inflows to GDP fluctuated around 5.8% for 2009-2015 period while trade saw an increase to around 160%. Generally, since 1986 policies changed towards attracting FDI, generating interest from foreign investors and creating a better investment environment, FDI has seemed to be an important factor in the development. In fact, it accounted for 22.5% of the total investment in last two decades (GSO 2005, 2010, 2015) 3. Literature review The endogenous growth model suggests that FDI enhances local productivity through spillovers of technology advances such as importation of modern facilities or learning by watching (De Mello Jr 1997, Barro and Sala-i-Martin 1997, Borensztein, De Gregorio, and Lee 1998); shifting the knowledge of production to host countries (Wang 1990, Glass and Saggi 2002); promoting domestic production through participation in the supply chain of FDI enterprises (De Mello Jr 1997). The technology transferability is carried out through five channels: learning by 4
watching, labor mobility, supplier contacts, customer contacts and networking to other strategies (Günther 2002), among which human capital and learning by watching are the important external factors determining economic growth (Balasubramanyam, Salisu, and Sapsford 1996). In addition, FDI enterprises create new jobs, enlarge exports, and raise tax income for the host country. There are a lot of empirical studies supporting FDI led growth hypothesis in the context of trade liberalization. Balasubramanyam, Salisu, and Sapsford (1996) with a study of 46 developing countries in 1970-2003 period verify the hypothesis of Bhagwati (1978) that the impact of FDI on the output in export oriented countries is greater than import substituting countries; the same conclusion was also made by Kohpaiboon (2003) in the case of Thailand in the 1970-1999 period; Nair‐Reichert and Weinhold (2001) with a study of 24 developing countries in the period 19711995, conclude that there is a positive impact of FDI on growth and this effect is stronger if a country pursues trade openness; Makki and Somwaru (2004) with a study of the developing countries for 1960-2000 period, suggest that FDI and trade have a positive impact on growth and FDI is the main channel for technology diffusion to developing countries. Other empirical studies by Zhang (2001), Liu, Burridge, and Sinclair (2002), Liu, Shu, and Sinclair (2009), Bende-Nabende and Ford (1998), Bengoa and Sanchez-Robles (2003), Chang (2005), Yao (2006), Iqbal, Shaikh, and Shar (2010), Sami and Kreishan (2012), Szkorupová (2014), Kalai and Zghidi (2017), Sunde (2017) draw the same conclusions about the positive impact of trade openness and FDI on the growth in their samples. Nevertheless, some empirical studies show heterogeneous results across the sample countries using panel data (Goldberg and Klein 1999, Bende-Nabende et al. 2003, Hsiao and Hsiao 2006). In one sample the two hypotheses of trade-led growth and FDI led growth do not occur simultaneously (Alıcı and Ucal 2003, Cuadros, Orts, and Alguacil 2004, Istaiteyeh and Ismail 2015) or the heterogeneity among variables of trade, FDI and growth in the short run and long-term using time series analysis (Belloumi 2014, Dritsaki and Stiakakis 2014, Goh, Sam, and McNown 2017) In Vietnam, the research results are not identical. Le (2002) examines the FDIgrowth nexus for the period of 1986-2002, showing a significantly positive impact 5
of FDI on the growth. By contrast, Nguyen et al. (2006) argue that the technological gap and the lack of linkage between local and foreign companies hinder the FDI spillovers; Vu (2008) investigates the indirect effects of FDI in 11 economic sectors from 1988 to 2002 on economic growth, showing the contradictory distribution to economic growth, for example, FDI inflows to construction and transportation have a negative impact on growth, while FDI inflows to industry and real estates have a positive one. Anwar and Nguyen (2010) indicate the negative indirect effects of FDI on growth through the development level of financial markets and the expenditure on education. Furthermore, in only four of seven areas in their sample there exists a relationship between FDI and economic growth. Pham and Nguyen (2013) also confirm this relationship over the period from 1991 to 2012. These studies have not considered the trade openness variable in the empirical models to evaluate the simultaneous effect of FDI on growth, although De Mello Jr (1997) notes the trade openness of host countries is an important factor in attracting FDI and Nguyen et al. (2006) mentions the possibility of attracting FDI due to Vietnam's trade policy expansion. In terms of cross section estimation, if the instrument variables are not good enough, the cross section method does not show the way of impact between FDI and economic growth (Nair‐Reichert and Weinhold 2001). Regarding time series analysis, Pham and Nguyen (2013) analyze long run and short run correlations between FDI and economic; however, the authors have not checked the robustness or the functional form in long run. Furthermore, the shortness of data in the context of chosen lag length (p=2) raises the degree of freedom of the model, which might lead to deviation. 4. Data source and econometric methodology In this paper, the empirical model is derived from the model of Liu, Shu, and Sinclair (2009) about the effect of FDI on economic growth in the context of trade openness: EG = f (FDI, EX, IM), where EG, FDI, EX, IM are economic growth, FDI, export and import respectively. In this model, economic growth is measured by the real GDP growth rate (constant price in 2010 US dollars), FDI is measured by the ratio of net inflow FDI to GDP (Nair‐Reichert and Weinhold 2001, Alfaro et al. 2004, Herzer and Klasen 2008); and Exports and imports are measured by the 6
ratio of exports and imports to GDP respectively. These series are obtained from World Bank Development Indicators database for the case of Vietnam over the period 1986-2015. Data description is shown in Table 1 This paper uses Auto Regressive Distributed Lag (ARDL) cointegration technique, developed by Pesaran, Shin, and Smith (2001) in order to examine the long run relationship between variables. This method is appropriate for I(0) and/or I(1) and it is effective for small sample size. Furthermore, long run estimation has not deviated if variables encounter the endogenous problem. Finally, the error correction model could be drawn from the long run equation without losing long-term information (Pesaran and Shin 1998, Narayan 2005, Belloumi 2014, Ahmad and Du 2017) 5. Empirical results 5.1 Unit root analysis If series are stationary, the mean, variance and auto-covariance will be timeinvariant and the regression results are meaningful. By contrast, if non-stationary series are conducted, the results face up to the spurious phenomenon (Gujarati and Porter 2009, p.741-748). This paper uses Augmented Dickey Fuller (ADF) (Dickey and Fuller 1979) to check unit root with the equation as followed: ∆Yt = ɑ1 + ɑ2t + ɑ3Yt-1 + ∑𝑚 𝑖=1 𝛽𝑖 ∆𝑌𝑡−𝑖 + εt
(1)
where ∆Yt are the series of GDP, FDI, export and import and ɛt is the white nose. The null hypothesis: H0: ɑ3 = 0 and the alternative H1: ɑ3 < 0 In order to determine H0/H1, tau statistic (τ) is applied. If |𝜏| > |𝜏𝛼 | where 𝜏𝛼 is the critical tau values of DF, the null hypothesis is rejected (Gujarati and Porter 2009, p.756) Another approach is Phillips Peron (PP) (Phillips and Perron 1988). The lagged difference term in ADF equation is eliminated ∆Yt = ɑ1 + ɑ2t + ɑ3Yt-1 + ɛt
(2)
Table 2 shows LNGDP, LNEX and LNIM are stationary at I(1) while LNFDI is stationary at I(0). Both ADF and PP tests show the same results. Hence, ARDL
7
model is the most valuable approach to test the variables which are mixed of stationary ones 5.2 ARDL bound tests for cointegration After testing the stationary of the three variables, this paper uses ARDL to find cointegration for the long run relationship among them. The ARDL model used in this study is shown by following equations: ∆LNGDPt = a10 + ß11LNGDPt-1 + 12LNFDIt-1 + ρ13LNEXt-1 + λ14LNIMt-1 + ∑𝑝𝑖=1 𝜃1𝑖 ∆𝐿𝑁𝐺𝐷𝑃𝑡−𝑖
∑𝑞𝑖=1 𝜗1𝑖 ∆𝐿𝑁𝐹𝐷𝐼𝑡−𝑖
+
∑𝑘𝑖=1 𝜑1𝑖 ∆𝐿𝑁𝐸𝑋𝑡−𝑖
+
∑𝑠𝑖=1 𝜔1𝑖 ∆𝐿𝑁𝐼𝑀𝑡−𝑖 + ɛ1t
+ (3)
∆LNFDIt = a20 + ß21LNGDPt-1 + 22LNFDIt-1 + ρ23LNEXt-1 + λ24LNIMt-1
+
∑𝑞𝑖=1 𝜃2𝑖 ∆𝐿𝑁𝐺𝐷𝑃𝑡−𝑖
+
∑𝑝𝑖=1 𝜗2𝑖 ∆𝐿𝑁𝐹𝐷𝐼𝑡−𝑖
+
∑𝑘𝑖=1 𝜑2𝑖 ∆𝐿𝑁𝐸𝑋𝑡−𝑖
+
∑𝑠𝑖=1 𝜔2𝑖 ∆𝐿𝑁𝐼𝑀𝑡−𝑖 + ɛ2t
(4)
∆LNEXt = a30 + ß31LNGDPt-1 + 32LNFDIt-1 + ρ33LNEXt-1 + λ34LNIMt-1 ∑𝑘𝑖=1 𝜃3𝑖 ∆𝐿𝑁𝐺𝐷𝑃𝑡−𝑖
+
∑𝑞𝑖=1 𝜗3𝑖 ∆𝐿𝑁𝐹𝐷𝐼𝑡−𝑖
+
+
∑𝑝𝑖=1 𝜑3𝑖 ∆𝐿𝑁𝐸𝑋𝑡−𝑖
∑𝑠𝑖=1 𝜔3𝑖 ∆𝐿𝑁𝐼𝑀𝑡−𝑖 + ɛ3t
+ (5)
∆LNIMt = a40 + ß41LNGDPt-1 + 42LNFDIt-1 + ρ43LNEXt-1 + λ44LNIMt-1 ∑𝑘𝑖=1 𝜃4𝑖 ∆𝐿𝑁𝐺𝐷𝑃𝑡−𝑖
+
∑𝑞𝑖=1 𝜗4𝑖 ∆𝐿𝑁𝐹𝐷𝐼𝑡−𝑖
+
∑𝑝𝑖=1 𝜔4𝑖 ∆𝐿𝑁𝐼𝑀𝑡−𝑖 + ɛ4t
+
∑𝑠𝑖=1 𝜑4𝑖 ∆𝐿𝑁𝐸𝑋𝑡−𝑖
+ (6)
Where ∆LNGDPt, ∆LNFDIt, ∆LNEXt and ∆LNIMt are the changes in the natural logarithm of the variables included economic growth, foreign direct investment, export and import in these equations and ɛit are the error terms. The null hypothesis of no-cointegration among these variables in equations (3), (4) and (5) is: H0: ß1i = 1i = ρ1i = λ1i 0 (no-cointegration) for i = 1, 2, 3 against the alternative one: H1: ß1i ≠ 1i ≠ ρ1i ≠ λ1i ≠ 0. The H0 is rejected if F-statistic of Wald test is greater than the upper critical values of the ARDL bounds testing at 10, 5 or 1 percent levels of significance. In contrast, if F-statistic is lower than the lower critical value, the null hypothesis is not rejected. The upper and the lower critical values, developed by (Pesaran, Shin, and Smith 2001), are based on the assumption that all variables in ARDL model are integrated of order one and order zero 8
respectively. In this paper, however, the critical values to the bound test follow the modified model of (Narayan 2005) because of small sample sizes (T=30). The choice of maximum lags is based on Akaike information criteria (AIC) through a vector autoregressive constructed among these variables with data span 2 (Belloumi 2014, Kalai and Zghidi 2017, Ahmad and Du 2017). The optimal lag length is 2 as reported in Table 3 Then, the optimal ARDL(p,q,k,s) in each equation (3), (4), (5), (6) are chosen respectively by Akaike information criteria (AIC) through (p+1) n regressions where p is the maximum number of lags and n is the number of variables (Ahmad and Du 2017) The Table 4 reported that when LNGDP is a dependent variable, the F-statistic (4.69) is higher than Upper bound at 10% level of significance while neither do other variables have cointegration. This means there is at least cointegration among variables in case of Vietnam from 1986 to 2015. 5.3 Long run elasticity and short run dynamic parameters When cointegration is shown up, the ARDL (p,q,k,s) long run model is selected by using AIC for dependent variable LNGDP derived from (3) could be formed as: 𝑝 𝑞 LNGDPt = a0 + ∑𝑖=1 𝑎1𝑖 𝐿𝑁𝐺𝐷𝑃𝑡−𝑖 + ∑𝑖=0 𝑎2𝑖 𝐿𝑁𝐹𝐷𝐼𝑡−𝑖 + ∑𝑘𝑖=0 𝑎3𝑖 𝐿𝑁𝐸𝑋𝑡−𝑖 +
∑𝑠𝑖=0 𝑎4𝑖 𝐿𝑁𝐼𝑀𝑡−𝑖 + ɛt
(7)
Where all variables defined previously. The regression of (7) using ARDL (2,2,0,1) specification is obtained by LNGDP in the long run as reported in Table 5. FDI coefficient is significantly positive. It shows that an increase of 1% in FDI will raise EG by 0.19%. This induces the important impact of FDI on economic growth in case of Vietnam for 1986-2015. This finding is also in line with the finding in Vu (2008), Anwar and Nguyen (2010). Export has the positive impact as expected while import has the negative impact on economic growth; however, neither coefficient of export nor import is significant. These results imply that the impact of trade openness is ambiguous in the case of Vietnam. 9
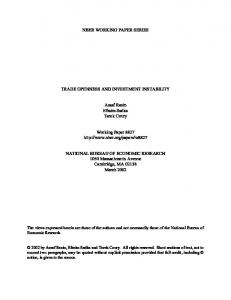
In the short run, Table 6, FDI and import have the significantly positive contribution to the economic growth of Vietnam. It is interesting that in the short run, import has the positive impact but in the long run, this trend turns to be negative. Moreover, the error correction term is negative and significant at 5% level of significance with the coefficient -0.79 as expected. It also reaffirms the existence of a cointegrating relationship based on the ARDL model chosen before and the speed of adjustment from short run to long run equilibrium is 79%. In other words, the system takes one and half year to restore the long-run equilibrium state in case of short-run shock. 5.4 Robustness analysis 5.4.1 Diagnostic and stability tests Long run cointegration between variables in the ARDL bound approach is based on ordinary least squares (OLS) estimations. Thus, in order to check the stability of the model chosen, this paper uses residual diagnostics and stability diagnostics. They include Jarque-Bera (JB) test for residual normality; Breusch-Godfrey serial correlation LM test for autocorrelation of order 2; Breusch-Pagan-Godfrey for heteroskedasticity test; and the Ramsey reset test for the functional form of the chosen model. Furthermore, the cumulative sum (CUSUM) and the cumulative sum of squares (CUSUMsq) suggested by Brown, Durbin, and Evans (1975) also strengthen the stability of the coefficients. If the plots of the CUSUM and CUSUMsq are steady between two boundaries lines of 5% level significance, they indicate long run parameter of ARDL model stability (Belloumi 2014, Murthy and Okunade 2016, Sunde 2017, Ahmad and Du 2017) Table 7 shows these tests in order to confirm the perfectness of model chosen. For instance, JB test assures the residual has the normal distribution and there are no serial correlation, no-heteroskedasticity and functional form of the model. Furthermore, the plots of CUSUM and CUSUMsq in Figure 1 and Figure 2 imply all coefficients in the model are stable. 5.4.2 Fully modified OLS and Dynamic OLS 10
Long run coefficients could also be tested for robustness by Dynamic OLS (DOLS) and fully modified OLS (FMOLS) as confirming the ARDL model. These methods are suitable for small sample size because of unbiased estimations (Arize, Ume, and Nkwor 2017, Ali, Abdullah, and Azam 2017, Ahmad and Du 2017) Table 8 shows that the DOLS and FMOLS results are in line with ARDL-OLS result in terms of the significant impact from FDI on economic growth either ambiguous contributions of export and import to economic growth. Hence, these results confirm the initial ARDL chosen before. 5.4.3 Impulse response and Variance decomposition ARDL model shows the cointegration among variables but it does not tell how much a variable reacts to positive shocks in another variable in the short and long run. Furthermore, it only shows the cointegration within the chosen sample, so it does not assure the causal relationship of variables established out of sample period. Hence, this paper uses impulse response and variance decomposition to test the sensitive reaction among variables. Naka and Tufte (1997) and Payne (2002) suggested impulse response functions and variance decomposition respectively in VAR system rather than other methods. Therefore, unrestricted VAR is utilized for two ones. In order to check the response of one variable to another variable, Cholesky dof adjusted impulse applied to test the reaction of LNGDP in the change of one standard deviation of others in short run to long run. The response of LNGDP to LNGDP shocks reveals that LNGDP declines dramatically, reaches zero after around period 3 and continues to turn negative before becoming positive, in the end, it lies on the time horizon. The response of LNGDP to LNFDI shocks shows that it starts from zero and sees a positive trend afterwards; in long run, it is asymptotic to time horizon. The same pattern for the response of LNGDP to LNEX shocks accepts that in short run (year of 1-2) there exists a negative response. By contrast, the response of LNGDP to LNIM shocks always shows negative trends in short and long run.
11
Regarding variance decomposition, results show that from 1-5 years in the short run, GDP is explained by itself declining from 97% to 74% while the forecast variance errors of FDI, export and import explain the economic growth of about 7.7%, 8.4% and 9.3% respectively. In the long run, GDP is still the largest proportion of forecast variance error itself, at around 60%. It is notable that the FDI amplifies contribution of economic growth explaining, approximately 16% while export fluctuates between 8% and 7%. Import has the same pattern of FDI, which explain 16% of economic growth Overall, these results by impulse response functions and variance decomposition are consistent to ARDL model, especially the trend of the impact of variables on economic growth. 6. Conclusion This paper examines the dynamic relationship among variables of economic growth, FDI and trade openness in Vietnam for the period of 1986-2015. The period is chosen because of data availability and because, furthermore, in 1986, Vietnam began Doi Moi reform which opened the local economy for international trade. The ARDL technique is employed to check the linkages among these variables and Fstatistic shows the existence of the long run relationship among these ones when GDP is the dependent variable. FDI strongly promotes economic growth in long and short run. Export has the positive impact on economic growth while import has negative one; however, both of them are insignificant. Thus, this empirical result confirms FDI led growth but fail to confirm trade openness led growth in the case of Vietnam. Error correction term coefficient is -0.79, which induces the system takes about one and half year to restore the long run stability in case of short run shock. Diagnostic and stability tests are performed in order to confirm the perfectness of ARDL model. DOLS and FMOLS are also used to check the robustness of chosen ARDL and the results from these methods are consistent with ARDL results in terms of trend and significant impact. Finally, impulse response functions and variance decomposition reaffirm that FDI has the positive impact in short and long run and reaches stable trend of economic growth explaining in long run. 12
Table 1. Summary statistics of variables
Mean Median Maximum Minimum Std. Dev. Jarque-Bera Probability Observations
GDP 6.516968 6.372030 9.540480 2.789292 1.569330 0.046535 0.977001 30
FDI 5.085804 4.931698 11.93980 0.000152 3.017006 0.209715 0.900453 30
EXPORT 50.06149 50.27278 89.77925 3.945298 23.78005 0.806071 0.668288 30
IMPORT 56.58657 53.04967 88.98817 14.79718 21.66517 1.258110 0.533095 30
Source: Author’s calculation using Eviews 9 Table 2. Unit roots test Variables
Model
Augmented Dickey Fuller Test (ADF) Level
LNFDI
LNGDP
LNEX
LNIM
1st Difference
Phillips-Perron Test (PP)
Level
Decision
1st Difference
Intercept -7.719***
-7.615***
-9.939***
-7.341***
Trend
-6.329***
-7.848***
-7.881***
-7.588***
None
-4.581***
-7.615***
-3.865***
-7.348***
Intercept -3.836***
-4.861***
3.818***
-4.861***
Trend
-3.835**
-4.911***
-3.798**
-4.903***
None
0.364
-4.898***
0.36
-4.898***
Intercept -2.96*
-5.61***
-3.12*
-5.69***
Trend
-2.75
-5.82***
-2.74
-6.58***
None
0.92
-4.17***
1.18
-5.31***
Intercept -2.16
-4.95***
-3.15*
-4.97***
Trend
-2.63
-5.25***
-2.97
-5.72***
None
1.45
-4.51***
1.93
-4.51***
I(0)
I(1)
I(1)
I(1)
*, **, *** indicate respectively 10%, 5% and 1% level of significance Source: Author’s calculation using Eviews 9
13
Table 3. VAR lag order by the selection criteria Lag
LogL
0 1 2
-25.51245 45.20036 84.98455
LR
FPE
AIC
SC
HQ
NA 9.68e-05 2.108032 2.298347 2.166213 116.1710 1.97e-06 -1.800026 -0.848451 -1.509120 53.99283* 3.90e-07* -3.498896* -1.786062* -2.975266*
* indicates lag order selected by the criterion LR: sequential modified LR test statistic (each test at 5% level), FPE: Final prediction error, AIC: Akaike information criterion, SC: Schwarz information criterion, HQ: Hannan-Quinn information criterion Source: Author’s calculation using Eviews 9 Table 4. ARDL bounds testing for cointegration Variables
Optimal ARDL F-statistic
Cointegration
model (LNGDP/LNFDI,LNEX,LNIM) (2/2,0,1)
4.69*
Yes
(LNFDI/LNGDP,LNEX,LNIM) (2/0,2,1)
0.82
No
(LNEX/LNGDP,LNFDI,LNIM) (1/1,2,2)
2.92
No
(LNIM/LNGDP,LNFDI,LNEX) (1/0,2,2)
2.42
No
Significant level
Lower
Bound
(I0 Upper
bound)a
bound)b
10%
3.008
4.150
5%
3.710
5.018
1%
5.333
7.063
Bound
(I1
* indicates 10% level of significance based on ARDL bound testing. Optimal ARDL model based on AIC values a, b
The critical values are derived from case III: unrestricted intercept and no trend,
k=3 according to Narayan (2005) Source: Author’s calculation using Eviews 9
14
Table 5. Long run elasticity (LNGDP/LNFDI,LNEX,LNIM) Optimal ARDL model (2/2,0,1)
Variables
LNGDP LNFDI 0.19 [3.82]*** LNEX 0.12 [0.43] LNIM -0.42 [-1.16] Constant 2.80 [4.72]*** Note: [ ] indicates t-statistic and *** indicates 1% level of significance Source: Author’s calculation using Eviews 9 Table 6. Short-run error correction model (2/2,0,1) Coefficient D(LNGDP) D(LNGDP) (-1) 0.37 [2.08]** D(LNFDI) -0.01 [-0.27] D(LNFDI) (-1) 0.07 [1.44]* D(LNEX) 0.09 [0.44] D(LNEX) (-1) D(LNIM) 0.57 [1.55]* D(LNIM) (-1) ECT(-1) -0.79 [-4.02]*** Note: [ ] indicates t-statistic *, **, *** indicate 10%, 5% and 1% level of significance respectively Source: Author’s calculation using Eviews 9 Table 7. Diagnostic and stability tests Residual Diagnostics Jacque-Berra Correlation LM
F-Statistic 0.73 (0.69) 0.25 (0.77)
Heteroskedasticity test (BPG)
0.55 (0.80)
Stability Diagnostics F-Statistic (Prob) Ramsey reset 0.05 (0.82) CUSUM Portrayed by two lines** CUSUMsq Portrayed by two lines** Note: ( )indicates P-value ** indicates 5% level of significance. Source: Author’s calculation using Eviews 9 15
Table 8. Fully modified OLS and Dynamic OLS Variables DOLS FMOLS LNFDI 0.1038 [3.71]*** 0.1372 [3.75]*** LNEX 0.001 [0.005] -0.016 [-0.065] LNIM -0.178 [-0.424] -0.288 [-0.806] Note: [ ] indicates t-statistic *** indicates 1% level of significance Source: Author’s calculation using Eviews 9 Table 9. Variance decomposition Variable
Period 1 5 LNGDP 10 15 20 1 5 LNFDI 10 15 20 1 5 LNEX 10 15 20 1 5 LNIM 10 15 20
LNGDP 100.0000 74.43758 68.21058 63.43388 59.93299 6.231944 19.1942 18.32255 17.60684 17.03599 11.67999 12.8608 10.03717 8.557274 7.563889 16.52843 11.45493 7.69388 6.049645 5.093949
LNFDI 0.000000 7.737658 11.53798 14.07757 15.90312 93.76806 61.49831 60.68229 60.21028 59.80365 15.34193 20.35459 25.95453 28.96423 31.05853 27.90737 26.84424 33.21435 36.08598 37.81609
LNEX 0.000000 8.478147 7.889018 7.539548 7.243410 0 15.50184 15.66862 15.14561 14.73239 72.97808 39.59007 31.15021 26.80281 23.94154 12.41637 9.67247 7.090844 6.003172 5.397411
LNIM 0.000000 9.346612 12.36242 14.94900 16.92048 0 3.805654 5.32655 7.03727 8.427971 0 27.19454 32.85808 35.67568 37.43605 43.14783 52.02836 52.00092 51.86121 51.69255
Source: Author’s calculation using Eviews 9
16
15
10
5
0
-5
-10
-15 1998
2000
2002
2004
2006
CUSUM
2008
2010
2012
2014
5% Significance
Figure 1. Cumulative sum of recursive residuals (CUSUM) 1.6
1.2
0.8
0.4
0.0
-0.4 1998
2000
2002
2004
2006
CUSUM of Squares
2008
2010
2012
2014
5% Significance
Figure 2. Cumulative sum of squares recursive residuals (CUSUMsq)
17
Response to Cholesky One S.D. Innovations ± 2 S.E. Response of LNGDP to LNGDP .2
.1
.0
-.1
Response to 2Cholesky Innovations 4 6 8One 10 S.D. 12 14 16 18 20 ± 2 S.E. Response of LNGDP to LNFDI .2
.1
.0
-.1 Response to2 Cholesky One S.D. Innovations ± 2 S.E. 4 6 8 10 12 14 16 18 20
Response of LNGDP to LNEX .2
.1
.0
-.1 2
4
6
8
10
12
14
16
18
20
18
Response to Cholesky One S.D. Innovations ± 2 S.E. Response of LNGDP to LNIM .2
.1
.0
-.1 2
4
6
8
10
12
14
16
18
20
Figure 3. Cholesky one standard deviation impulse response REFERENCES
Ahmad, Najid, and Liangsheng Du. 2017. "Effects of energy production and CO 2 emissions on economic growth in Iran: ARDL approach." Energy 123:521-537. Aitken, Brian, Gordon H Hanson, and Ann E Harrison. 1997. "Spillovers, foreign investment, and export behavior." Journal of International economics 43 (1):103-132. Aitken, Brian J, and Ann E Harrison. 1999. "Do domestic firms benefit from direct foreign investment? Evidence from Venezuela." American economic review:605-618. Alfaro, Laura, Areendam Chanda, Sebnem Kalemli-Ozcan, and Selin Sayek. 2004. "FDI and economic growth: the role of local financial markets." Journal of international economics 64 (1):89-112. Ali, Wajahat, Azrai Abdullah, and Muhammad Azam. 2017. "Re-visiting the environmental Kuznets curve hypothesis for Malaysia: fresh evidence from ARDL bounds testing approach." Renewable and Sustainable Energy Reviews 77:990-1000. Alıcı, Aslı Akgüç, and Meltem Şengün Ucal. 2003. "Foreign direct investment, exports and output growth of Turkey: Causality analysis." European Trade Study Group (ETSG) fifth annual conference, Madrid. Anwar, Sajid, and Lan Phi Nguyen. 2010. "Foreign direct investment and economic growth in Vietnam." Asia Pacific Business Review 16 (1-2):183-202. Arize, Augustine, Kalu Ebere Ume, and Nelson N Nkwor. 2017. "Banks versus Markets: Do They Compete, Complement or Co-evolve in the Nigerian Financial System? An ARDL Approach." Research in International Business and Finance. doi: http://dx.doi.org/10.1016/j.ribaf.2017.07.174. Balasubramanyam, Venkataraman N, Mohammed Salisu, and David Sapsford. 1996. "Foreign direct investment and growth in EP and IS countries." The economic journal:92-105. Barro, Robert J, and Xavier Sala-i-Martin. 1997. "Technological diffusion, convergence, and growth." Journal of Economic Growth 2 (1):1-26. Belloumi, Mounir. 2014. "The relationship between trade, FDI and economic growth in Tunisia: An application of the autoregressive distributed lag model." Economic Systems 38 (2):269-287. Bende-Nabende, and JL Ford. 1998. "FDI, policy adjustment and endogenous growth: Multiplier effects from a small dynamic model for Taiwan, 1959–1995." World development 26 (7):1315-1330. Bende-Nabende, A, JL Ford, B Santoso, and S Sen. 2003. "The interaction between FDI, output and the spillover variables: co-integration and VAR analyses for APEC, 1965-1999." Applied Economics Letters 10 (3):165-172. Bengoa, Marta, and Blanca Sanchez-Robles. 2003. "Foreign direct investment, economic freedom and growth: new evidence from Latin America." European journal of political economy 19 (3):529-545. Benhabib, Jess, and Mark M Spiegel. 1994. "The role of human capital in economic development evidence from aggregate cross-country data." Journal of Monetary economics 34 (2):143-173. Bhagwati, Jagdish N. 1978. "Anatomy of Exchange Control Regimes." In Anatomy and Consequences of Exchange Control Regimes, 7-52. NBER. Borensztein, Eduardo, Jose De Gregorio, and Jong-Wha Lee. 1998. "How does foreign direct investment affect economic growth?" Journal of international Economics 45 (1):115-135.
19
Brown, Robert L, James Durbin, and James M Evans. 1975. "Techniques for testing the constancy of regression relationships over time." Journal of the Royal Statistical Society. Series B (Methodological):149-192. Coe, David T, Elhanan Helpman, and Alexander Hoffmaister. 1995. North-south R&D spillovers. National Bureau of Economic Research. Cuadros, Ana, Vicente Orts, and Maite Alguacil. 2004. "Openness and growth: Re-examining foreign direct investment, trade and output linkages in Latin America." Journal of Development Studies 40 (4):167-192. Chang, Shu-Chen. 2005. "The dynamic interactions among foreign direct investment, economic growth, exports and unemployment: evidence from Taiwan." Economic Change and Restructuring 38 (34):235-256. De Mello Jr, Luiz R. 1997. "Foreign direct investment in developing countries and growth: A selective survey." The Journal of Development Studies 34 (1):1-34. De Mello, Luiz R. 1999. "Foreign direct investment-led growth: evidence from time series and panel data." Oxford economic papers 51 (1):133-151. Dickey, David A, and Wayne A Fuller. 1979. "Distribution of the estimators for autoregressive time series with a unit root." Journal of the American statistical association 74 (366a):427-431. Dritsaki, Chaido, and Emmanouil Stiakakis. 2014. "Foreign direct investments, exports, and economic growth in Croatia: A time series analysis." Procedia Economics and Finance 14:181-190. Frankel, Jeffrey A, and David Romer. 1999. "Does trade cause growth?" American economic review:379399. Freeman, Nick J. 2002. "Foreign direct investment in Vietnam: an overview." United Kingdom Department for International Development workshop on globalization and poverty in Viet Nam. Glass, Amy Jocelyn, and Kamal Saggi. 2002. "Multinational firms and technology transfer." The Scandinavian Journal of Economics 104 (4):495-513. Goh, Soo Khoon, Chung Yan Sam, and Robert McNown. 2017. "Re-examining Foreign Direct Investment, Exports, and Economic Growth in Asian Economies Using a Bootstrap ARDL Test for Cointegration." Journal of Asian Economics. Goldberg, Linda S, and Michael W Klein. 1999. International trade and factor mobility: an empirical investigation. National bureau of economic research. Görg, Holger, and David Greenaway. 2004. "Much ado about nothing? Do domestic firms really benefit from foreign direct investment?" The World Bank Research Observer 19 (2):171-197. GSO. 1996. Statistical Yearbook of Vietnam. Ha Noi: Statistical publishing house. GSO. 2005. Statistical Yearbook of Vietnam. Ha Noi: Statistical publishing house. GSO. 2010. Statistical Yearbook of Vietnam. Ha Noi: Statistical publishing house. GSO. 2015. Statistical Yearbook of Vietnam. Ha Noi: Statistical publishing house. Gujarati, Damodar N, and D Porter. 2009. "Basic Econometrics Mc Graw-Hill International Edition." Günther, Jutta. 2002. "FDI as a multiplier of modern technology in Hungarian industry." Intereconomics 37 (5):263-269. Herzer, Dierk. 2012. "How does foreign direct investment really affect developing countries' growth?" Review of International Economics 20 (2):396-414. Herzer, Dierk, and Stephan Klasen. 2008. "In search of FDI-led growth in developing countries: The way forward." Economic Modelling 25 (5):793-810. Hsiao, Frank ST, and Mei-Chu W Hsiao. 2006. "FDI, exports, and GDP in East and Southeast Asia—Panel data versus time-series causality analyses." Journal of Asian Economics 17 (6):1082-1106. Iamsiraroj, Sasi, and Mehmet Ali Ulubaşoğlu. 2015. "Foreign direct investment and economic growth: A real relationship or wishful thinking?" Economic Modelling 51:200-213. Iqbal, Muhammad Shahzad, Faiz Muhammad Shaikh, and Amir Hussain Shar. 2010. "Causality relationship between foreign direct investment, trade and economic growth in Pakistan." Asian Social Science 6 (9):82. Istaiteyeh, Rasha MS, and Mohd Tahir Ismail. 2015. "A causal relationship between foreign direct investment, economic growth and export: empirical case for Jordan." Advances in Management and Applied Economics 5 (4):19. JETRO. 2016. 2016 JETRO Survey on business conditions of Japanese Companies in Asia and Oceania. Tokyo: Japan External Trade Organization. Kalai, Maha, and Nahed Zghidi. 2017. "Foreign Direct Investment, Trade, and Economic Growth in MENA Countries: Empirical Analysis Using ARDL Bounds Testing Approach." Journal of the Knowledge Economy:1-25.
20
Keller, Wolfgang, and Stephen R Yeaple. 2003. Multinational enterprises, international trade, and productivity growth: firm-level evidence from the United States. National Bureau of Economic Research. Kohpaiboon, Archanun. 2003. "Foreign trade regimes and the FDI–growth nexus: A case study of Thailand." The Journal of Development Studies 40 (2):55-69. Le, Viet Anh. 2002. FDI-Growth Nexus in Viet Nam. Mimeo. Lipsey, Robert E, and Fredrik Sjöholm. 2005. "The impact of inward FDI on host countries: why such different answers?" Does foreign direct investment promote development:23-43. Liu, Xiaohui, Peter Burridge, and Paul JN Sinclair. 2002. "Relationships between economic growth, foreign direct investment and trade: evidence from China." Applied economics 34 (11):1433-1440. Liu, Xiaohui, Chang Shu, and Peter Sinclair. 2009. "Trade, foreign direct investment and economic growth in Asian economies." Applied Economics 41 (13):1603-1612. Makki, Shiva S, and Agapi Somwaru. 2004. "Impact of foreign direct investment and trade on economic growth: Evidence from developing countries." American Journal of Agricultural Economics 86 (3):795-801. Murthy, Vasudeva NR, and Albert A Okunade. 2016. "Determinants of US health expenditure: Evidence from autoregressive distributed lag (ARDL) approach to cointegration." Economic Modelling 59:67-73. Nair‐Reichert, Usha, and Diana Weinhold. 2001. "Causality tests for cross‐country panels: a New look at FDI and economic growth in developing countries." Oxford bulletin of economics and statistics 63 (2):153-171. Naka, Atsuyuki, and David Tufte. 1997. "Examining impulse response functions in cointegrated systems." Applied economics 29 (12):1593-1603. Narayan, Paresh Kumar. 2005. "The saving and investment nexus for China: evidence from cointegration tests." Applied economics 37 (17):1979-1990. Nguyen, Thi Tue Anh, Xuan Nguyet Hong Vu, Toan Thang Tran, and Manh Hai Nguyen. 2006. The impacts of foreign direct investment on the economic growth in Viet Nam. Ha Noi: Central Institute for Economic Management. Payne, James E. 2002. "Inflationary dynamics of a transition economy: the Croatian experience." Journal of Policy Modeling 24 (3):219-230. Pesaran, M Hashem, and Yongcheol Shin. 1998. "An autoregressive distributed-lag modelling approach to cointegration analysis." Econometric Society Monographs 31:371-413. Pesaran, M Hashem, Yongcheol Shin, and Richard J Smith. 2001. "Bounds testing approaches to the analysis of level relationships." Journal of applied econometrics 16 (3):289-326. Pham, The Anh, and Thi Hong Dao Nguyen. 2013. "Bounds Testing Approach to Cointegration: A Reexamination of FDI and Growth in Vietnam." Journal of Economics and Development 218:94-113. Phillips, Peter CB, and Pierre Perron. 1988. "Testing for a unit root in time series regression." Biometrika 75 (2):335-346. Sami, Janesh, and Fuad Kreishan. 2012. "Fdi and export-led growth in jordan: evidence from cointegration and causality test." Economics Bulletin 32 (2):1-18. Sunde, Tafirenyika. 2017. "Foreign direct investment, exports and economic growth: ADRL and causality analysis for South Africa." Research in International Business and Finance 41:434-444. Szkorupová, Zuzana. 2014. "A causal relationship between foreign direct investment, economic growth and export for Slovakia." Procedia economics and finance 15:123-128. UNCTAD. 1999. World Report Investment: Foreign direct investment and the challenge of development. Switzerland: United Nations. Vu, Tam Bang. 2008. "Foreign direct investment and endogenous growth in Vietnam." Applied Economics 40 (9):1165-1173. Wang, Jian-Ye. 1990. "Growth, technology transfer, and the long-run theory of international capital movements." Journal of International Economics 29 (3-4):255-271. Wang, Jian-Ye, and Magnus Blomström. 1992. "Foreign investment and technology transfer: A simple model." European economic review 36 (1):137-155. WorldBank. 2016a. Trade (% of GDP). edited by World Development Indicators. WorldBank. 2016b. Foreign direct investment, net inflows (% of GDP). edited by World Development Indicators. Xuan, Nguyen Thanh, and Yuqing Xing. 2008. "Foreign direct investment and exports The experiences of Vietnam." Economics of transition 16 (2):183-197. Yao, Shujie. 2006. "On economic growth, FDI and exports in China." Applied Economics 38 (3):339-351. Zhang, Kevin Honglin. 2001. "Does foreign direct investment promote economic growth? Evidence from East Asia and Latin America." Contemporary economic policy 19 (2):175-185.
21
Zhao, Changwen, and Jiang Du. 2007. "Causality between FDI and economic growth in China." Chinese economy 40 (6):68-82.
22