Home
Search
Collections
Journals
About
Contact us
My IOPscience
Forest Classification Based on Forest texture in Northwest Yunnan Province
This content has been downloaded from IOPscience. Please scroll down to see the full text. 2014 IOP Conf. Ser.: Earth Environ. Sci. 17 012071 (http://iopscience.iop.org/1755-1315/17/1/012071) View the table of contents for this issue, or go to the journal homepage for more
Download details: IP Address: 69.13.95.149 This content was downloaded on 02/04/2016 at 09:54
Please note that terms and conditions apply.
35th International Symposium on Remote Sensing of Environment (ISRSE35) IOP Publishing IOP Conf. Series: Earth and Environmental Science 17 (2014) 012071 doi:10.1088/1755-1315/17/1/012071
Forest Classification Based on Forest texture in Northwest Yunnan Province Jinliang Wang1, 3, Yan Gao1 , Xiaohua Wang2 , Lei Fu1 1
College of Tourism & Geographical Science, Yunnan Normal University, Chenggong, Kunming, 650500, China 2
Urban Planning Bureau of Liangping County, Liangping, Chongqing Municipality, 405200, China E-mail:
[email protected],
[email protected],
[email protected],
[email protected] Abstract: Forest texture is an intrinsic characteristic and an important visual feature of a forest ecological system. Full utilization of forest texture will be a great help in increasing the accuracy of forest classification based on remote sensed data. Taking Shangri-La as a study area, forest classification has been based on the texture. The results show that: (1) From the texture abundance, texture boundary, entropy as well as visual interpretation, the combination of Grayscale-gradient co-occurrence matrix and wavelet transformation is much better than either one of both ways of forest texture information extraction; (2) During the forest texture information extraction, the size of the texture-suitable window determined by the semi-variogram method depends on the forest type (evergreen broadleaf forest is 3 ×3, deciduous broadleaf forest is 5×5, etc.). (3)While classifying forest based on forest texture information, the texture factor assembly differs among forests: Variance Heterogeneity and Correlation should be selected when the window is between 3×3 and 5×5; Mean, Correlation, and Entropy should be used when the window in the range of 7×7 to 19×19; and Correlation, Second Moment, and Variance should be used when the range is larger than 21×21.
1. Introduction Forests are the largest carbon sink of the terrestrial ecosystem, and their capacity for carbon sequestration composes approximately two-thirds that of the entire terrestrial ecosystems. They play an irreplaceable role in the regulation of the global carbon balance, mitigation of the increase in concentration of greenhouse gases such as CO2, and the mitigation of global climate change. In order to accurately assess its function in the global carbon balance, scientists are widely concerned with accurately estimating forest biomass and forest biomass changes on global or regional scales[1] and this measurement has become the focus of carbon cycle research[2]. 3
College of Tourism & Geographical Science, Yunnan Normal University, Chenggong, Kunming, 650500, China.
Content from this work may be used under the terms of the Creative Commons Attribution 3.0 licence. Any further distribution of this work must maintain attribution to the author(s) and the title of the work, journal citation and DOI. Published under licence by IOP Publishing Ltd 1
35th International Symposium on Remote Sensing of Environment (ISRSE35) IOP Publishing IOP Conf. Series: Earth and Environmental Science 17 (2014) 012071 doi:10.1088/1755-1315/17/1/012071
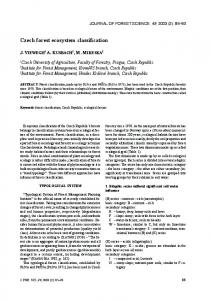
Forest area and volume are the basic and most important elements of forest biomass and forest change monitoring[3]. With the development of technology on remote sensed data processing, analysis and management, as well as the mining of different spatial resolution remote sensing information sources, the forest resources monitoring method based on the "3S" technique has become the main means of forest resources monitoring[4]. However, due to the limitations of the remote sensed data classification strategy and methods, it still has not been found to be an ideal technology for the recognition and extraction of forest type or species[5]. There is a need to further develop forest type classification research based on remote sensing technology in order to greatly shorten research time, reduce labor intensity, improve production quality, and reduce investigation costs. Many domestic and foreign scholars dedicated to developing new classification methods have achieved some impressive results with forest classification that based on texture[6-15]。However, these research areas and objects have their specific features, and more representative regional case studies are needed. Though more and more researchers are using multi-source remote sensing data, and the use of texture features are studied, research based on the remote sensing image feature extraction such as texture information and segmentation research is far from sufficient and do not meet actual needs (due to the fact that regional choice is too small, etc.). Shangri-La County is located in the northwest of Yunnan Province and belongs to the upper reaches of the Jinsha River. It is one of the most important forest areas in Yunnan Province. In recent years, the development of “Natural Forest Protection Projects”, efforts to “Return land from farming to forestry”, and activities such as eco-tourism have lead to significant changes in the forests. There thus is a need for in-depth studies of forest change monitoring. 2. Study area Shangri-La County is located on the southeast edge of Qinghai-Tibet Plateau mountain range, between latitude 26 °52'-28 °52 ', longitude 99 °22 '-100 °19'. It is part of the Three Parallel Rivers area and is administratively attached to Diqing Tibetan Autonomous Prefecture. The terrain of Shangri-La is higher at the north end and drops gradually in south; with the highest point at 5545m and the lowest point is 1503 m, the elevation difference is 4042 m. The county topography includes mountains, plateaus, basins, and valleys. The length of the border is 88km from east to west and 218km from north to south, so as to form a long and narrow zone shaped like the leaf of a willow tree (Figure 1) [16]. Because of its special geographic environment and complex ecological conditions, the forest resources of Shangri-La are characterized by large areas of forestry land, rich variety of tree species, a high volume of forest stock and conifer-dominant forest[17, 18]. Because of its special geographical location and geological conditions, soil types are abundant and their vertical distribution is clear. They also provide the basic conditions for the growth of vegetation. The study area is Figure 1. Location of study area located in the transition zone between the subtropical evergreen broad-leaved forest vegetation zone of Yunnan and the Qinghai-Tibet Plateau alpine vegetation zone. There is a wide variety of vegetation types that differ in vertical distribution and vegetation resources are rich. The forest coverage is 74.99%, the forest (pure and mixed forest) land is 755104.1 hm2, shrub land coverage is 14.89%, and four-sides(House side, village side , roadside and waterside) trees coverage is 0.03%[18-20].
2
35th International Symposium on Remote Sensing of Environment (ISRSE35) IOP Publishing IOP Conf. Series: Earth and Environmental Science 17 (2014) 012071 doi:10.1088/1755-1315/17/1/012071
3. Methodologies 3.1 Data Source and Technology Platform The remote sensed data sources are: TM images of Landsat_5 in 1989, ETM + images of Landsat_7 in 1999 and TM images of Landsat_5 in 2009. The tracking numbers are: 131/041, 132/040 and 132/041. The quality of all the images was good with no clouds, and they meet the research requirements. In addition, DEM and other documents in the study area were also collected. The data processing platforms are ENVI4.8 and ArcGIS9.3. We conducted a series of remote sensed image processing in ENVI4.8, and then achieved the classification results, statistics, and cartography of the remote sensing images forest landscape in ArcGIS 9.3. 3.2 Forest Classification system The division of forest landscape types should be based on forest plants and their community, in accordance with the landscape scale, landscape matrix, landscape structure, landscape features and other aspects[21]. At the same time, as the theme of forest landscape is forest vegetation communities, the division of forest landscape types should consider the division principle of the forest communities, that is, the community – ecological principle, as the classification basis of forest communities’ characteristics[22]. Then one should take the forest vegetation classification system of Diqing[23] as a reference to work out the forest landscape classification system of northern Shangri-La (Table 1). Table 1. Forest landscape classification system in northern Shangri-La County Types of landscape elements Cold Needle-leaf forest Temperate Needle-leaf forest Warm Needle-leaf forest Deciduous broad-leaved forest Evergreen Broad-leaf Forest(EBLF) Coniferous and broad-leaved mixed forest Non-forest Land(NFL)
Notes Dominated by the spruce-fir forest、Larch Forest Dominated by Alpine Pine Forest Dominated by the Yunnan Pine Forest Dominated by Birch Forest Dominated by Oak Forest Including Mixed Deciduous Evergreen Oak, Hard-broad Forest, dominated by Camphor Tree and Phoebe Nanmu and other Soft-broad Forest Including Roads, Rivers, Construction Sites, Wasteland, Grassland and a small amount of Bare Land.
3.3 Extraction texture information 3.3.1 Wavelet transformation. Since the 1990s, wavelet transformation analysis has been well-developed and widely used[24]. Wavelet transformation is generally regarded as the mathematical tools used in a multi-level decomposition function. Wavelet coefficients (characteristics of the original image signal and characterization of the images’ local features) and the image information we need are obtained by wavelet transformation processing. The reasoning behind our image processing was to transform the original image in spatial or temporary domain to the wavelet domain, select an appropriate algorithm according to the different needs to process wavelet coefficients, and then to inversely transform wavelet coefficients processed in order to obtain the target image needed[25]. 3.3.2 Gray level-gradient co-occurrence matrix. Gray level-gradient co-occurrence matrix (GGCM) is incorporates the image gradient features into the original gray level co-occurrence matrix, and thus it can clearly represent image texture and arrangement of texture[26]. GGCM reflects two basic types of information about the image, can clearly show distribution of pixel gray and gradient in the image, embodies the space relationship of each pixel and its neighboring pixels in the image, and can clearly describe the texture of the image [27]. Usually the application of texture information extraction is to
3
35th International Symposium on Remote Sensing of Environment (ISRSE35) IOP Publishing IOP Conf. Series: Earth and Environmental Science 17 (2014) 012071 doi:10.1088/1755-1315/17/1/012071
calculate a series 2-order statistical characteristic (such as entropy, energy, etc.) on the basis of GGCM construction. 4. Forest texture extraction 4.1 Wavelet extraction of forest texture Remote sensed images are two-dimensional images, but the texture structure of objects can be extracted using wavelet transformation. When forest classification is done using wavelet extraction of the image texture, it is first necessary to enter the average figure of the spectral signature of remote sensing images (Double format), convert the image to mat format, and select wavelet function as well as the number of decomposition levels, and then carry out wavelet transformation. Selection of wavelet basis:The wavelet transformation was applied to the TM image of 2009 in the study area, and when three wavelet basis functions—Daubeehies4, Daubeehies7, Daubeehies10—were used for image decomposition, the results obtained in the experiment were nearly the same. In terms of the retention of high frequency information, smoothness and blur effect of image, the best wavelet basis is Daubeehies4. Image hierarchical number: Select the N=2, 3, 4, 5.When N=2, the image of the two layer decomposition filter frequency effect is not good. When N=4, boundary information in the high-frequency area is fuzzy. The boundary effect is very severe when N=5. As the wavelet transformation time is proportional to the image size (N × N), wavelet transformation Daubeehies4 and N=3 were used in this study. Texture extraction of images: the image was divided into 9 sub-images by wavelet transformation of Daubeehies4 and N=3 (Figure 2). Nine sub-images were divided into three groups: the first group is E1, E2 and E3, the second group is E4, E5 and E6, and the third group is E7, E8 and E9. They are three-layer texture structure feature graphs that transformed by wavelet, which correspond to the texture Figure 2. Daubeehies4 wavelet Image structure in the vertical, diagonal, and horizontal directions of the forest texture map. 4.2 GGCM extraction of forest texture First of all, it is necessary to downgrade the image that is to be processed (texture image is extracted by wavelet transformation), construct the Sobel operator and the matrix algorithm, and then obtain the gradient map. The window operator was set to extract texture information in the gradient map, the value in each direction of pixels in the window was counted and finally normalized, and then entire image was traversed to get the center pixel value of window, that is, the mean in all directions of the window. Finally, the texture measure map we need for forest texture classification (incorporating energy, correlation, uniform, contrast, etc.) was generated. (1) Extraction of the gray level image. To convert the multi band M image (RGB image) to gray scale images, we sought the single band that represents RGB, and then chose one band to calculate
4
35th International Symposium on Remote Sensing of Environment (ISRSE35) IOP Publishing IOP Conf. Series: Earth and Environmental Science 17 (2014) 012071 doi:10.1088/1755-1315/17/1/012071
texture features. From this calculation, we can see that the standard deviation of the first band of TM image of 2099 is the biggest, so it was selected as the resource for texture information extraction. (2) Grey level quantification: Considering the amount and time of calculation in the experiment, it is necessary to compress the gray level without affecting the texture extraction, to treat the image with histogram equalization, and compress to 64 gray levels, in order to meet the requirements of GGCM extraction of forest texture. (3) Step setting:In this experiment, the step was D=1. (4) Determination of the direction: Usually, there are four directions (0°, 45°, 90°, 135°) that can be chosen. The different directions correspond to different kinds of texture features. Considering the rotation invariant of texture features, the averages of the four directions can be used to build the final eigenvalue co-occurrence matrix. (5) Generation of texture image: the practical application does not directly use the GGCM for the generation of the texture image. The GGCM is used to derive the necessary texture measurements, which are features that characterize the texture such as Energy, Contrast, Homogeneity, Entropy correlation, etc. (6) Window size: It is very important to choose a suitable sliding window size when using GGCM to do texture analysis, since the texture structure is different under different windows (3×3, 5×5, 7×7, 9×9, 11×11, 13×13). In order to explore the correlation between the above texture measurements, texture information was extracted using GGCM under five window sizes (3×3、5×5、7×7、11×11、13×13), and five kinds of texture measurement images were generated. When the correlation between these images was analyzed, results showed that the relationship among the texture measurement Energy and other texture measurements is very small. Homogeneity shows a negative correlation with other texture measurements, and the correlation that Contrast has with other texture measurements changes with window size, indicating that texture measurement was sensitive and impacted by the window size. Changes in the texture measurements Homogeneity, Dissimilarity, Energy, Entropy under different window sizes are small and have strong stability. After the selection of forest classification samples, semivariogram was used to determine the optimal window size of the sample texture element. The optimal window size of six forests (Cold coniferous forest, temperate coniferous forest, warm coniferous forest, deciduous broad-leaved forest, broad-leaved evergreen forests, coniferous and broad-leaved mixed forest) was determined by using semivariogram. On the basis of GGCM, texture features of the various types of forest were extracted for classification (Table 2). Table 2. Interpretation features of remote sensed image Type Cold forest
Image Feature coniferous
Typical texture
Red,dense uniform
Temperate coniferous forest
Ruddy, uniform and dense
Warm coniferous forest
Bright red, the tone is even, not dense
Deciduous broad-leaved forest
Taupe brown, the tone is not even, not dense
Broad-leaved evergreen forests
Red and yellow, color uneven, intermingled with a small amount of dark purple-red spots
Distribution Distributed at an altitude of about 3100-3800m, up to about 4450m Distribution at an altitude of about 2600-3100m, down to 2500m, up to 3300m Concentration of distribution at an altitude of 1500-2500m, upper reaches about 2700m Distribution at an altitude of about 2800-3200m, down to 2700m, up to 3300m Distribution at an altitude of about 2800-3300m
5
35th International Symposium on Remote Sensing of Environment (ISRSE35) IOP Publishing IOP Conf. Series: Earth and Environmental Science 17 (2014) 012071 doi:10.1088/1755-1315/17/1/012071
Coniferous and broad-leaved mixed forest
Bright red and brown mixed, tone is not dense
Distribution at an altitude of about 2700-3500m
In order to achieve a good classification, it is usually necessary to select a large number of samples. Supported by ENVI4.8, the sample set can be optimized. It uses the statistical index (maximum, minimum, median) and produces a statistical sample curve, and the user can make a manual optimization of the sample according to the statistical curve. The sample curve after optimization maintains high similarity in rules and shape, trend, and sample separation between 1.99-2.0, is well separated, and is more conducive to follow-up classification (figure. 3).
Figure 3. Warm coniferous forest sample comparison before and after optimization 4.3. Forest classification and accuracy assessment The selection of the appropriate training samples is the key to supervised classification. The training samples of the final choice should be able to accurately represent the spectral feature differences of the whole region in each category. Firstly, the classification templates in the image were defined, then supervised classification is conducted using the method of the maximum likelihood in the study area. The classification image is compared with the original images and reference maps, and if there are large deviations in the classification image, the classification templates must be temporally updated. Then the image is re-classified until all the typical features and their scope can be properly separated from the image. In the classification process, some very small patches are produced in the map, and it is necessary to do cluster analysis and removal analysis. Then the raster image is transformed into the vector image. If necessary, smoothing analysis is done in the vector image by ArcGIS. Using the 2009 TM vegetation index image histogram in the study area, the NDVI threshold between vegetation and non-vegetation area was set at 0.3255 based on the special significance of the inflection point of the statistical principle, and forest classification was carried out to obtain the vegetation area, non-vegetation area and total study area classification maps (figure 4). Under the support of ENVI4.8, the evaluation points were randomly generated by a computer for the assessment of accuracy. Specific pixels in the thematic image were compared with field data and expert knowledge to test accuracy. The results showed that: the classification accuracy of remote sensing images was 79.80% in 2009, higher in classification accuracy than the method of only using spectral characteristics (74.46%)[18].
6
35th International Symposium on Remote Sensing of Environment (ISRSE35) IOP Publishing IOP Conf. Series: Earth and Environmental Science 17 (2014) 012071 doi:10.1088/1755-1315/17/1/012071
5. Conclusions By using the ETM+ image as a data source, research on the extraction of texture information and forest classification in Shangri-La County in Northwest Yunnan was carried out. It is believed that: (1) Combining two methods--GGCM and wavelet transformation--to extract the texture information of forest types produces results that are better than only using single measures of texture information abundance, texture boundary, entropy, etc.; (2) When extracting the texture information of forest types, forest type texture window size determined by the semivariogram will change with forest type variation (the optimal window of evergreen broad-leaved forest is 3×3, deciduous broad-leaved forest is 11×11, cold coniferous forest is 5×5, and temperate coniferous forest is 9×9); (3) According to remote sensing technology-based forest classification based on texture information, different forest texture extraction window sizes differ, and one should choose different combinations among forest texture factors. Making full use of the forest vegetation texture information can improve the precision of remote sensing classification of forest. There are many methods of extracting the texture Figure 4.Vegetation areas information, and the methods to be chosen should be based on classification the actual application needs. In the extraction of texture information, the algorithm needs to be improved in its operation and operation efficiency. For texture extraction using MATLAB programming, computing speed is slow, the computation amount is large, and the efficiency is not ideal. Remote sensed images contain a great deal of useful information for improving the classification accuracy. In addition to the use of spectral information and texture information, we can use the object segmentation, shape parameters, etc. to carry out classification. In the future we should find more information help to improve classification accuracy. Acknowledgments This research was financially supported by the National Natural Science Foundation of China (Grant No. 40861009 and 41271230) and the Reserve Personnel Training Program of Middle-aged Academic and Technology Leaders of Yunnan Province (Grant No. 2008PY056). References [1] Brown, S.L and Schroeder P.E. 1999 .Spatial patterns of aboveground production and mortality of woody biomass for eastern U. S. forests . Eco. Appl.9 968-980. [2] Ji-yuan,LIU.Gui-rui,YU and Shao-qiang,WANG.2003.A method of geo-information science for studying carbon cycle and its mechanism of terrestrial ecosystems J.Geogr Res.22(4) 397-405. [3] Yinqing, Li & Ninhui, Huang. 2006Talking about the Application of the Remote Sensing Technique in the monitoring of forest resources in China J . Prot Forest Sci Technol 6(4) 61-64. [4] Xianwen, Zhao & Chonggui, Li Quantitative 2001. Estim forest resources based "3S" -- princ, meth, appl softw. (Beijing: Chinese science and technology press). [5] Chao,ZHANG and Yan,WANG.2010. Research Advances in Forest Type Classification by Remote Sensing Technology J . J. Southwest Fores Univ 6 83-89.
7
35th International Symposium on Remote Sensing of Environment (ISRSE35) IOP Publishing IOP Conf. Series: Earth and Environmental Science 17 (2014) 012071 doi:10.1088/1755-1315/17/1/012071
[6] HARALICK R M 1973.Textural features for Image Classification J.IEEE Trans SMC. 3(6) 610-621. [7] Randen, T.and Husoy, J.H. 1999 . Filtering for texture classification: A comparative study. IEEE Trans. Patt.Anal. Machine Intel. vo.21, no.4, 291-310. [8] S. E.Franklin et al Incorporating texture into classification of forest species composition from airborne multispectral images J.Int.j.remote sensing. 2000, vol.21, no.1, 61-79. [9] Jin, Li 2010. Determination of Forest Texture Construction Factors Based on Glcm D. Zhejiang Agric Fores Univ . 1-88. [10] Yuhui, Bi 2007. Study on Forest Texture Extracted from Color Aerial Images D. Beijing Fores. Univ. 2-141. [11] Deng-feng,WANG. Zhi-gang,YANG and An-shi,WEI 2010. Application of texture information on classification of remote sensing imagery J . J Nanjing Fores Univ(Nat Sci Ed) 34 98-100. [12] Bo,CHEN. You-jing,ZHANG and Liang,CHEN 2007. RS Image classification based on SVM method with texture J. Engin Surv Mapping .16 25-27. [13] Zoucgeng,Wang 2007.Research on Classification of remote sensed image with Texture D. Southwest Jiaotong Univ 1-141. [14] Qing-xiang ,JIANG 2004 .LIU Hui-ping. Extracting TM Image Information Using Texture Analysis J. J Remote Sensing. 8(5) 485-464. [15] Ruiqiong, Huang 2006. Multi-scale Texture Analysis and Its Application on remote sensed image Classification D. Fuzhou Univ. 1-88. [16] Wen-ping, Jin-liang,WANG and Hua-ming,KE 2007. Research on acquiring information of LU/LC by remote sense image based on GIS——a case study of shangri-la county .The northwestern yunnan J. Yunnan Geogr Envir Res. 19(2) 98-102. [17] Jinliang ,Wang 2006 .land-use/land-cover change in last 30 years in Shangri-La R .19-24. [18] Xiaohua Wang, Jinliang Wang, Jie Yin and Yinxia Gao 2010.Study on the Forest Landscape Spatial Patterns of the Northern Shangri-La C In the proceedings of 18th international conference on Geoinformatics(GeoInformatics 2010), Jun. 18-20 . Beijing China(EI(Accession number:20104313318677)) [19] Fa-rong, SONG 2008. Current Status and Characteristics of Forest Resources in Shangri-la County J .J west chin fores sci .37(1) 124-128. [20] Editing Dep Shangri-la County Yearbook 2008. Yearbook of Shangri-la County (Kunming: Yunnan Fine Arts Publishing House). [21] Xingliang ,Wei 1997.Study on forest landscape classification J.East Chin For Man 11(2) 29-33. [22] Xiaoyi,Cheng. Jianzhong, Ni and Lei,Cao 2006 . Forest landscape classification and evaluation of landscape sensitivity based on 3S technology J .J Jiangsu Fores Sci & Technol. 33(4) 55-57. [23] Zhixi, Li 1995.Diqing Forest Remote Sensing .(Kunming: Yunnan Science Press) pp.18-19. [24] YuFeng,ZHOU and Jing-Quan, CHENG 2008, Wavelet transformation and its applications J. Phys 37(1) 24-32. [25] Junmin,Wang 2005. Small target detection based on mathematical morphology and Wavelet transform D. Univ Electr Sci Technol Chin 1-67. [26] De long, ZHOU. Shi lei,SHEN. Xiao bo, PU 2002. Maximum Entropy Thresholding Algorithm Based on the Gray Level-Gradient Co-occurrence Matrix J. Mini-micro Syst. 2(2) 136-141. [27] Jiguang, Hong 1984, Gray level-gradient cooccurrence matrix texture analysis method J. Acta Autom Sinica. 10(1) 22-25.
8