JOURNAL OF THE INTERNATIONAL ASSOCIATION FOR SHELL AND SPATIAL STRUCTURES: IASS
FORM-FINDING OF A GRID SHELL IN COMPOSITE MATERIALS C. DOUTHE, O. BAVEREL, J.-F. CARON Institut Navier -- LAMI, Ecole Nationale des Ponts et Chaussées 6 et 8, avenue Blaise Pascal - Champs-sur-Marne - F-77455 Marne-la-vallée cedex 2
[email protected],
[email protected],
[email protected] Editor’s Note: Manuscript submitted 19 September 2005; revision received 3 March 2006; accepted for publication 5 March 2006. This paper is open for written discussion, which should be submitted to the IASS Secretariat no later than December 2006.
SUMMARY The advantages of the use of glass fiber composites for grid shell are presented. The shape of grid shells results from a post-buckling state of tubes. To bypass the difficulty to predict the geometry of the final equilibrium state, the large rotations which occur during the erection process are modelled using the dynamic relaxation algorithm. This paper proposes an adaptation of this method for structures prestressed by bending through the development of a computer program. It includes the validation of this numerical tool through comparisons with a finite elements software. Then an application to the form-finding of a grid shell and the study of its stability under standard loading conditions will be presented. Finally the authors conclude on the technical and economic feasibility of this composite grid shell. Keywords: Composite material, Dynamic relaxation, Grid shell, form-finding, non-linear analysis. 1. INTRODUCTION In the last twenty years many applications of composite materials in the construction industry were made. The main field of application concerns the reinforcement of concrete beams with carbon fiber plates [1] or post tension cables. But more recently, a footbridge with carbon fiber stay-cable was build in Laroin (France, 2002), another footbridge, all made of glass fiber composite, was build in Aberfeldy (Scotland, 1993) and a movable bridge (the Bonds Mill lift bridge in Stonehouse, England, 1995). Nevertheless applications using composite materials as structural elements remain exceptional in comparison with concrete, steel or even wood. Although the qualities of their mechanicals properties are obvious (low density, high strength and high resistance against corrosion and fatigue), their relatively low elastic modulus make their use in usual buildings more expensive than other traditional materials. In order to take advantages on every characteristic of composite materials, new structural concepts must be found. The LAMI-ENPC is therefore developing a project of innovating footbridge [2] and an experimental grid shell. This last project takes place in the
framework of a research on structures for shelters for temporary or permanent purposes [3]. Its structural analysis was first presented in CCC2005 [4] and will be detailed in this paper. Four design principles guided the conception stage of this experimental grid shell: - Optimal use of the mechanical characteristics of the fibers; - Simple connection between components of the structure; - Optimal design according to its use; - Cheap material cost toward use of components already available in the industry. 2. GRID SHELLS 2.1. Definition of grid shells The name of grid shell commonly describes a structure with the shape and strength of a doublecurvature shell, but made of a grid instead of a solid surface. These structures can cross large span with very few material. They can be made of any kind of material - steel, aluminium, wood or even cardboard tubes… Generally, the metallic structures are made of short straight elements defining a facet
VOL. 47 (2006) n. 150
geometry. The complexity of this geometry requires the development of many clever and expensive assemblies. To mitigate this disadvantage, a very specific erection process was developed that uses the ability of slender components to be bent. Long continuous bars are assembled on the ground, pinned between them in order to confer on the grid a total absence of plane shear rigidity which will allow large deformations. The grid is deformed elastically by bending until the desired form is obtained and then rigidified. Three grid shells were built in the world using this method: the Mannheim Budesgartenshau (Frei Otto, 1975), the Weald and Downland Museum (E. Cullinan, Happold, 2002) [5] and the Japanese pavilion for the Hanover 2000 Exhibition (Shigeru Ban, Happold). The structure of the first two grid shells is made of wooden bars, while that of the third one uses cardboard tubes, locally reinforced with wooden arches. 2.2. The choice of the material
Moreover with standard diameters of tubes, standard swivel scaffolding elements (see figure 1) already available in the industry could be used for the realization of the connection between the tubes. Hereby the material cost can be once again very effective. This is why these technical solutions seems to be appropriate for the construction of grid shells, and could contribute to the development of this type of structures.
Figure 1: Standard swivel scaffolding elements
2.3. The existing form-finding methods In this process of assembly, initial bending strains are induced in the element of the lattice structure. In the existing grid shells, wood was chosen because of its low density and high limit strain (about 2%) but not for its strength (30 MPa at best). Glass fiber reinforced polymer (GFRP) exhibits a strength of about 350 MPa and a limit strain of about 1.5% for only 1.9 kg/m3. Glass fiber reinforced polymers have therefore much higher rigidities (from 20 GPa to 40 GPa) than wood (around 10 GPa), so that, for a given geometry of grid shell, the buckling load of a composite grid shell will be higher than for a wooden grid shell. These mechanical properties make thus the use of GFRP very attractive for this kind of application. As the stresses in the beams are almost exclusively axial stresses, fibers are required only in the main direction of the beam. Therefore the industrial process of pultrusion would provide a cost-effective method for the production of unidirectional composite materials. It will also allow the production of very long tubes that would avoid the problem of joining the wood cleats. To improve the performance of the section of the tube, one could also choose a circular pull-winded tube with fiber perpendicular to the axis of the tube. It will raise the limit strength and avoid the ovalization of the section, but it will also raise the cost of the material production of about 15% in comparison with the pultrusion process.
In grid shells structure, the elastic strain of the phase of assembly imposes large displacements on the beams and induces thereafter a state of bending prestress. The search for stable and aesthetic forms (the so called form-finding step), the evaluation of strains and the optimization of their distribution in the various elements require taking into account those large displacements and being able to model strong non-linearity. The grid shell of Mannheim of 1975 was conceived by inversion of a cable net subjected to its own weight as shown in [6] and by work on equivalent small scale models. This method was only a first approach of the form of grid shells because the reverse hanging method leads to simple compression stresses whereas, in grid shell, the initial state of stresses combines bending, compressive and tensile stresses. Today, the power of computer has considerably increased and the calculation can be carried out using finite element methods. However, usual algorithms (Newton-Raphson for instance) quickly present significant computing times and problems of convergence due to the high level of rotation and displacement. These difficulties of the modeling of a form-finding step not only concern grid shells, but also a various type of structures among which tensile structures. For this type of structures, two
JOURNAL OF THE INTERNATIONAL ASSOCIATION FOR SHELL AND SPATIAL STRUCTURES: IASS
specific methods were developed and are today widely used in Europe: firstly the force density method [7] and its extension to a continuous geometry, the surface stress density method [8] and secondly the dynamic relaxation method. This method is the only one that was extended to the form-finding of grid shell and will be thus developed below. 3. THE DYNAMIC RELAXATION METHOD 3.1. History The dynamic relaxation method was developed by A. S. Day studying marine streams. In this original technical solution, static equilibrium is regarded as the limit equilibrium condition of strongly damped vibrations. The first application to tensile structures and hanged roofs was carried out by Day [9]. Then came the works of M.R. Barnes on form-finding and his first applications to prestressed cable nets [10], to membranes and inflatable structures [11], and to structures with bending rigidity and to grid shells [12]. One can also easily find other examples of complex structures calculated by dynamic relaxation like cable-domes [13]. Today this method has been applied to many fields of mechanics, such as for example a study on metallic foams performed in the ENPC and the Navier Institute [14]. “The basis of the method is to trace step-by-step for small time increments, the motion of each node of a structure until, due to artificial damping, the structure comes to rest in a static equilibrium.” [11]. In the original version of the DR method, a parameter of viscous damping proportional to the speed and the mass of the nodes was used. But to ensure the convergence of the process, it was necessary to introduce controls and adjustments on those various parameters [15]. This method remains relatively delicate to implement, so that an alternative procedure of kinetic damping will be preferred in this paper. Kinetic damping is an artificial damping whose principle relies on the exchange during the movement, for a conservative system, between kinetic energy and potential elastic energy which one seeks the minimum. In this procedure, the oscillations of the structure start from an arbitrary geometry and are free until a maximum of kinetic energy is reached. The structure is then stopped: all speeds are given artificially to zero. Then the structure is again free
to oscillate to the next maximum of kinetic energy where, like previously, speeds are given to zero. And so on, until the kinetic energy of all the modes of vibrations is dissipated. 3.2. Modeling the movement of the structure The initial grid is made of long continuous beams. They are set up in two principal directions with a regular spacing between them. These beams follow an Euler-Bernoulli model and their behavior is linear elastic. The beams in one direction are pinned with the beams in the other direction of the grid so that there are no bending stresses induced by the connection. No external bending moment is applied. The beams are thus subjected only to shear and normal forces. One can then show by considerations of structural mechanics, that there is no torsion in initially straight beam under such a load if its principal inertias are equals [12]. Each beam is thus modeled like a tube of Young modulus E, inertia I and section S. Each node of a beam has three translational degrees of freedom so that the position of node i will be noted by the vector Xi. The calculations start from an arbitrary geometry. In this initial state, the system is unstable and will move under the actions of the internal stresses and external loads. The internal stresses in the current geometry are computed using the stress free state of the structure. To describe the movement, the position of every node is calculated for each timestep ∆t until balance. First consider that the position Xit of every node i at time t is known and that their speed Vit-∆t/2 at time t∆t/2 is known too. The acceleration γit at node i and time t is given by the second law of Newton (1) from the resultant Rit of all forces applied to node i and from its mass mi.
R i = mi ⋅ γ i t
t
(1)
To go up to the speed Vit+∆t/2 of node i at time t+∆t/2, a centered approximation scheme is uses for the acceleration, so that one can deduce the expression of the speed according to (2). t + ∆t 2
Vi
t − ∆t 2
=V i
+
∆t t ⋅ Ri mi
(2)
Using again a centered approximation, one obtains (3) the position Xit+∆t of node i at time t+∆t:
VOL. 47 (2006) n. 150 t + ∆t
Xi
t + ∆t 2
t
= X i + ∆t ⋅ V i
(3)
From the new positions Xjt+∆t of all the nodes j connected to node i, one can then calculate the internal forces Fiint at node i and time t+∆t, add to them the external load Piext and so define the resultant Rit+∆t (4) of the forces applied to node i at time t+∆t.
R
t + ∆t i
=P
ext i
+ ∑ F (X
t + ∆t i
int i, j
,X
t + ∆t j
)
At the boundary, the displacements are constrained, but not the rotations. The compatibility of the movement with the boundary conditions is ensured at each step during the calculation of speeds, by setting certain components to zero. This verification was chosen because it allows computing directly the kinetic energy on compatible speeds. 3.3. Internal forces Internal forces in a beam are of two natures: traction-compression and bending. The modeling presented hereafter adopts that proposed by M. R. Barnes [11], extends it to a three dimensional problem and to a more sophisticated modeling of connection between the elements. Axial stresses
Ti-1,i
Li-1,i
(6)
For the calculation of cable elements, one can easily introduce non linearity by not tacking into account the force in the cable if it is subjected to compression. Bending stresses For the calculation of bending stresses, let us first make the assumption that three successive nodes of a beam are always sufficiently close so that one can suppose that they are on a circle of radius ρit (see figure 3). Mi
αi
i
Fi-1,i i-1
Li-1,i
Fi,i+1
Fi-1,i
Fi,i+1
Li-1,i+1 Li,i+1
i+1
Figure 3: Scheme of bending stresses
Let us first consider the diagram of figure 2 of a portion of an arch constituted of three nodes (i-1, i and i+1).
i-1
1 1 t t T i , j = ES ⋅ 0 − t ⋅ X i , j L i , j Li , j
(4)
j
ESi-1,i
One can then deduce the deformation εti,j from the length of the beam L0i,j in the stress-free geometry, its length Lti,j at time t and the position Xi+1 and Xi-1 of the two adjacent nodes. Their expression is given in (6), where Xti,j denotes the relative position Xj-Xi and Li,j its norm.
i -Ti-1,i Ti,i+1
This radius will be regarded as the radius of curvature at node i and time t. It can be calculated from the positions of the three nodes (7), where sin αti is given by (8):
ESi,i+1 Li,i+1 -Ti,i+1
ρ = t i
i+1
Lti −1,i +1
t
Figure 2: Scheme of the axial stresses
with
At each current node i of a beam, there are two forces of compression-traction Tti-1,I and Tti,i+1 related to the two connected elementary beams. At time t, these forces are calculated for each elementary beam according to its stiffness ESi,j (where j stands for i-1 or i+1), and to the axial strain of the centroid of the beam εti,j (5).
Ti ,t j = ES i , j ⋅ ε it, j
(5)
sin αit =
(7)
2 ⋅ sin αit t
X i −1,i ∧ X i ,i +1 Lti −1,i ⋅ Lti ,i +1
(8)
Then, from the mechanics of materials, one deduces the bending moment Mit at node i and at time t (9):
M it =
EI i
ρit
(9)
The direction of the bending moment is perpendicular to the local plane of curvature that is
JOURNAL OF THE INTERNATIONAL ASSOCIATION FOR SHELL AND SPATIAL STRUCTURES: IASS
given by the cross product Xti-1,i x Xti,i+1 so that the final expression of the bending moment Mti is (10). t
t
2 ⋅ EI X i −1,i ∧ X i ,i +1 M = t i ⋅ t Li −1,i +1 Li −1,i ⋅ Lti ,i +1 t i
(10)
For more convenience, this bending moment Mti will be transformed into equivalent forces applied to the nodes. Therefore let us consider the righthand side of the beam. If the reaction Fti-1,i at node i-1 is assumed to be perpendicular to Xti-1,i, one can deduce from the balance of the forces due to the moment Mit the value of Fti-1,i (11). t
F
t i −1,i
=
t
X i −1,i ∧ M i Lti −1,i
2
(11)
3.5. Stability and convergence
In the same way, the balance of the left hand-side gives Fti,i+1 (12). t
F
t i ,i +1
=
t
X i ,i +1 ∧ M i Lti ,i +1
thickness that induces an eccentricity between those nodes. If these eccentricities act as geometrical imperfections, one can expect a great loose of resistance of the structure. However in these first calculations, the eccentricities between the axes of the beams will be neglected and it will be assumed that the connected nodes have the same spatial position. Then, according to the method exposed higher, one calculates the internal forces associated to the current geometry for each beam separately. It is considered that the total force applied to each node is the sum of the internal forces of each node. Initially at the same spatial position, the nodes of the various beams are subjected to identical forces at every time, they thus remain at the same spatial position.
2
(12)
And so the moment Mit at node i is broken up into a set of four forces directly connected to the current geometry of the beam. Two are applied to node i, one to node i+1 and one to node i-1. If the structure studied is a plane structure that is loaded in its plane, beams with initial curvature can be modelised by taking it into account in the expression (9) of the bending moment. But if the problem is not plane, the introduction of beams that are not initially straight will invalidate the assumption that no torsion appears. It will be then necessary to introduce a rotational degree of freedom at every node. An advantage of this modification will be that it would allow the modeling of beams with different inertia in the two principal directions. It would also make the algorithm more versatile for the study of prestressed structures in large displacements and rotations taking into account the lateral torsional buckling. 3.4. Efforts at connection points At connection points, there is an interaction between beams. To model this interaction, one defines separately, at any connection point, a node on each beam. The connection element has a
To accelerate the speed of convergence, so that the system evolves faster to its position of equilibrium, one can increase the time step or decrease the nodal fictitious masses. Nevertheless, when the time step exceeds a certain breaking value or the fictitious nodal masses become too low, numerical instabilities appear. The phenomenon is explained simply in [10]. The generalization of the problem to a system of beams, at every moment requires the knowing of the total stiffness corresponding to the various efforts being applied to the node. For a current beam, the ratio EI/ES is about 1/100 so that, in a first approach, the bending stiffness can be neglected in comparison to the tension stiffness. Thus, at the beginning of the calculation of a peak, the fictitious masses mti are fixed according to the total axial stiffness of the beams connected to the node i and can be written as (13): peak i
m
ES T peak ∆t 2 =λ⋅ ⋅ ∑ 0 + 0 2 L j L
i, j
(13)
In this expression, λ is a parameter slightly higher than 1 that insures the stability of the algorithm and an acceptable time of convergence. (ES/L)i,j represents the axial elastic stiffness and (T/L)ti,j the geometric stiffness of each elementary beam. Tti,j is the current tension in the beam which is calculated according to the axial elastic stiffness and the current strain of the element at time t. To accelerate convergence, the fictitious masses are reset at every energy peak according to the current geometric stiffness.
VOL. 47 (2006) n. 150
4. VALIDATION OF THE PROGRAM The dynamic relaxation algorithm of section 3 was implemented in a free scientific software package named Scilab™ [16], developed in common by the ENPC (Ecole Nationale des Ponts et Chaussées) and the INRIA (Institut National de Recherche en Informatique et Automatique). The 2D-validation comprises several tests: -
checking of the stability of the algorithm; convergence of the results and influence of the number of elements; comparison of the results with those obtained with the finite element method using Abaqus™.
4.1. 2D-Validation The “elastica” (the post-buckled curve of a pinended beam) provides a useful comparison because there is an analytical expression of the deformed shape of the beam (Euler 1744). The numerical test example is a tubular straight beam of 12 m length, 50 mm diameter and 2 mm thickness with a Young modulus of 35 GPa. The beam, supported on end rollers and restrained to lie in the plane xz, is subjected to opposite end axial loads of 1000 N that will cause the looping of the beam (see figure 4).
the FEM, the reference values are the results of the beam divided in 100 elements and that for the DR, the number of elements of the beams vary from 10 to 100. The whole results are presented in table 1. The maximal displacements Ux and Uz are in cm, the normal forces in N and the maximal bending moment Mmax in N.m. Nb of elem. 10 20 30 DR 40 50 100 FEM 100 theory Cont. Model
Uxmax (cm) 3,566 3,552 3,52 3,512 3,513 3,513 3,512 3,46
Uzmax (cm) 8,614 8,421 8,409 8,40 8,394 8,384 8,38 8.42
X Figure 4: Buckled beam
For the dynamic relaxation algorithm, the EulerBernouilli model of section 3 is implemented. For the finite elements method (FEM), an elastic Timoshenko’s model of beam with 6 degrees of freedom per node was chosen. The geometrical non-linearity solver implemented is the NewtonRaphson method. The first aim of this validation is to compare the results for the dynamic relaxation (DR) model and the FEM. The second aim is to test the influence of the discretization for the DR model. Note that for
Nmax (N) 728 947 974 979 992 999 999
Mmax (Nm) 3 460 3 451 3 451 3 447 3 445 3 440 3 441 3460
Table 1: Results comparison (2D)
Table 1 shows that the results of the model are very close from those obtained with the finite element method (less than 1‰ error). The differences that remain between the analytical continuous model and the two others are due to the fact that the numerical models take into account the strain energy related to normal forces and not only to the bending moment. The table shows also that the DRmodel provides accurate enough results (less than 3% error) with only 20 elements. DR
Z
Nmin (N) -968 -968 -969 -969 -969 -969 -969
Nb of element 10 20 30 40 50 100
Time (sec) 28 112 256 442 681 3502
Nb of iter. 3374 7580 12084 15409 19779 50592
FEM Time Nb of (sec) iter. 36 57 35 58 35 59 36 62 37 66 41 70
Table 2: Computing time comparison (2D) On this elementary problem, the comparison of the computing times between the two methods (see table 2) shows that dynamic relaxation requires much more time than the finite element method. Actually for the dynamic relaxation, the buckling movement is very long to initiate as it can be seen on the history of the kinetic energy in figure 5. To improve the computing times, it is necessary to
JOURNAL OF THE INTERNATIONAL ASSOCIATION FOR SHELL AND SPATIAL STRUCTURES: IASS
choose an initial geometry that is not too far away from the equilibrium geometry. In this particular case a parabola of about 3.5 m height and 12 m length provides much better computing times (4562 iterations in 108 seconds) for the same precision. KE in J
The convergence of the DR algorithm was tested by changing the number of elements of the each beam from 6 to 60. During the tests, the maximum displacements were measured in every direction (Ux and Uz; as the problem is symmetrical, Ux = Uy) and the maximum reactions Rz. Results are presented below in table 3. Once again the results of the dynamic relaxation model are very close from those obtained with the finite element method (less than 1% error). Like previously, it is remarkable that this accuracy can be obtained with very few elements (24 elements). Model
time in s DR
Figure5: History of the kinetic energy
4.2. 3D-Validation
FEM
The 3D validation is based on a square grid of beams, five in each direction x and y (see figure 6). The beams are the same as for the 2D-validation: tubular straight beams of 12 m length, 50 mm diameter and 2 mm thickness with a Young modulus of 35 GPa. The distance between two successive beams is 2 m. The beams are supported on end rollers and loaded upwards at every connection point with 200 N. At connection point, the rotations between the beams are free.
Uxmax (in m) 1,42 1,37 1,35 1,34 1,36
Y
Uzmax (in m) 3,41 3,33 3,3 3,29 3,31
Rzmax (in N) 434 450 458 458 459
Table 3: Results comparison (3D)
Looking now to the results of table 4, the conclusion of the comparison of the computing time between the two methods is not as obvious as in the two dimensional case. Actually for 60 elements the finite element method still converges faster than the dynamic relaxation. But one can observed that the FEM had great difficulties to converge for a smaller number of elements, where the DR-model still has quick convergence. DR
Z X
Nb of elem. 6 12 24 60 60
Nb of elements 6 12 24 60
Time (sec) 61 345 938 7572
Nb of iter. 1086 3840 5520 18392
FEM Time Nb of (sec) iter. >3.105 >106 >2,5.105 8,5.105 >1,5.105 7.105 188 287
Table 4: Computing time comparison (3D) Figure 6: Post-buckled grid
As for the 2D-validation, the Euler-Bernouilli model of section 3 is implemented for the dynamic relaxation algorithm. And for the finite element model, an elastic Timoshenko’s beam element with 6 degrees of freedom per node was chosen and the geometrical non-linear solver is again the NewtonRaphson method.
In the same way, if the loading is doubled to 400 N per node (in the 24 elements per beam model), the computing time of the FEM goes over 40 hours where the computing time of the DR remains quite equal to that obtain for 200 N per node (3968 iterations in 674 seconds). Thus, it can be concluded that the DR provides accurate results and is much less sensitive than the common NewtonRaphson Method used for the FEM.
VOL. 47 (2006) n. 150
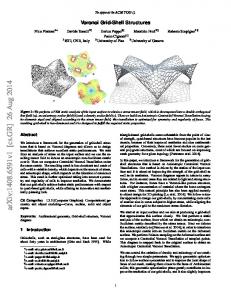
To complete this study, the geometry of this grid shell was compared to the geometry of a hanging net with the same initial pattern submitted to its own weight. The geometric characteristics of the cables are the same as that of the bars. The boundary conditions of the hanging net are those of the results of the form-finding step of the associated grid shell. It is found that the average gap between the two configurations is of about 70 mm with a standard deviation of 115 mm. The maximum error made on the vertical position of a node is about 6%. So, if one considers that the errors on the positions of the nodes have very important consequences on the conception of the cladding, the effect of the bending rigidity shall not be neglected for the calculations of grid shells. 5. STUDY OF A GRID SHELL 5.1. Description of the structure The grid shell presented here in figure 7 is made from an orthogonal grid of circular hollow beams of 50 mm diameter and 2 mm thick. The space between two consequent beams is about 0.75 m. In the initial state the perimeter of the grid is made of two semi-circles of radius 7 m separated by a rectangle of 14 m length and 6 m width (figure 7).
The characteristics of the grid shell in its final form are presented below: Height: Width: Length:
5.80 m; 13.0 m; 13.5 m;
Total length of beam: Total length of cables: Number of connections:
670 m; 900 m; 463;
Livable surface (h>1.8m): Surface of the envelope: Weight of the structure: Ratio thickness/Span:
72 m²; 225 m²; 8.5 kg/m²; 1/270.
These last two characteristics have to be compared with standard steel shed which structural weight is about 20 kg/m2 and which ratio thickness per span relies by 1/25. Grid shell are thus very light and extremely thin structures. Therefore their behavior under external loads has to be investigated.
Figure 8: Final shape of the grid shell Figure 7: Initial state of the grid
The grid is then deformed elastically. It is pushed upwards at every connecting node and submitted to horizontal forces all around the boundaries in the initial plane of the grid. These actions provoke a global buckling of the grid and a shortening of the length of the grid shell. Once an aesthetic form is reached, the extremities of the beams are fixed to the ground with free rotations. The final form of the grid shell is in equilibrium with prestresses due to the bending in the beams and the actions of supports. The form-finding of the structure is yet to the end, the grid shell can be stabilized (figure 8) with, in our example, steel cables of 5 mm diameter in order to give it a shell like behaviour.
5.2. Test under climatic action The grid shell was tested numerically when it is subjected to snow and wind load. The calculations were done with the DR program that performed here the non-linear analysis of the structure and predicts its instability. The values of climatic actions are taken from the Eurocode 1. The grid shell is virtually located next to the ENPC in Paris, so that the wind pressure will be taken equal to 780 Pa and the reference snow load to 36 kg/m². To compute the different pressure coefficients, it is assumed that the geometry of the grid shell is closed to that of a spherical dome.
JOURNAL OF THE INTERNATIONAL ASSOCIATION FOR SHELL AND SPATIAL STRUCTURES: IASS
Several directions of wind were tested in order to choose the direction that implies the largest deflection of the grid shell. The worst condition is an angle of 45° with principal directions of the grid. A service limit state (SLS) combination of actions is calculated with the chosen wind load and the associated anti-symmetric distribution of snow.
Maximal displacement in cm
In some primary tests the importance of the cables stiffness was observed. With the chosen diameter of the cables, the deformations of the grid shell are acceptable (